Containers
Fluent Bit Integration in CloudWatch Container Insights for EKS
Ugur KIRA, Dejun Hu, TP Kohli
CloudWatch Container Insights
CloudWatch Container Insights enables you to explore, analyze, and visualize your container metrics, Prometheus metrics, application logs, and performance log events through automated dashboards in the CloudWatch console. These dashboards summarize the performance and availability of clusters, nodes or EC2 instances, services, tasks, pods, and containers running on Amazon Elastic Container Service (Amazon ECS), Amazon Elastic Kubernetes Service (Amazon EKS), AWS Fargate, and self managed Kubernetes clusters. CloudWatch Container Insights automatically collects infrastructure metrics such as CPU, memory, disk, and network. It also provides diagnostic information, such as crashloop backoffs in an EKS cluster, to help you isolate issues and resolve them quickly. The metrics that Container Insights collects are available in CloudWatch automated dashboards. They are also viewable in the Metrics section of the CloudWatch console, where you can build custom dashboards and setup CloudWatch alarms on metrics that Container Insights collects. To learn more, you can visit the Observability Workshop.
Introduction to Fluent Bit
Fluent Bit is an open source and multi-platform log processor and forwarder that allows you to collect data and logs from different sources, and unify and send them to different destinations including CloudWatch Logs. It’s also fully compatible with Docker and Kubernetes environments. Using the newly launched Fluent Bit daemonset, you can send container logs from your EKS clusters to CloudWatch logs for logs storage and analytics.
Due to its lightweight nature, using Fluent Bit as the default log forwarder in Container Insights on EKS worker nodes will allow you to stream application logs into CloudWatch logs efficiently and reliably. With Fluent Bit, Container Insights is able to deliver thousands of business critical logs at scale in a resource efficient manner, especially in terms of CPU and memory utilization at the pod level. In other words, compared to FluentD, which was the log forwarder used prior, Fluent Bit has a smaller resource footprint and, as a result, is more resource efficient for memory and CPU. On the other hand, AWS for Fluent Bit image, which includes Fluent Bit and related plugins, gives Fluent Bit an additional flexibility of adopting new AWS features faster as the image aims to provide a unified experience within AWS ecosystem.
As noted in issue 920 of the public AWS Containers roadmap, CloudWatch Container Insights does not support EKS on Fargate yet. However, by using FireLens, which is a container log router, you can take advantage of the lightweight nature of Fluent Bit. To achieve a similar observability experience like Container Insights for EKS clusters on Fargate, you can review Fluent Bit for Amazon EKS on AWS Fargate for logging and Amazon EKS on AWS Fargate using Prometheus and Grafana for cluster monitoring perspective.
CloudWatch Container Insights can also generate metrics that allow you to track the performance of the Fluent Bit processor using custom dashboards. Having such a dashboard configured enables you to visualize and detect any change in your log streams or potential bottleneck/delivery errors on the log destination in real time.
Multiple log input streams into CloudWatch logs
While working with containers, it is recommended to push all the logs, including application logs, through the standard output (stdout) and standard error output (stderr) methods whenever possible using the Docker JSON logging driver. For this reason, in EKS, the Docker JSON logging driver is configured by default and everything that a containerized application writes to stdout or stderr is streamed into a JSON file under “/var/log/containers" on the worker node. Container Insights classifies those logs into three different categories by default and creates dedicated input streams for each category within Fluent Bit and independent log groups within CloudWatch Logs. Those categories are:
- Application logs: All applications logs stored under
“/var/log/containers/*.log"are streamed into the dedicated/aws/containerinsights/Cluster_Name/applicationlog group. All non-application logs such as kube-proxy and aws-node logs are excluded by default. However, additional Kubernetes add-on logs, such as CoreDNS logs, are also processed and streamed into this log group. - Host logs: system logs for each EKS worker node are streamed into the
/aws/containerinsights/Cluster_Name/hostlog group. These system logs include the contents of“/var/log/messages,/var/log/dmesg,/var/log/secure”files. Considering the stateless and dynamic nature of containerized workloads, where EKS worker nodes are often being terminated during scaling activities, streaming those logs in real time with Fluent Bit and having those logs available in CloudWatch logs, even after the node is terminated, are critical in terms of observability and monitoring health of EKS worker nodes. It also enables you to debug or troubleshoot cluster issues without logging into worker nodes in many cases and analyze these logs in more systematic way. - Data plane logs: EKS already provides control plane logs. With Fluent Bit integration in Container Insights, the logs generated by EKS data plane components, which run on every worker node and are responsible for maintaining running pods are captured as data plane logs. These logs are also streamed into a dedicated CloudWatch log group under
‘ /aws/containerinsights/Cluster_Name/dataplane. kube-proxy, aws-node, and Docker runtime logs are saved into this log group. In addition to control plane logs, having data plane logs stored in CloudWatch Logs helps to provide a complete picture of your EKS clusters.
The architecture below shows individual components used by CloudWatch Container Insights for EKS:

Supported Fluent Bit configurations: Optimized version vs FluentD compatible version
Container Insights supports two different configuration options for Fluent Bit: namely optimized version and FluentD compatible version to allow you to take full advantage of Fluent Bit’s flexibility and light-weight approach while maintaining the existing FluentD experience in terms of log structure in CloudWatch Logs. At a high level, the “optimized version” focuses on having a high log delivery throughput (logs delivered per second) in a resource efficient way, whereas FluentD’s compatible version focuses on providing a smooth migration experience from FluentD with minimal changes.
Moreover, both configuration options come with the following Fluent Bit best practices by default:
- Using the latest official AWS for Fluent Bit container image.
- Defining 200 Mi for the memory limit with 100 Mi request/500m for CPU. The configuration should flow:
resources:
  limits:
    memory: 200Mi
  requests:
    cpu: 500m
memory: 100Mi- Defining Multiple Input streams based on smart logical grouping and assigning different tags as per application/logical group. For example, the Fluent Bit configurations for Container Insights have dedicated input streams for application logs and data plane logs like /var/log/messages on the worker nodes. It also uses different tags for each input stream i.e. “application” tag for application logs, “dataplane” tag for data plane logs. This approach makes log redirection and log processing more flexible.
- Enabling the built-in HTTP server that can be used to query internal information and monitor metrics of each running plugin (including Prometheus metrics).
- Using the Kubernetes Filter: This filter allows enriching the log entries with Kubernetes metadata, which improves log context.
- While using this filter, it is important to turn on “Merge_Log” feature and define the “Merge_Log_Key” as “log_processed” to aggregate multiple log entries as a single JSON object whenever possible.
- Important performance considerations:
- This plugin queries the API endpoint to get pod metadata information and can generate extra workload on the API endpoint.
- With this filter, by default, the pod labels and annotations are appended to the log record as the context. These labels and annotations are turned off in Container Insights to improve log streaming performance.
- Enabling the AWS Metadata Filter: This filter plugin adds the EC2 instance ID and availability zone to log records, which assists in easily identifying the associated worker node.
- Increasing Mem_Buf_Limit to 50 MB only for application logs
‘/var/log/containers/*.log’excluding other non-application pods. - Enabling Filesystem Buffering: This is important to ensure integrity of business critical logs. Using default behavior of Mem_Buf_Limit, if a plugin has enqueued more data than
mem_buf_limitallows, it is unable to ingest more data until it is flushed properly, or until the data is correctly delivered and the queue is cleared. If a file gets rotated while paused, you might lose data since Fluent Bit won’t be able to register new records. This can happen with any input source plugin. Therefore, it is recommended to usemem_buf_limitand file system buffering together. With this approach, when Fluent Bit reaches themem_buf_limitthreshold, instead of the plugin being paused, all new data will be buffered into the file-system rather than memory. This allows the service to control memory usage and prevent any data loss. Moreover, using file system buffering will provide a significant performance gain in terms of memory utilization. More details can be found here.
While deciding the right Fluent Bit configuration option to use for your EKS cluster with Container Insights, it is important to review the considerations for each configuration option:
FluentD compatible version considerations:
- It enables Fluent Bit to publish logs to the same log streams for which FluentD is configured to publish logs.
- The
docker_idin Kubernetes metadata has been reformatted to the FluentD styleDocker.container_id. - Compared to FluentD, it is able to process/deliver a higher number of logs by only using ~1/6 of the memory and 1/2 of the CPU consumed by FluentD. For example: while delivering 5000 logs entries/per second, the FluentD Compatible Version of Fluent Bit only consumes ~55 MB of memory and ~0.48 vCPU whereas FluentD consumes ~320 MB of memory and ~0.85 vCPU for a similar workload. See Performance Comparison below for more details.
- To provide the same exact experience and configuration as FluentD in production, this configuration version uses additional Fluent Bit filters and the Golang Fluent Bit plugin:
CloudWatch. Although this provides considerable performance gains compared to FluentD, using additional filters and the Golang Fluent Bit plugin, rather than the new high performance CloudWatch plugin, will require additional cpu and memory resources. See Performance Comparison below for more details. - This configuration option is generally recommended when you are migrating from an existing FluentD environment and have dependencies on FluentD in regards to the logging structure or attributes in CloudWatch logs.
- It is important to review and understand the “Differences if you’re already using Fluentd” section before migrating from FluentD to Fluent Bit.
- To use the FluentD Compatible version, while configuring, you just need to select the YAML file provided as the FluentD compatible version. You can find configuration details under the setting up Fluent Bit section.
Optimized version considerations:
- It mostly focuses on optimizing Fluent Bit to process/stream logs at large scale in a resource efficient way and provides a native Fluent Bit experience.
- It requires fewer Fluent Bit filters and makes use of the new high performance CloudWatch plugin called
cloudwatch_logs. - Compared to the FluentD compatible version of the Fluent Bit configuration, the optimized version provides better performance: ~20% less memory utilization and ~35% less CPU utilization. For example, while delivering 5000 logs entries/per second, the optimized version only consumes ~45 MB of memory and ~0.30 vCPU whereas the FluentD compatible version consumes ~55 MB of memory and ~0.48 vCPU for a similar workload. See Performance for more details.
- For a similar amount of log volumes, compared to FluentD compatible version, the optimized version consumes less network bandwidth and it may reduce the required network throughput by up to 30%.
- Unless you have specific requirements or dependencies related to FluentD, we highly recommend the use of the optimized configuration set up for general purposes by default. However, as each implementation has its own requirements, it is up to you to decide which configuration version is a better fit for your architecture.
- To use the optimized version, while configuring, you just need to select the YAML file provided for the optimized version. You can find configuration details under the setting up Fluent Bit section.
Performance Comparison: FluentD vs Fluent Bit Setups
The following table shows the the performance differences between Fluent-Bit and FluentD in terms of cluster resources such as memory and CPU usage. It is important to note that following numbers are just for reference purposes and might change depending on the environment.
| Logs/s | FluentD CPU Usage | FB – CPU Usage (FluentD compatible) | FB – CPU Usage (Optimized Version) | FluentD Memory Usage | FB – Memory Usage (FluentD Compatible) | FB – Memory Usage (Optimized Version) |
| 100 | 0.35 vCPU | 0.02 vCPU | 0.02 vCPU | 153 MB | 46 MB | 37 MB |
| 1,000 | 0.32 vCPU | 0.14 vCPU | 0.11 vCPU | 270 MB | 45 MB | 40 MB |
| 5,000 | 0.85 vCPU | 0.48 vCPU | 0.30 vCPU | 320 MB | 55 MB | 45 MB |
| 10,000 | 0.94 vCPU | 0.60 vCPU | 0.39 vCPU | 375 MB | 92 MB | 75 MB |
In summary, FluentD uses ~2x CPU compared to the FluentD compatible Fluent Bit configuration and ~3x CPU compared to the optimized version. The FluentD compatible Fluent Bit configuration uses around ~1.5x CPU compared to the optimized version.
In terms of memory, FluentD uses ~6x more memory compared to the FluentD compatible Fluent Bit configuration and ~7x more memory compared to the optimized version. The FluentD compatible Fluent Bit configuration uses around ~1.3x more memory compared to the optimized version.
Key considerations for migrating from FluentD to Fluent Bit
Although, we provide a FluentD-like configuration for Fluent Bit in Container Insights, before migrating from FluentD to Fluent Bit, we highly encourage you review and understand the major discrepancies mentioned under the “Differences if you’re already using Fluentd” section. Also, be aware that logs will be duplicated for short period of time during the migration. With our recommended Fluent Bit configurations, Fluent Bit reads logs from tail. In order to avoid any missing logs, you can install Fluent Bit first before removing FluentD, by following steps:
- Install Fluent Bit and verify that it works. Refer to Set Up Fluent Bit as a DaemonSet to Send Logs to CloudWatch Logs for more details
- Delete FluentD. This can can be achieved using the following commands
curl https://raw.githubusercontent.com/aws-samples/amazon-cloudwatch-container-insights/latest/k8s-deployment-manifest-templates/deployment-mode/daemonset/container-insights-monitoring/fluentd/fluentd.yaml | kubectl delete -f -
kubectl delete configmap cluster-info -n amazon-cloudwatch
As you can imagine, during the small period of time when both Fluent Bit and FluentD run in parallel in your cluster, slight log duplication will occur in the Container Insights reserved log group.
Fluent Bit Monitoring and Log analysis
CloudWatch Dashboard for Fluent Bit
Another major improvement introduced with Fluent Bit integration in Container Insights is the support for a new CloudWatch dashboard to monitor health and performance of your logging components, specifically Fluent Bit.
Monitoring the health of the logging architecture, which is the key component to get visibility and log data out of your business critical application, is one of the areas that is often overlooked and underestimated. However, any performance degradation or streaming interruption within your log processor may result in total loss of business critical logs or inconsistent/missing logs. Such risks may directly impact availability of your application running on Kubernetes in a negative way or make your application non-compliant in terms of regulations or business requirements. Therefore, Container Insights now provides an optional CloudWatch dashboard for Fluent Bit, which monitors the health and throughput performance in real time and create optional CloudWatch alarms.
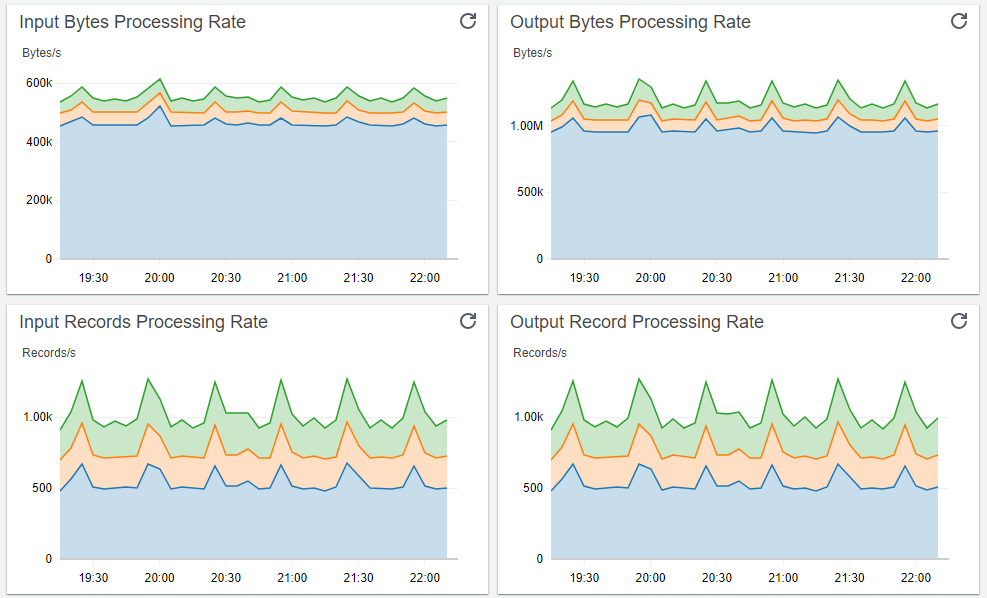
Fluent Bit comes with a built-in HTTP server that can be used to query internal information and more importantly to expose Prometheus style metrics via ‘/api/v1/metrics/prometheus’ for each running plugin and Kubernetes worker node. Using those exposed metrics by Fluent Bit and with the help of CloudWatch Agent, which runs on every EKS worker node as deamonset, Container Insights publishes the following custom metrics to CloudWatch:
- Input Bytes Processing Rate
- Input Records Processing Rate
- Output Retry/Failed Rates
- Output Bytes Processing Rate
- Output Record Processing Rate
- Output Error Rate
Using those exposed metrics, you can create a dashboard that will allow you to monitor metrics of each running plugin. This will enable you to see data regarding input and output bytes and records processing rates, as well as any output error and retry/failed rates. Here are the detailed steps to create the CloudWatch dashboard for Fluent Bit and view those metrics for your EKS clusters:
1. Install the CloudWatch agent with Prometheus metrics collection for Amazon EKS cluster.
2. Create environment variables, replacing the values below to match your deployment.
DASHBOARD_NAME=your_cw_dashboard_name
REGION_NAME=your_metric_region_such_as_us-west-1
CLUSTER_NAME=your_kubernetes_cluster_name
3. Enter the following command to create the dashboard.
curl https://raw.githubusercontent.com/aws-samples/amazon-cloudwatch-container-insights/latest/k8s-deployment-manifest-templates/deployment-mode/service/cwagent-prometheus/sample_cloudwatch_dashboards/fluent-bit/cw_dashboard_fluent_bit.json \
| sed "s/{{YOUR_AWS_REGION}}/${REGION_NAME}/g" \
| sed "s/{{YOUR_CLUSTER_NAME}}/${CLUSTER_NAME}/g" \
| xargs -0 aws cloudwatch put-dashboard --dashboard-name ${DASHBOARD_NAME} --dashboard-body
4. Open the CloudWatch dashboard at https://console.aws.amazon.com/cloudwatch/home#dashboards.
5. You should expect to see following CloudWatch dashboard with the specified name:
Log Analysis and Filtering using CloudWatch Log Insights
The ability of Container Insights to forward the logs from multiple input streams at large scale using Fluent Bit and group them logically makes it possible to achieve a unified logging and analysis experience for your EKS clusters on AWS. For example, with Amazon CloudWatch logs insights, you can interactively search and analyze all the logs generated by your EKS clusters including application logs, and look for the data points, patterns, and trends. Using Container Insights along with Log Insights will provide insights you need to understand how your applications and AWS resources are behaving with no additional set up or maintenance requirement on your side. It also provides you fast and interactive tools to analyze and visual them in near real time. Log Insights can also handle any log format, and it auto-discovers fields from JSON logs. Together, Container Insights and Logs Insights provide you with a powerful platform to address your operational needs/issues and identify areas for improvement within your EKS clusters.
Here are several Log Insights Query examples that can provide information about your EKS clusters using Container Insights:
Application log errors by container name:
Log Group: /aws/containerinsights/<CLUSTER_NAME>/**application

stats count() as error_count by kubernetes.container_name
| filter stream="stderr"
| sort error_count desc
All Kubelet errors/warning logs for for a given EKS worker node
Log Group: /aws/containerinsights/<CLUSTER_NAME>/dataplane

fields @timestamp, @message, ec2_instance_id
| filter  message =~ /.*(E|W)[0-9]{4}.*/ and ec2_instance_id="i-1234567abcde"
| sort @timestamp desc
Kubelet errors/warning count per EKS worker node in the cluster
Log Group: /aws/containerinsights/<CLUSTER_NAME>/dataplane
fields @timestamp, @message, ec2_instance_id
| filter   message =~ /.*(E|W)[0-9]{4}.*/
| stats count(*) as error_count by ec2_instance_id
Getting Docker errors per EKS worker node
Log Group: /aws/containerinsights/<CLUSTER_NAME>/dataplane

fields @timestamp, @message, ec2_instance_id
| filter  message like 'level=error' or message like 'level=warning'
| stats count(*) as error_count by ec2_instance_id
Getting average number of streamed logs per log source (application vs data plane etc.) per EKS Worker Node using Fluent Bit Metrics
Log  Group:  /aws/containerinsights/<CLUSTER_NAME>/prometheus

fields @timestamp, @message
| filter k8s_app like /fluent-bit/
| filter name like /cloudwatch_logs/
| stats ceil(avg(fluentbit_output_proc_records_total)) as OutPutRecordCount, ceil(avg(fluentbit_output_errors_total)) as OutputErrorCount by name as Source,NodeName
Conclusion
The integration of Fluent Bit with Container Insights enables you to deliver application logs seamlessly at large scale in a resource-efficient way due to the much lower resource footprint of Fluent Bit. Container Insights also provides different configuration options to help you to migrate your existing logging architecture from FluentD with minimal change to your existing Container Insights experience. Having a built-in dashboard for Fluent Bit and being able to analyze not only application but also data plane logs using Amazon CloudWatch Logs Insights considerably enhances your observability and debugging capabilities without any additional operational overhead. For more information about Container Insights, Fluent Bit Setup, and Observability, please visit Setting Up Container Insights on Amazon EKS and Kubernetes and the AWS Observability Workshop.

Dejun Hu
Dejun Hu is a Sr. Software Engineer at AWS CloudWatch. He is the major contributors to the CloudWatch ContainerInsights project. Dejun has more than a decade experience in Monitoring and Telecom industries and has delivered lots of successful products. He’s also interested in hiking and playing soccer.

TP Kohli
TP Kohli is a Senior Product Manager focused on monitoring containers and microservices for modern application environments. He is focused on delivering the best observability solution for customers using time series data sources such as metrics, logs, events, and distributed tracing using CloudWatch and open source toolkits. TP loves solving customer use cases, earn trust with customers, and deliver the best user experience that help customers reduce their MTTR and achieve their observability goals.