AWS Database Blog
Babelfish for Aurora PostgreSQL performance tuning
Migrating from legacy SQL Server databases is traditionally time-consuming and resource-intensive, but Babelfish for Aurora PostgreSQL streamlines this journey. Babelfish natively implements T-SQL syntax, semantics, and connectivity using PostgreSQL building blocks, so applications originally written for SQL Server can work with Amazon Aurora with minimal code changes. This compatibility reduces the effort required to move applications running on SQL Server 2005 or newer to Aurora, accelerating migration timelines while lowering both risk and cost. Organizations gain the dual advantage of preserving their existing application investments while unlocking Aurora’s benefits, including automated scaling, high availability, and the cost savings of open-source PostgreSQL, without the burden of extensive application rewrites.
When migrating to Babelfish, you might see queries running faster or slower compared to SQL Server. This performance variation is a natural characteristic of moving between fundamentally different database engines, each with its own query optimizer, execution strategies, and architectural design decisions. Performance tuning helps uncover bottlenecks, optimize queries, and make sure that the database can handle high-traffic applications.
In this post, we show you how to tune Babelfish performance through monitoring, query optimization, parameter tuning, and ongoing maintenance.
Solution overview
Database performance tuning is an iterative process rather than a single, one-off task. The continuous cycle is necessary because database usage patterns, data volume, hardware, and application requirements constantly evolve. The following is one of the possible approaches for the Babelfish for Aurora PostgreSQL performance tuning.
The recommended approach follows these numbered steps so that the reader understands how to progress:
- Monitor – Identify bottlenecks.
- Configure – Implement tuning strategies.
- Code changes – Optimize queries.
- Instance tuning – Aurora parameter tuning.
- Analyze – Analyze performance.
Monitoring
The first step is to identify bottlenecks and monitor issues in the database. This can be achieved through extensive monitoring of the instance and database queries.
For troubleshooting Babelfish for Aurora PostgreSQL issues, you should use:
- Amazon CloudWatch for general, high-level metrics and alerting.
- Enhanced Monitoring for granular, OS-level details.
- Database Insights (which incorporates Performance Insights features) for deep, SQL-level performance analysis.
- Monitor connection pooling.
Amazon CloudWatch
Amazon CloudWatch provides a high-level view of your Aurora cluster’s health by collecting key performance metrics from the hypervisor. Use it as your first line of monitoring to spot trends and set proactive alerts.
- CloudWatch gathers metrics about CPU utilization from the hypervisor for a DB instance. Metrics are captured both at the cluster and instance level, as is standard with Aurora.
- Approximately 20 metrics are tracked, including CPU utilization, DB connections, and write IOPS.
- For a table of these metrics, see Amazon CloudWatch metrics for Amazon Aurora.
- CloudWatch metrics alone can’t pinpoint specific bottlenecks within your workload or identify individual queries contributing to high CPU utilization. To gain deeper visibility into query-level performance, complement CloudWatch monitoring with Database Insights. Database Insights provides detailed wait event analysis, top SQL identification, and database load breakdowns. These help isolate problematic queries and reveal their resource consumption patterns.
- You can set up CloudWatch alarms to proactively monitor your Amazon Aurora instance. For guidance, see Setting up Amazon CloudWatch alarms.
Enhanced Monitoring
Enhanced Monitoring provides OS-level visibility by running an agent directly on the database instance, giving you more granular insight than CloudWatch alone.
- Enhanced Monitoring gathers its metrics from an agent on the instance.
- Enhanced Monitoring metrics are useful when you want to see how different processes or threads on a DB instance use the CPU.
- Enhanced Monitoring metrics are collected at an interval defined by the user (1 second to 5 minutes) and can be more granular than CloudWatch.
- For a table of these metrics, see OS metrics in Enhanced Monitoring.
Database Insights
Database Insights is a newer feature that serves as a replacement for Performance Insights, offering deeper and more comprehensive database observability. It has two modes: Standard mode (the default) and Advanced mode, which can be turned on for more detailed analysis.
- With Database Insights, you can monitor your database fleet with pre-built, opinionated dashboards. The dashboards display curated metrics and visualizations that help identify poorly performing queries in your database fleet.
- Analyze the top contributors to DB Load by wait event, SQL, host, or user dimensions. For details, see the Database Insights dashboard documentation.
- Analyze operating system processes running in your databases with detailed metrics per process (Advanced mode only).
- Analyze slow SQL queries (Advanced mode only).
For more details, see the Database Insights user guide.
Connection pooling
PostgreSQL, and therefore Babelfish, uses a process-based model where each client connection spawns a separate operating system process. This contrasts with SQL Server’s thread-based architecture (each connection may introduce additional memory and system resource usage). This might introduce overhead in CPU utilization, memory consumption, and connection handling capacity. When connection counts approach instance limits or high connection churn occurs, performance issues can become pronounced.
You can detect connection churn issues by:
- Enabling the
log_connectionsandlog_disconnectionsparameters in your Aurora PostgreSQL cluster or instance parameter group. For more information on query logging configuration, see PostgreSQL query logging. - Using Database Insights to monitor authentication attempts and backend connections.
- Tracking the
total_auth_attemptsmetric, which should stay close to zero. High numbers indicate massive failed login attempts, which drain database compute resources and expose your system to credential-stuffing attacks.
The primary recommendation is implementing connection pooling to manage connection churn:
- Amazon RDS Proxy: Babelfish support RDS Proxy, which provides a cache of ready-to-use connections for clients.
- PgBouncer: For versions that don’t support RDS Proxy, PgBouncer offers PostgreSQL-compatible connection pooling.
After you’ve identified bottlenecks through monitoring, the next step is configuring Babelfish-specific settings to address them.
Configure Babelfish-specific performance settings
To optimize the performance of Babelfish within an Amazon Aurora PostgreSQL-Compatible cluster, you can adjust several configuration parameters specific to how SQL Server workloads behave. For a full list of Babelfish configuration parameters, see the Babelfish configuration documentation.
Prerequisites
Before diving into query optimization with hints, make sure the following prerequisites are configured.
Enable T-SQL query hints
Starting with version 2.3.0, Babelfish supports the use of query hints using pg_hint_plan. To enable T-SQL query hints in Babelfish, run the stored procedure sp_babelfish_configure to turn on the enable_pg_hint parameter:
For more details, see Babelfish T-SQL hints.
Configure explain plan settings
To configure explain plan settings in Babelfish, you modify specific configuration parameters through SQL commands, which use the underlying PostgreSQL auto_explain functionality.
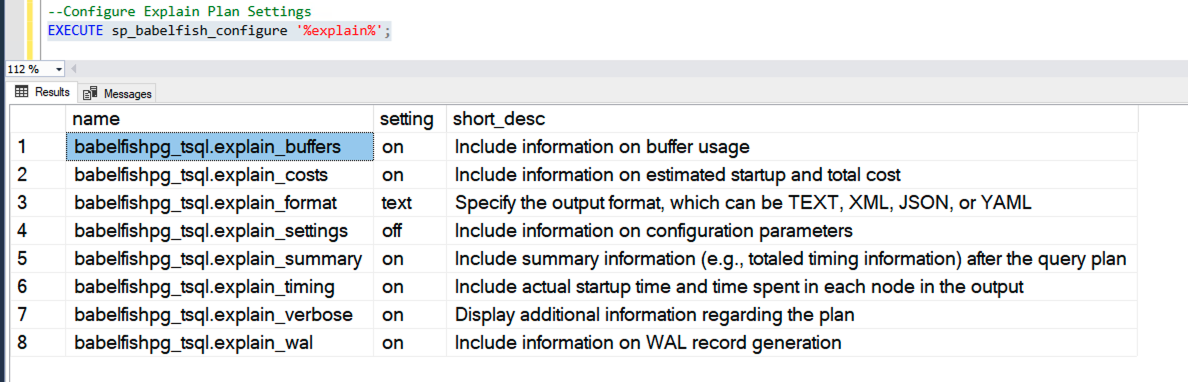
Check current Babelfish explain parameters:
This returns a result set similar to the following:
Configure explain plan parameters for better performance analysis:
Babelfish explain plan functions
Like SQL Server, Babelfish supports both estimated and actual explain plans. For reference on SQL Server’s estimated and actual execution plans, see the SQL Server documentation.
- The estimated execution plan predicts the query strategy before running (good for quick checks).
- The actual execution plan shows what happened after execution, including runtime statistics.
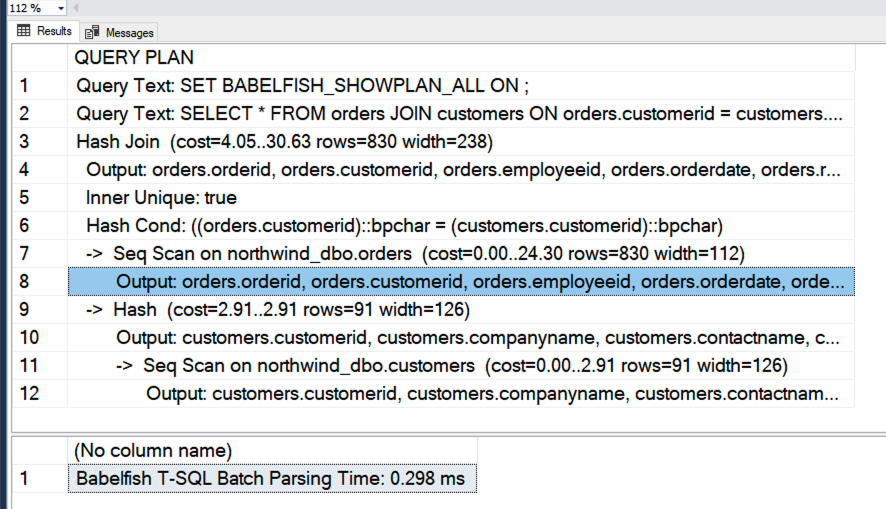
Example: Enable BABELFISH_SHOWPLAN_ALL and run a query to see the estimated execution plan:
When you enable BABELFISH_SHOWPLAN_ALL, Babelfish returns the PostgreSQL query execution plan instead of running the query. You will see the join strategy chosen by the optimizer (such as Hash Join or Nested Loop), estimated row counts, cost estimates, and output columns for each node. This helps you understand how the optimizer is processing your query before committing to execution.
Query optimization using hints
The query optimizer is designed to identify efficient execution plans for SQL statements. When selecting a plan, the query optimizer considers both the engine’s cost model and column and table statistics. However, the suggested plan might not meet the needs of your datasets. Query hints address performance issues to improve execution plans.
After enable_pg_hint is ON, Babelfish recognizes the following T-SQL hints included in your queries:
INDEX hints
INDEX hints force the optimizer to use a specific index. For more details, see the Babelfish T-SQL hints documentation.
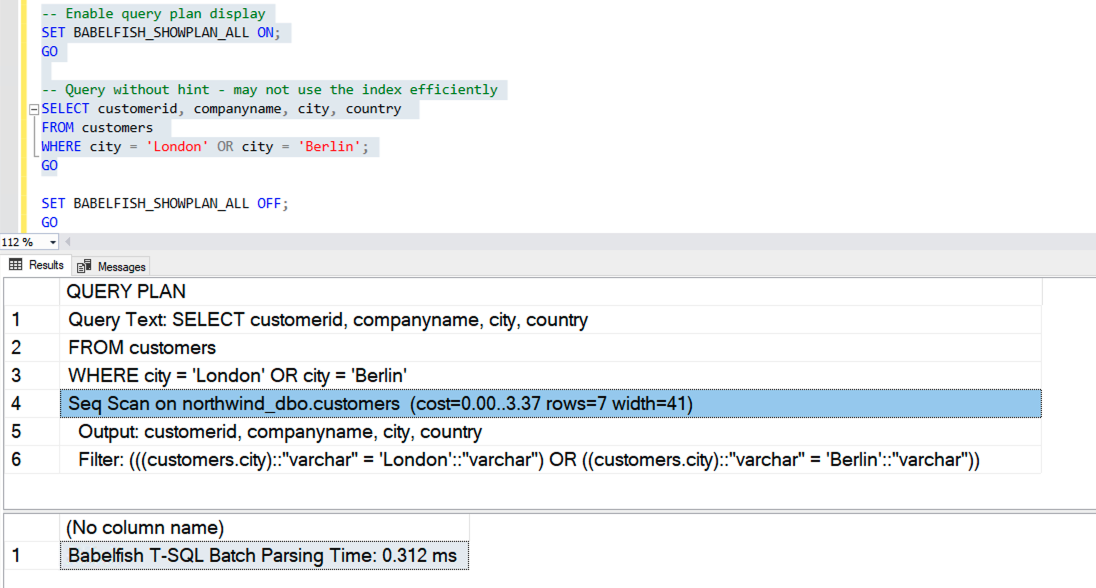
Step 1: Query without index hint
Without the hint, the optimizer chooses a sequential scan because the table is small:
Step 2: Create an index on a specific column
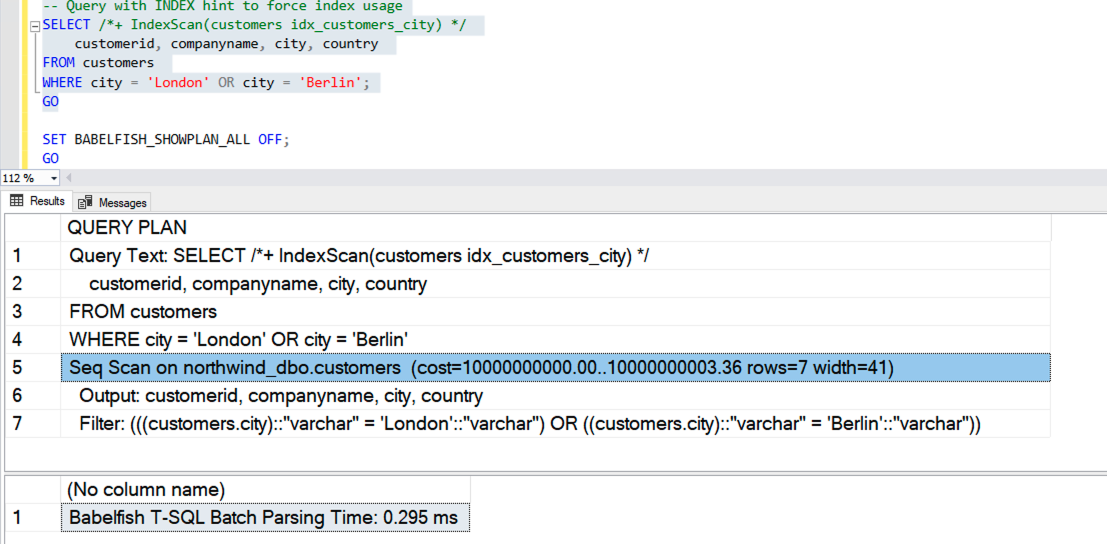
Step 3: Force optimizer to use the index hint
BABELFISH_SHOWPLAN_ALL shows the execution plan that PostgreSQL (which underlies Babelfish) would generate. The actual behavior depends on several factors, including index statistics, data distribution, and table size. For smaller tables, the optimizer is much more likely to choose a sequential scan. In the following screenshot, the cost of the sequential scan is artificially inflated when the hint is applied (cost=10000000000.00), indicating the hint was recognized but the optimizer still determined the seq scan was the only viable option given the small data size. With a larger dataset, the performance benefits of index hints become more apparent.
JOIN hints
JOIN hints allow you to influence the query optimizer’s choice of join algorithm. The optimizer can select from several join methods.
- Hash joins – Create an in-memory hash table from one table’s join key to quickly probe matching records.
- Merge joins – Combine pre-sorted datasets.
- Nested loop joins – Iterate through one table while searching the other.
MAXDOP hint
The MAXDOP hint controls how many CPUs a single query can use for parallel execution.
FORCE ORDER hint
The FORCE ORDER hint preserves the join order specified in the T-SQL query, overriding the PostgreSQL query optimizer’s default behavior.
Note: There are some limitations of hints in Babelfish. Refer to the limitations of Babelfish T-SQL hints.
User defined function optimization
Function volatility classifications help the query optimizer make better decisions about when and how often to run functions. To optimize function performance in Babelfish, you must explicitly label functions with the strictest possible volatility classification: IMMUTABLE, STABLE, or VOLATILE. The optimizer uses this classification to determine if it can cache the function’s result, potentially eliminating redundant calls and significantly boosting query performance.
For more information on PostgreSQL function volatility, see the PostgreSQL documentation on function volatility and Volatility classification in PostgreSQL.
- IMMUTABLE – The function always returns the same result when given the same input arguments, regardless of any other factors.
- STABLE – The function cannot modify the database state and is guaranteed to return the same result for the same arguments within a single statement. The result may change between different statements.
- VOLATILE (Default) – The function can modify the database state and can return different results on consecutive calls, even with the same arguments.
Example: In Babelfish, volatility classification is a post-creation step using the sp_babelfish_volatility stored procedure. The following three examples demonstrate how to create functions and assign each volatility type. See the sp_babelfish_volatility documentation for full reference.
Example 1: IMMUTABLE function — calculate_tax always returns the same result for the same input, so it can be safely marked IMMUTABLE:
Example 2: STABLE function — get_current_quarter returns a consistent result within a single statement but may differ between statements:
Example 3: VOLATILE function — generate_random_discount uses RAND() and can return different results on every call:
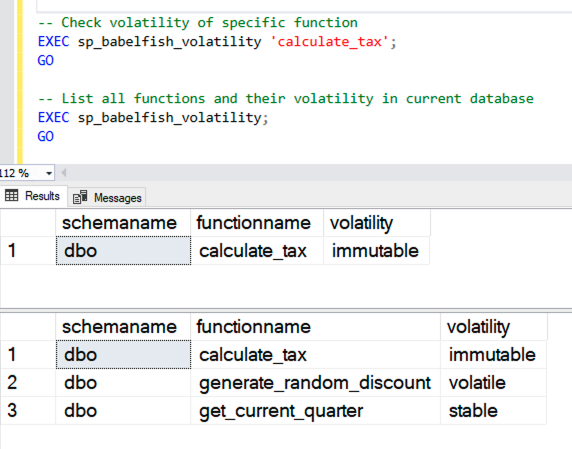
Checking and listing volatility:
The output will look similar to the following:
Using the optimized IMMUTABLE function: By marking calculate_tax as IMMUTABLE, the optimizer can cache the result for each unique input value, avoiding redundant function calls for rows with the same total_spent value:
Optimize Aurora PostgreSQL parameters
Properly tuning Babelfish parameters optimizes query execution plans, reduces memory bottlenecks, and uses PostgreSQL’s cost-based optimizer to improve query performance. Strategic configuration of memory allocation, parallelism settings, and storage cost parameters helps queries run faster through efficient resource utilization and optimal index selection.
Unlike SQL Server, which manages server-level settings through its native sp_configure system stored procedure, Babelfish operates on a PostgreSQL engine and relies on the underlying configuration framework of PostgreSQL. The following sections list key parameters to tune, organized by category.
Parallelism
Both platforms benefit from parallelism tuning, but Babelfish provides more granular control through PostgreSQL’s cost-based parameters.
| Category | SQL Server parameter | Babelfish/PostgreSQL equivalent |
| Max Parallel Processors | max degree of parallelism (MAXDOP) | max_parallel_workers_per_gather |
| Parallelism Threshold | cost threshold for parallelism | parallel_setup_cost |
max_parallel_workers_per_gather limits the maximum number of worker processes a single query can spawn to run tasks in parallel. It divides large operations (like table scans or joins) across multiple CPU cores to speed them up.
parallel_setup_cost is a query planner parameter that estimates the time required to launch background worker processes for parallel query execution.
Here’s how parallelism is configured in each environment. Note that Aurora PostgreSQL Parameter Group settings replace the need for sp_configure entirely.
SQL Server: Configure parallelism for 8-core system
Babelfish: Apply the following settings in your Aurora PostgreSQL parameter group (cluster parameter group):
Connection model
SQL Server uses thread-based connections, while Babelfish/PostgreSQL uses process-based connections. The following are equivalent parameters:
| Category | SQL Server parameter | Babelfish/PostgreSQL equivalent |
| Max Connections | user connections | max_connections |
| Connection Timeout | remote query timeout | statement_timeout |
Storage and maintenance parameters
Storage and maintenance parameters in Babelfish differ fundamentally from SQL Server’s approach. PostgreSQL’s MVCC architecture requires regular autovacuum operations to reclaim space from updated and deleted rows, while SQL Server performs in-place updates with clustered indexes.
| Category | SQL Server parameter | Babelfish/PostgreSQL equivalent |
| Auto Update Statistics | auto update statistics | autovacuum |
| Statistics Threshold | auto update statistics threshold | autovacuum_analyze_threshold |
| Checkpoint Frequency | recovery interval | checkpoint_timeout |
Memory management parameters
SQL Server manages memory with minimum and maximum server memory settings. Aurora PostgreSQL takes a more granular approach. The following table shows how memory parameters map between the two environments:
| Category | SQL Server parameter | Babelfish/PostgreSQL equivalent |
| Buffer Pool Memory | max server memory (mb) | shared_buffers |
| Minimum Memory | min server memory (mb) | No direct equivalent |
| Sort/Hash Memory | No direct equivalent | work_mem |
| Maintenance Memory | No direct equivalent | maintenance_work_mem |
Key memory parameters:
work_mem– Specifies the amount of memory that the Aurora PostgreSQL DB cluster uses for internal sort operations and hash tables before writing to temporary disk files.work_memis a static parameter. Changes require a reboot of the writer instance of your Aurora PostgreSQL cluster to take effect.shared_buffers– Acts as a central cache for data and index pages that are read from or written to the database.shared_buffersis a static parameter. Changes require a reboot of the database instance to take effect.max_connections– Determines the maximum number of concurrent client connections allowed to the database instance in Amazon Aurora PostgreSQL-Compatible Edition.
Memory configuration examples
The following examples show how memory is configured in SQL Server and its equivalent in Babelfish on Aurora PostgreSQL.
SQL Server:
Babelfish (Aurora PostgreSQL Parameter Group settings for 32GB instance):
Key takeaways from this comparison:
- SQL Server’s single
max server memorysetting maps to multiple PostgreSQL parameters that give you finer-grained control over how memory is allocated across different operations. shared_buffersis the closest equivalent to SQL Server’s buffer pool. Set it to approximately 25 percent of instance RAM as a starting point, and refer to the PostgreSQL documentation for more details.work_memcontrols per-operation sort/hash memory and has no direct SQL Server equivalent (SQL Server manages this internally within its memory grant system). Start conservative (64 MB) and increase only if you observe frequent disk-based sorts in your query plans.effective_cache_sizeis not an allocation. It’s a hint that tells the query planner how much memory is available for OS-level caching, influencing whether it chooses index scans over sequential scans.
Babelfish-specific parameters
Babelfish introduces unique parameters that support T-SQL compatibility and performance monitoring within the PostgreSQL environment, bridging the gap between SQL Server familiarity and Aurora’s architecture. For a full list, see the Babelfish configuration documentation.
| Parameter | Purpose | Tuning recommendation |
| babelfishpg_tsql.version | SQL Server version emulation | Set to match source SQL Server version |
| BABELFISH_SHOWPLAN_ALL | Query execution plans | Enable for performance troubleshooting |
| BABELFISH_STATISTICS_PROFILE | Actual execution statistics | Enable for detailed performance analysis |
Ongoing database maintenance
Most ongoing database maintenance tasks are automatically handled as part of the managed AWS service, in line with the AWS shared responsibility model. Users benefit from this abstraction, allowing them to focus on innovation rather than routine database administration. Running VACUUM and ANALYZE should be among the very first actions taken when investigating performance issues, before looking further into query or parameter tuning.
Storage and maintenance in Babelfish differ fundamentally from SQL Server’s UPDATE STATISTICS approach. PostgreSQL requires explicit ANALYZE commands to update statistics, the direct equivalent of SQL Server’s UPDATE STATISTICS. VACUUM specifically reclaims space from dead tuples created by PostgreSQL’s MVCC architecture, a maintenance task unnecessary in SQL Server’s in-place update model. Tuning autovacuum_analyze_scale_factor controls when statistics are automatically refreshed, while autovacuum_vacuum_scale_factor and autovacuum_max_workers manage the space reclamation process unique to PostgreSQL’s storage engine. This helps maintain both accurate query plans and efficient storage utilization in high-update environments.
VACUUM is an important database maintenance command. For full reference, see the PostgreSQL VACUUM documentation.
Key functions of VACUUM:
- Reclaims storage from deleted or updated rows (dead tuples).
- Updates statistics for the query planner.
- Maintains visibility maps for faster index scans.
- Prevents transaction ID wraparound, protecting against data corruption.
Types of VACUUM:
- VACUUM (Standard/Lazy): Reclaims space and can run concurrently with reads/writes. Space is reused internally but not returned to the OS.
- VACUUM FULL: Rewrites the table, returning unused space to the OS, but requires an exclusive lock that blocks all access during execution. Use with caution in production environments.
- VACUUM ANALYZE: Performs VACUUM and updates statistics for the query planner in a single operation.
Regular maintenance through autovacuum and periodic manual VACUUM ANALYZE operations helps the query planner keep accurate statistics and keeps storage efficient as your data grows.
Conclusion
In this post, we walked through a systematic approach to Babelfish performance tuning, from identifying bottlenecks using wait statistics and query plan analysis, to tuning queries, adjusting configuration parameters, and performing manual maintenance. Performance tuning is not a one-time activity. As your data grows, query patterns evolve, and application demands shift, regular reassessment of your configuration and query plans becomes essential. By applying these techniques iteratively and continuously monitoring your workload, you can help your Babelfish on Aurora PostgreSQL deployment deliver optimal performance for your applications.
To get started with Babelfish for Aurora PostgreSQL or dive deeper into the topics covered here, visit the Babelfish for Aurora PostgreSQL documentation.