AWS Database Blog
Building agentic AI for Amazon RDS for SQL Server with Strands and AgentCore
If you manage Amazon Relational Database Service (Amazon RDS) for SQL Server instances, you’ve likely accumulated a collection of diagnostic scripts over the years. These scripts query for blocking sessions, identify slow-running procedures, monitor disk space, and analyze index usage. They represent expertise you’ve developed through years of troubleshooting database issues, often during critical late-night incidents. Your scripts can now form the foundation for AI agents that work continuously. Amazon Bedrock AgentCore Runtime with Strands Agents enables you to transform your existing T-SQL knowledge into an autonomous database management system. When you combine AI models with purpose-built AI agents, you create agents that understand context, make informed decisions, and execute complex operations autonomously.
In this post, we walk through building an agent that investigates blocking and deadlocks on Amazon RDS for SQL Server — two issues that directly impact application performance, cause transaction failures, and lead to user-facing timeouts. Using the Strands Agents framework, we convert the T-SQL queries DBAs already use for these investigations into agent tools, combine them into a single agent, and deploy it to AgentCore Runtime.
We start by explaining what agents and tools are, then walk through common DBA scenarios and how tools address them. From there, we build the tools, define the agent with a system prompt, and deploy it to AgentCore Runtime.
What are agents?
Agents are software systems that use AI to reason, plan, and complete tasks on behalf of humans or systems. In the context of database operations, an agent receives a question or an alarm payload, decides which tools to call, executes them, interprets the results, and responds with a diagnosis. For more on the Strands Agents framework, see Introducing Strands Agents: An Open Source AI Agents SDK.
At the core of every Strands agent is the agent loop: invoke the AI service, check if it wants to use a tool, execute the tool, then invoke the service again with the result. This cycle repeats until the model produces a final response.
Each iteration adds to the conversation history. The agent tracks not just the original request, but every tool it has called and every result it has received. This accumulated context enables multi-step reasoning. For example, the agent can check for deadlocks, then analyze blocking chains, then correlate both findings into a single diagnosis.
What are tools?
Now that we understand how agents reason, let’s look at the building blocks they use. In agentic AI systems, tools are functions that an agent can invoke to interact with external systems, retrieve data, or perform actions. Tools enable the agent’s capabilities beyond text generation: querying databases, calling APIs, monitoring systems, and sending notifications. They are the bridge between an agent’s reasoning capabilities and the real world.
In Strands, a tool is a Python function decorated with @tool. The function’s docstring tells the agent when and why to call it. The agent reads the docstring, matches it against the user’s question, and decides whether to invoke the function. This means that the existing diagnostic script that a DBA already uses can become a tool by wrapping it in a function with a @tool decorator and a descriptive docstring.
The @tool decorator registers the function with the agent. The type hints define the input and output schema. The docstring is what the agent uses to decide when to call it. Write it as you would a runbook entry.
Common DBA scenarios
With agents and tools defined, let’s look at the specific database problems we want to solve.
Deadlocks. When a deadlock occurs, you need to identify the sessions involved, the SQL statements each was executing, the lock types and objects in contention, and the victim session. On Amazon RDS for SQL Server, deadlock information is captured in two ways:
- Trace flags 1204 and 1222 — When enabled through a custom DB parameter group, these write deadlock details to the SQL Server error log, which can be published to Amazon CloudWatch Logs. See Monitor deadlocks in Amazon RDS for SQL Server for setup steps.
- The system_health extended event session — This built-in session captures deadlock graphs via the xml_deadlock_report event by default. Both sides of the deadlock, including SQL statements, lock types, and objects, are recorded in the XE file targets at D:\rdsdbdata\log.
Blocking. When applications report timeouts, you need to find the head blocker — the session at the root of the blocking chain — along with its SQL statement, the number of sessions waiting behind it, and how long they’ve been waiting. Capturing this information on RDS for SQL Server depends on what level of detail is needed:
- Current blocking — The DMVs sys.dm_exec_requests and sys.dm_exec_sql_text provide the current blocking state, including blocker and blocked session IDs, wait types, and SQL text. This data remains available without additional configuration.
- Historical blocking (blocked session only) — The system_health session captures lock waits exceeding 30 seconds via the wait_info event. This records the blocked session’s ID and SQL text, but not the blocker’s identity. CloudWatch Logs does not contain system_health data — it only receives the SQL Server error log.
- Historical blocking (both sides) — To capture both the blocker and blocked session after the fact, set blocked process threshold in your DB parameter group and create a custom extended event session for blocked_process_report. The system_health session does not capture this event. See Using extended events with Amazon RDS for Microsoft SQL Server for configuration details.
How tools address these scenarios
Now let’s map each scenario to a tool that the agent can call.
| Tool | What it does | Data source |
|---|---|---|
| get_deadlock_graphs | Reads deadlock graphs with full details for both sides | system_health Extended Event (XE) files (xml_deadlock_report) |
| get_blocking_chains | Walks the current blocking hierarchy, identifies head blockers and their SQL | DMVs (sys.dm_exec_requests, sys.dm_exec_sql_text) |
| get_session_details | Retrieves login, host, program, and SQL for a specific session | DMV (sys.dm_exec_sessions) |
| send_diagnostic_report | Sends the agent’s findings and recommendations to the DBA team | Amazon SNS |
| get_blocked_process_reports | Reads historical blocking details including both blocker and blocked sessions | Custom XE session (blocked_process_report) |
Tool code
Let’s see how these tools translate into Python code. Each tool wraps an existing SQL Server diagnostic query using the Strands @tool decorator.
The tools share a connection helper that retrieves credentials from AWS Secrets Manager:
Deadlock detection. Reads deadlock graphs from the system_health XE files:
Blocking chain analysis. Walks the blocking hierarchy using a recursive CTE:
Session details. Retrieves context for a specific session:
Diagnostic reporting. Sends findings via SNS:
Historical blocked process reports. Reads blocker and blocked session details from a custom XE session. Requires blocked process threshold set in the DB parameter group and a custom extended event session capturing blocked_process_report with a file target. See Using extended events with Amazon RDS for Microsoft SQL Server for session creation.
Note: All code examples use parameterized queries (%s placeholders) to help prevent SQL injection.
Defining the agent: System prompt and tools
With the tools built, we now define the agent itself. The system prompt defines how the agent reasons about problems, and the tools list tells it what capabilities are available.
Solution workflow
At the heart of this transformation lies the integration of three key technologies:
- Strands agents & tools — Wrap existing T-SQL expertise in intelligent agents that reason about database conditions and execute responses automatically.
- AgentCore Runtime — Deploy agents securely into your VPC with built-in scaling and observability.
- AgentCore Memory — Retain findings across sessions so agents learn from past investigations.
The following diagram illustrates the end-to-end workflow from operator prompt to diagnostic report.
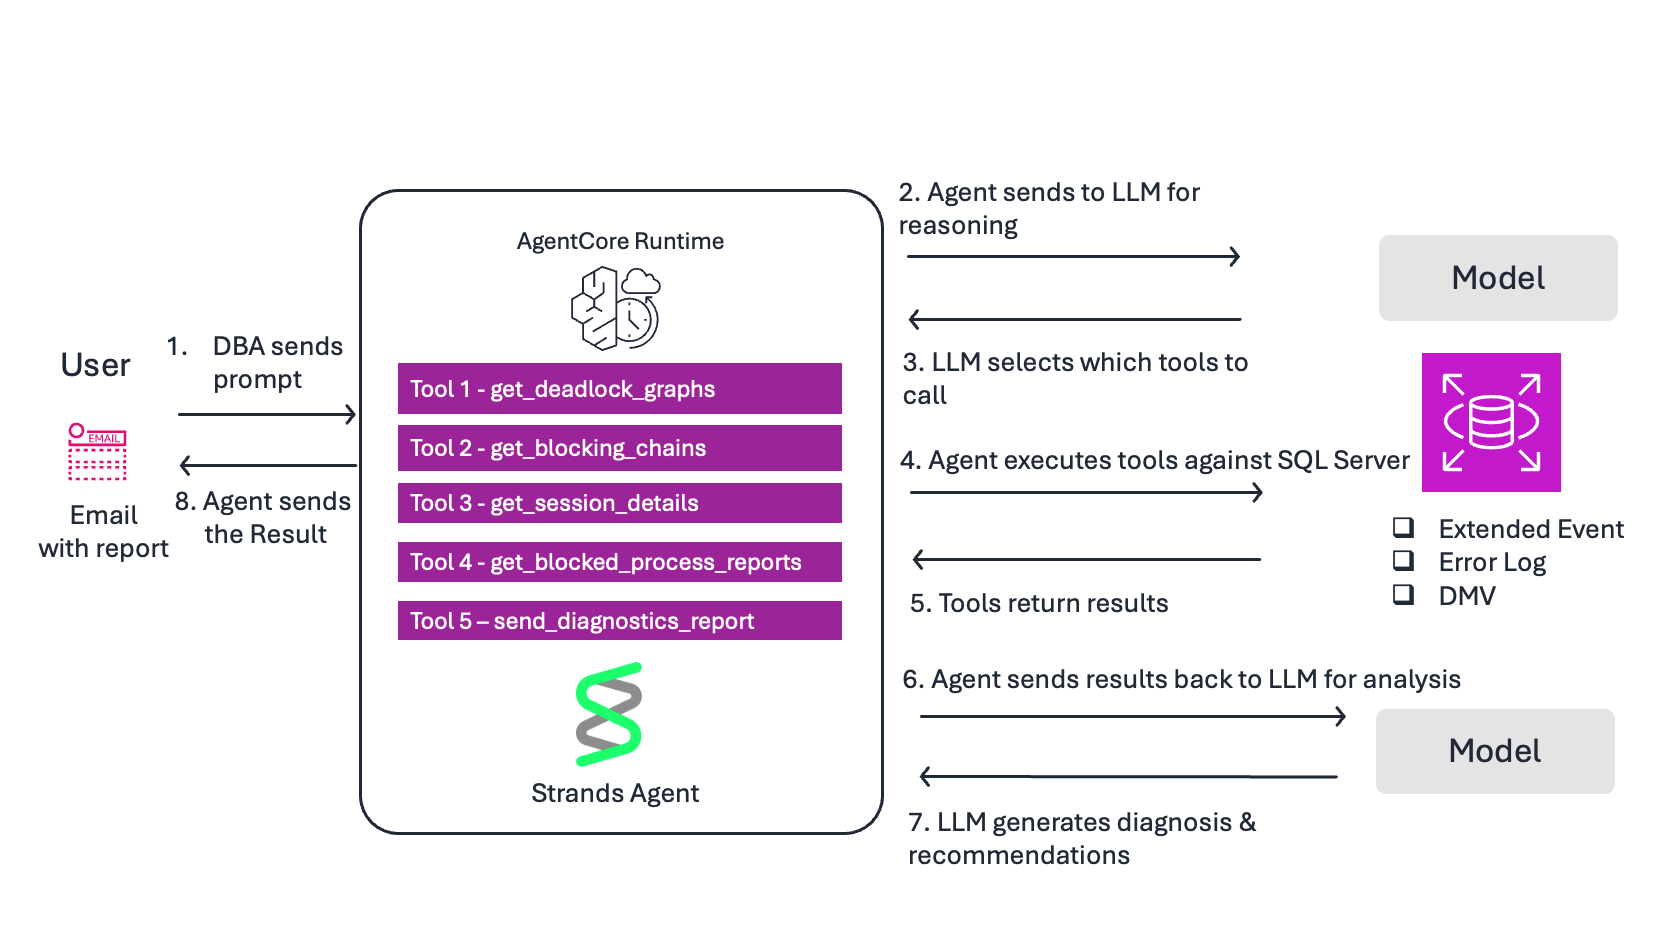
Flow:
- DBA sends prompt — “Check for deadlocks in the last 24 hours and send a diagnostic report via SNS”.
- Agent sends to LLM for reasoning — The model reads the prompt and the system prompt to understand the task.
- LLM selects tools — Based on the docstrings, it decides to call get_deadlock_graphs first.
- Agent executes tool — Queries system_health XE files on Amazon RDS for SQL Server for xml_deadlock_report events
- Tool returns results — Deadlock graphs with session IDs, SQL statements, lock types, and objects.
- Agent sends results to LLM for analysis — The model interprets the raw deadlock XML and identifies root cause.
- LLM generates response — Produces a diagnosis with severity, root cause, affected queries, and remediation steps. Decides to call send_diagnostic_report to deliver findings via SNS.
- Agent returns response to DBA — The DBA receives both the inline response and an email with the full diagnostic report.
Deploying to AgentCore Runtime
The agent is defined and the tools are ready. The complete source code, including both agent implementations, IAM policies, and deployment instructions, is available on GitHub. Refer to An AI Agent for Deadlock Analysis on Amazon Amazon RDS for SQL Server.
Let’s walk through getting it running on AgentCore Runtime.
Prerequisites
The following resources are required for this walkthrough. You can use existing resources or create new ones. Each resource maps to an environment variable used during deployment.
Amazon RDS for SQL Server
- DB_INSTANCE_ID — An RDS for SQL Server instance (Standard or Enterprise Edition)
- Trace flags 1204 and 1222 enabled via a custom DB parameter group. See Monitor deadlocks in Amazon RDS for SQL Server.
- A custom extended event session for blocked_process_report for historical blocking capture. See Using extended events with Amazon RDS for SQL Server.
- DB_SECRET_ID — Database credentials stored in AWS Secrets Manager with a dedicated, least-privilege database login.
- SNS_TOPIC_NAME — An Amazon Simple Notification Service (Amazon SNS) topic with an active subscription
Amazon Bedrock AgentCore
- AWS_REGION — Access to Amazon Bedrock foundation models enabled in your region
- AGENTCORE_ROLE_ARN — An IAM execution role with permissions for Bedrock, Secrets Manager, SNS, and CloudWatch Logs. See AgentCore Runtime permissions.
- SUBNET1, SUBNET2, SECURITY_GROUP_ID — A VPC with private subnets and a security group allowing outbound traffic to RDS on port 1433. See AgentCore VPC configuration.
Development environment
- Python 3.10 or newer
- AWS Command Line Interface (AWS CLI) configured with appropriate permissions
Step 1: Clone and install
Step 2: Set environment variables
Set the following environment variables for your deployment. These reference the resources created in the prerequisites:
Step 3: Configure and deploy
Use the AgentCore CLI to configure and deploy the agent into your VPC:
Step 4: Test your deployed agent
First, simulate a deadlock by creating two tables (##Employees and ##Suppliers) and running two concurrent transactions that update them in opposite order. Session 1 updates ##Employees then ##Suppliers, while Session 2 updates ##Suppliers then ##Employees. This creates a lock ordering conflict that SQL Server resolves by terminating one transaction. Follow the steps in Testing with a simulated deadlock
Then invoke the agent:
The agent reads the deadlock graph from system_health, identifies both sessions and their SQL statements, correlates with active blocking chains, and sends a diagnostic report via SNS with root cause analysis and remediation steps.
Best practices
Cross-session memory. Without memory, every invocation starts fresh. With AgentCore Memory, findings persist across sessions through two complementary systems: short-term memory (STM) stores raw conversation events for session continuity, while long-term memory (LTM) extracts durable insights that carry across invocations.
LTM supports multiple extraction strategies. The semantic strategy captures facts that remain relevant over time: “Recurring deadlocks between Employees and Suppliers updates because of opposite lock ordering.” The summary strategy condenses investigation sessions: “Investigation found 6 deadlocks involving ##Employees and ##Suppliers tables and a 14-session blocking chain caused by an index rebuild.” Transient metrics like current CPU utilization are correctly skipped; only durable patterns are retained.
Create a memory resource with both strategies:
Integrating memory requires a code change to agent.py. Add the AgentCoreMemorySessionManager as the session manager. See agent_with_memory.py for the complete example.
- On Monday, the agent finds 6 deadlocks involving updates to ##Employees and ##Suppliers tables in opposite lock order, and sends a diagnostic report via SNS.
- On Tuesday, the DBA deploys a lock ordering fix based on the agent’s recommendation.
- On Wednesday, the alarm fires again. The agent recalls Monday’s findings from memory, runs a fresh investigation, and compares: “The Employees/Suppliers deadlock pattern has stopped. New deadlock detected between different tables.”
Observability
To enable observability:
- Add aws-opentelemetry-distro to your requirements.txt file.
- Set the environment variable AGENT_OBSERVABILITY_ENABLED=true during deployment.
- AgentCore automatically instruments traces, token usage, and request duration.
- No code changes required.
- View metrics in the CloudWatch GenAI Observability dashboard.
Scaling with additional tools.
The same @tool pattern applies to other diagnostic scripts:
- Slow query analysis via Query Store
- Index recommendations from sys.dm_db_missing_index_details
- TempDB troubleshooting
Strands also supports Model Context Protocol (MCP), allowing agents to connect to external tool servers and extend their capabilities without modifying agent code.
Key takeaways
- The system_health extended event session captures deadlock graphs by default. The agent reads them and delivers root cause analysis.
- Blocking chain analysis uses DMVs to identify head blockers and their SQL. Historical blocker identity requires blocked process threshold and a custom extended event session.
- The @tool decorator connects your existing T-SQL queries to the LLM. The docstring determines when the agent calls each tool.
- Correlation across data sources — connecting deadlocks to transaction errors and blocking to timeouts — is what distinguishes an agent from individual scripts.
- Strands Agents provides the tool framework, AgentCore Runtime provides managed deployment, and together they turn your existing T-SQL expertise into production-ready agents.
- Design tools that are focused (do one thing well), efficient (return only necessary data), reliable (handle errors gracefully), fast (execute quickly), and clear (well-documented). Good tool design is what makes an agent effective.
Clean up
Complete the following steps to clean up your resources:
- On the Amazon RDS console, choose Databases in the navigation pane.
- Select the DB instance to delete.
- On the Actions menu, choose Delete.
- Enter delete me to confirm deletion, then choose Delete.
- When prompted to create a final snapshot and retain automated backup, choose the option appropriate for your needs.
To delete the AgentCore Runtime resource:
To delete the AgentCore Memory resource:
Conclusion
In this post, we showed how to turn existing T-SQL diagnostic scripts into an AI-powered database operations agent using Strands Agents and Amazon Bedrock AgentCore. The agent investigates deadlocks and blocking on Amazon RDS for SQL Server, correlates findings across data sources, and delivers actionable recommendations, all without manual intervention.
To get started, clone the sample repository and deploy the agent against your own RDS for SQL Server instance. Try extending it with additional tools for your most common diagnostic workflows, such as Query Store analysis, index recommendations, or TempDB troubleshooting. We’d love to hear what you build. Share your feedback and questions in the comments section.