AWS Database Blog
Essential tools for monitoring and optimizing Amazon RDS for SQL Server
Amazon Relational Database Service (Amazon RDS) for SQL Server is a fully managed database service that simplifies database administration tasks such as hardware provisioning, database setup, patching, and backups. However, as businesses grow and transaction volumes increase, database performance can become a critical challenge. During peak periods such as holiday shopping seasons or financial reporting cycles, even well-configured RDS for SQL Server instances can experience performance degradation that impacts application responsiveness and customer experience. Without proactive monitoring and optimization, these performance issues often go undetected until they have already affected business operations and customer satisfaction.
In this post, we demonstrate how you can implement a comprehensive monitoring strategy for Amazon RDS for SQL Server by combining AWS native tools with SQL Server diagnostic utilities. We explore AWS services including AWS Trusted Advisor, Amazon CloudWatch Database Insights, Enhanced Monitoring, and Amazon RDS events, alongside native SQL Server tools such as Query Store, Dynamic Management Views (DMVs), and Extended Events. By implementing these monitoring capabilities, you can identify potential bottlenecks before they impact your applications, optimize resource utilization, and maintain consistent database performance as your business scales.
Importance of proactive monitoring
Database performance degradation typically develops gradually and silently, often becoming apparent only after it has already impacted customer experience and business operations. When reports take minutes instead of seconds to generate, or checkout processes stall during peak sales periods, the damage to customer satisfaction and revenue has already occurred. Reacting to these issues after they’ve emerged is substantially more costly and disruptive than implementing proactive monitoring and optimization strategies. Identifying a slow-running query before it affects production requires minutes of analysis, while diagnosing the same issue after it causes application timeouts can consume hours of emergency troubleshooting across multiple teams. By establishing baseline performance metrics and setting intelligent thresholds, you create an early warning system that detects anomalies when they first emerge, giving you time to implement optimizations during maintenance windows rather than during business-critical operations.
As of the writing of this post, the features discussed are supported on Amazon RDS for SQL Server 2016 and later versions (unless noted otherwise). Extended support for SQL Server 2016 will conclude on July 14, 2026. Some features might not be available in all AWS Regions or for all instance classes. Verify feature availability for your specific configuration in the Amazon RDS User Guide.
Pre-requisites
You must have the following prerequisites:
- An RDS for SQL Server DB instance running version 2016 or later
- Appropriate AWS Identity and Access Management (IAM) permissions to access Amazon CloudWatch and Amazon RDS for SQL server
- AWS Management Console access
Amazon CloudWatch monitoring
Amazon CloudWatch monitors critical Amazon RDS for SQL Server metrics, including CPU, memory, storage, I/O operations, and connections. You can use these insights through custom dashboards that visualize performance patterns and set proactive alerts for resource thresholds. This helps teams identify bottlenecks, predict capacity needs, and automate remediation actions before users experience performance issues, maintaining optimal database operation in AWS. To learn more, see Monitoring Amazon RDS metrics with Amazon CloudWatch.
To access CloudWatch metrics for your RDS for SQL Server instance, refer to Monitor Amazon RDS Custom for SQL Server using Amazon CloudWatch.
Amazon RDS generates engine-specific logs for auditing and troubleshooting, accessible through the console, AWS Command Line Interface (AWS CLI), or the Amazon RDS API. Although standard transaction logs aren’t directly viewable, SQL Server instances provide specialized access through functions like rds_fn_log_read_backup_file. Native backup operations also support copying database backups, including transaction logs, to Amazon Simple Storage Service (Amazon S3) for flexible recovery options.
You can view and download Amazon RDS logs through the console or AWS CLI, and also publish them to Amazon CloudWatch Logs. Amazon RDS offers various CloudWatch log types, including audit logs, error logs, general logs, and slow query logs. You can choose which logs to publish to CloudWatch Logs based on your requirements.
For more information about accessing CloudWatch Logs for your RDS for SQL Server instance, refer to Publishing database logs to Amazon CloudWatch Logs. The guide provides step-by-step instructions on configuring, viewing, and analyzing your database logs.
Make sure that your RDS for SQL Server instance is configured to publish logs to CloudWatch because this is not enabled by default for all log types.
Amazon RDS for SQL Server database activity streams
Amazon RDS for SQL Server supports database activity streams, providing a near real-time feed of database activities. To safeguard your database from internal and external threats, and to meet compliance and regulatory standards, you can seamlessly integrate the activity stream with third-party monitoring tools for auditing and oversight. Database activities, including failed logins, are asynchronously pushed to an encrypted data stream, which is set up for your DB instance using Amazon Kinesis Data Streams. For more details on how to enable database activity streams for a near real-time data stream of database activity running on Amazon RDS for SQL Server, see Audit Amazon RDS for SQL Server using database activity streams.
AWS Trusted Advisor
AWS Trusted Advisor helps you optimize costs, increase performance, improve security and resilience, and operate at scale in the cloud. Trusted Advisor continuously evaluates your AWS environment using best practice checks across different categories, and it recommends actions to remediate deviations from best practices. Trusted Advisor checks can be categorized as follows:
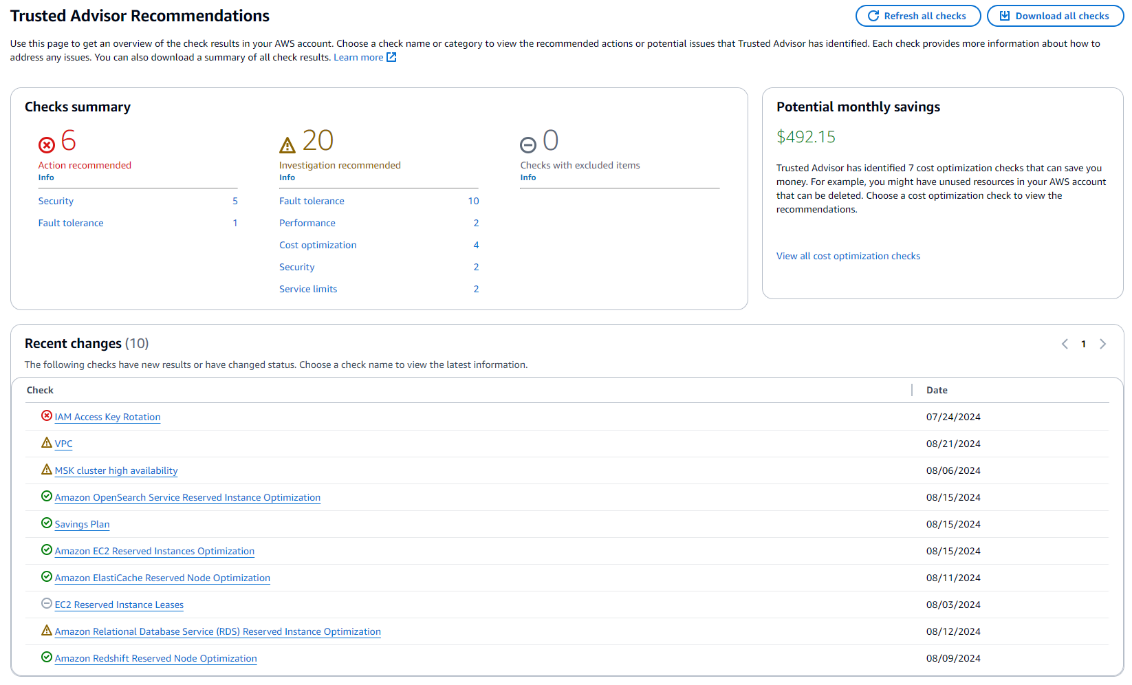
On the Trusted Advisor Recommendations page, view the summary for each category:
- Action recommended (red) – Trusted Advisor recommends an action for the check. For example, a check that detects a security issue for your IAM resources might recommend urgent steps.
- Investigation recommended (yellow) – Trusted Advisor detects a possible issue for the check. For example, a check that reaches a quota for a resource might recommend ways to delete unused resources.
- Checks with excluded items (gray) – Trusted Advisor lists the number of checks that have excluded items, such as resources that you want a check to ignore. For example, this might be Amazon Elastic Compute Cloud (Amazon EC2) instances that you don’t want the check to evaluate.
The following screenshot shows an example summary of the check results for an AWS account.
Amazon CloudWatch Database Insights
AWS discontinued the Amazon RDS Performance Insights console on November 30, 2025. Although the API remains the same, pricing remains unchanged. Users are advised to upgrade DB instances from the Performance Insights paid tier to Database Insights Advanced mode.
CloudWatch Database Insights provides comprehensive monitoring capabilities for multiple database services, including Amazon Aurora (MySQL, PostgreSQL, and PostgreSQL Limitless) and Amazon RDS (SQL Server, MySQL, PostgreSQL, Oracle, and MariaDB), supporting efficient oversight across your entire database infrastructure.
The service features a ready-to-use dashboard with thoughtfully selected metrics and visualizations that you can further customize to suit your needs. By consolidating metrics from your entire database fleet into unified views, Database Insights provides simultaneous monitoring of your database resources.
This proves especially valuable when managing large deployments. For instance, when overseeing hundreds of DB instances, you can quickly identify underperforming databases, then seamlessly transition to deeper diagnostic analysis of the specific problematic instance using the same tool.
To get started with Database Insights, see Turning on the Standard mode of Database Insights for Amazon RDS.
Enhanced Monitoring
Enhanced Monitoring is a tool that captures metrics in real time for the operating system (OS) that your RDS DB instance runs on. These metrics provide up to 1-second granularity for CPU, memory, Amazon RDS and OS processes, file system, and disk I/O data, among others. You can access and analyze these metrics on the Amazon RDS console. To learn more, see Viewing OS metrics in the RDS console.
You can turn Enhanced Monitoring on and off using the console, AWS CLI, or Amazon RDS API. For more information, see Turning Enhanced Monitoring on and off. For additional details on how to monitor real-time Amazon RDS OS metrics with Enhanced Monitoring, see Monitor real-time Amazon RDS OS metrics with flexible granularity using Enhanced Monitoring.
Extended Events on Amazon RDS
Amazon RDS for SQL Server supports Extended Events (XEvents), a powerful monitoring tool that collects detailed data about your SQL Server instances. This feature is automatically enabled for users with primary user privileges and is available for Standard and Enterprise Editions starting from 2012 versions.
Extended Events offers the following capabilities:
- Monitor database operations – Track activities like creating, dropping, or modifying databases, which is useful for auditing, performance tuning, and troubleshooting
- Analyze query performance – Capture information about query execution plans, runtimes, and resource usage, helping you identify and optimize slow-running queries
- Track security events – Monitor failed login attempts, permission changes, and data access activities to identify potential security threats and maintain compliance posture
- Troubleshoot errors and exceptions – Capture error and exception events to diagnose and resolve issues during database operations
- Flexible data targets – Use disk-based or memory-based targets for your XEvents sessions, depending on your monitoring requirements
SQL Server native monitoring tools in Amazon RDS
Amazon RDS for SQL Server provides access to powerful native monitoring capabilities including SQL Server error logs, SQL Server Agent logs, DMVs, Query Store, and Extended Events, helping database administrators perform comprehensive performance analysis and troubleshooting without sacrificing the convenience of a managed database service. These tools complement AWS-specific monitoring features like Enhanced Monitoring and database insights, creating a complete observability framework that bridges SQL Server expertise with cloud-based management.
SQL Server error logs
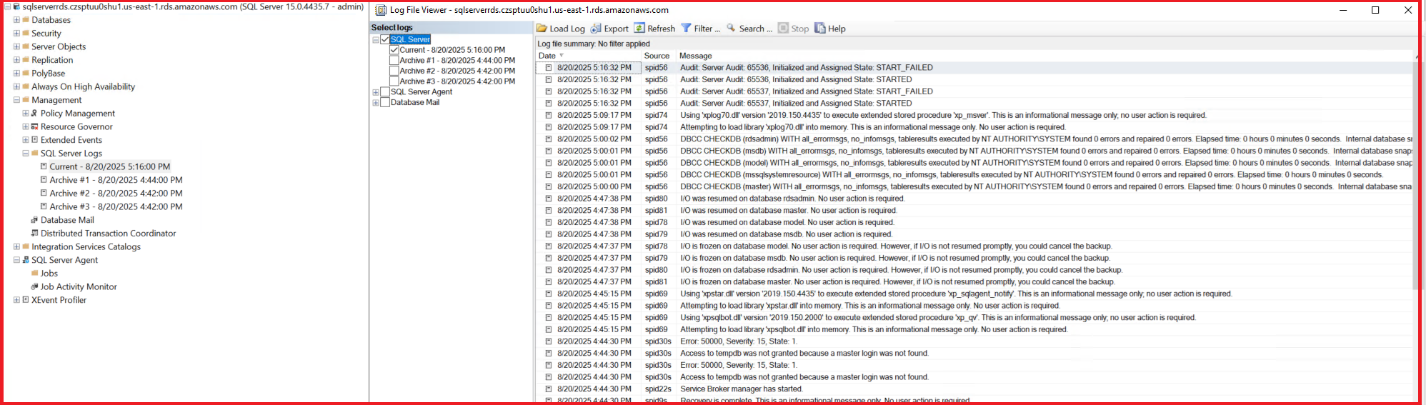
SQL Server error logs provide critical information about database engine errors, warnings, and significant events that might impact performance or availability.
To view the error logs, complete the following steps:
- Connect to Amazon RDS for SQL Server using SQL Server Management Studio (SSMS).
- Expand the Management folder in Object Explorer.
- Choose (right-click) SQL Server Logs and choose View.
- Choose which log file to view (current or archived).
- Filter logs by message type, date, or text content.
Alternatively, you can use T-SQL:
- To read the current error log:
- To read archived log #1:
SQL Server Agent logs
SQL Server Agent logs track job execution history, including successes, failures, scheduling, and execution duration.
To view these logs, complete the following steps:
- Connect to Amazon RDS for SQL Server using SSMS.
- Expand the SQL Server Agent folder in Object Explorer.
- Choose (right-click) Error Logs and choose View Agent Log.
- Filter by date range or message type.
Alternatively, you can use T-SQL:
- to view all job history:
- for a specific job:
SQL Server dynamic management views
DMVs provide real-time insights into database engine operations, resource usage, and query performance metrics. You can use DMVs to identify resource-intensive queries, blocking issues, and performance bottlenecks in real time.
To access DMVs, complete the following steps:
- Connect to Amazon RDS for SQL Server using SSMS or another query tool.
- Execute specific DMV queries based on your monitoring needs.
The following are a few DMV example queries:
Extended Events
Extended Events provides a lightweight, highly configurable monitoring framework for capturing detailed diagnostic information. You can use Extended Events to diagnose intermittent performance issues by capturing specific events with minimal overhead.
To configure Extended Events, complete the following steps:
- Connect to Amazon to RDS for SQL Server using SSMS.
- Choose (right-click) Management, then choose Extended Events and Sessions.
- Choose (right-click) Sessions and choose New Session.
- Define events to capture, filters, and targets.
- Start the session.
The following code is a T-SQL example to create a session:
Query Store
Query Store captures query execution plans and runtime statistics over time. You can compare query performance before and after index changes or code deployments to identify regressions. Query Store is supported on instances running SQL Server 2016 and later versions.
Complete the following steps to set up Query Store:
- Connect to Amazon RDS for SQL Server using SSMS.
- Choose (right-click) your database and choose Properties.
- Choose Query Store and set Operation Mode to Read Write.
- Configure retention settings and choose OK.
The following T-SQL also enables Query Store:
To view Query Store data, complete the following steps:
- Expand the database in Object Explorer.
- Navigate to the Query Store folder.
- Use reports like “Regressed Queries” or “Top Resource Consuming Queries” to compare query performance.
Database Console Commands
DBCC statements perform administrative and diagnostic functions for database maintenance and troubleshooting. You can use them to diagnose index fragmentation issues or database corruption that might impact performance.
The following are common DBCC statements:
Conclusion
In this post, we demonstrated how you can build a comprehensive monitoring framework for Amazon RDS for SQL Server by combining AWS native services with SQL Server diagnostic tools. We explored AWS capabilities including Trusted Advisor, CloudWatch Database Insights, Enhanced Monitoring, and database activity streams, alongside native SQL Server utilities such as error logs, DMVs, Query Store, Extended Events, and DBCC commands. Implementing this monitoring strategy is essential because it transforms database management from reactive troubleshooting into proactive optimization. By establishing baseline metrics and intelligent thresholds across these tools, you gain early visibility into performance anomalies before they impact your applications.
To get started, enable Enhanced Monitoring and Database Insights on your RDS for SQL Server instances, configure Query Store for your critical databases, and establish CloudWatch alarms for key performance metrics. Review the monitoring data regularly to identify trends and optimize resource allocation. As you implement these practices, you’ll develop a deeper understanding of your database performance patterns and be better positioned to scale your infrastructure efficiently.
We welcome your feedback and experiences with these monitoring tools. Share your questions, success stories, or additional optimization techniques in the comments below.