AWS Database Blog
Evaluate logical replication performance with synthetic load generation using Apache JMeter on Amazon Aurora PostgreSQL
Many customers face challenges when they have to choose the right instance size and assess the logical replication latency. When they’re using third-party replication tools like HVR, SharePlex, Oracle GoldenGate, or AWS Database Migration Service (AWS DMS ), it’s important to identify any networking glitches or compute resource allocation at the beginning. In this post, we explain how to generate synthetic workload with Apache JMeter, and evaluate logical replication performance. You can use Apache JMeter either with DMS or other replication tools in heterogeneous or in homogeneous database migration.
Apache JMeter overview
Apache JMeter is a Java-based open-source testing tool used for analyzing and measuring the performance of different software web applications and products. It supports a wide variety of applications, servers and protocols. Also, it is primarily used to run performance and load testing of web applications and databases. We focus on the replication performance, if you are looking for a post about JMeter with Amazon Aurora, refer to Configure a performance testing framework for Amazon Aurora PostgreSQL
Solution overview
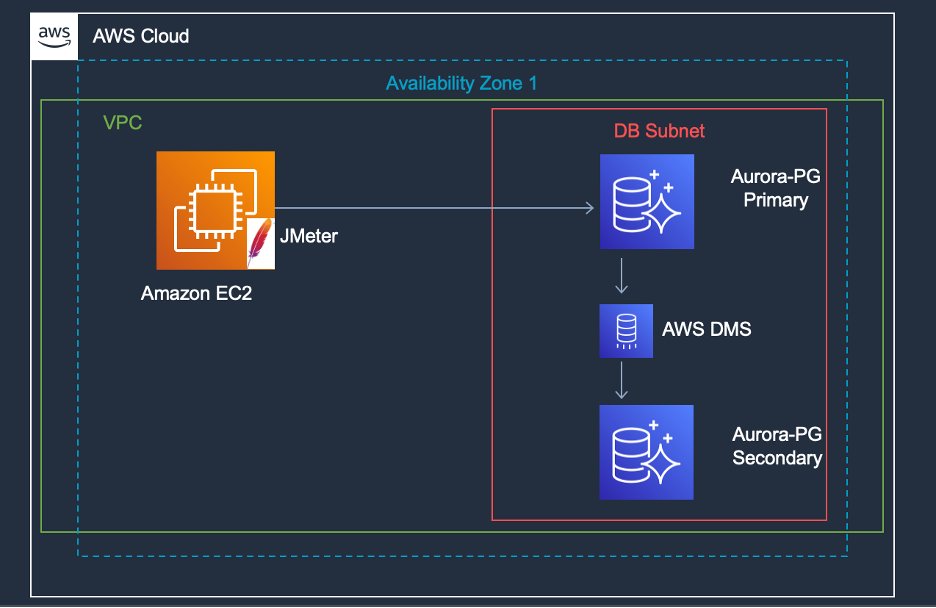
In this post, we demonstrate how Apache JMeter helps to run data-driven performance and load tests against Amazon Aurora PostgreSQL-Compatible Edition. To mimic a production scenario, we created an active-active environment with AWS DMS as a logical replication tool to another Aurora PostgreSQL database instance. We monitor database performance with the help of Amazon RDS Performance Insights, and we can control database load with Apache JMeter and monitor performance.
We test replication throughput performance with different workload sizes; we don’t cover AWS DMS instances or Aurora PostgreSQL database performance.
The following diagram illustrates the solution architecture.
Prerequisites
- An Amazon Elastic Compute Cloud (Amazon EC2) instance for installing and configuring the Apache JMeter software. The EC2 instance should have connectivity to the Aurora database instance and adequate computing power to run a performance test, at lest
- 4GB memory allocated just for JMeter.
- Two Aurora PostgreSQL database instances to test and deploy replication.
- One AWS DMS instance, having connectivity to Primary and Secondary databases.
Implement the solution
We install Apache JMeter on an EC2 instance and connect to an Aurora PostgreSQL database as source and Aurora PostgreSQL as target with AWS DMS as the replication tool. The solution uses a synthetic workload testing schema and SQLs to create multiple load sizes. You can customize this based on your organization’s requirements to capture replication statistics.
With Apache JMeter, we can create multiple threads to generate synthetic load with database manipulation language with different INSERT, UPDATE, and DELETE statements. We can create various sample sizes based on SQL and generate different iterations to create stress and capture throughput and any bottlenecks within the database.
Apache JMeter test plan
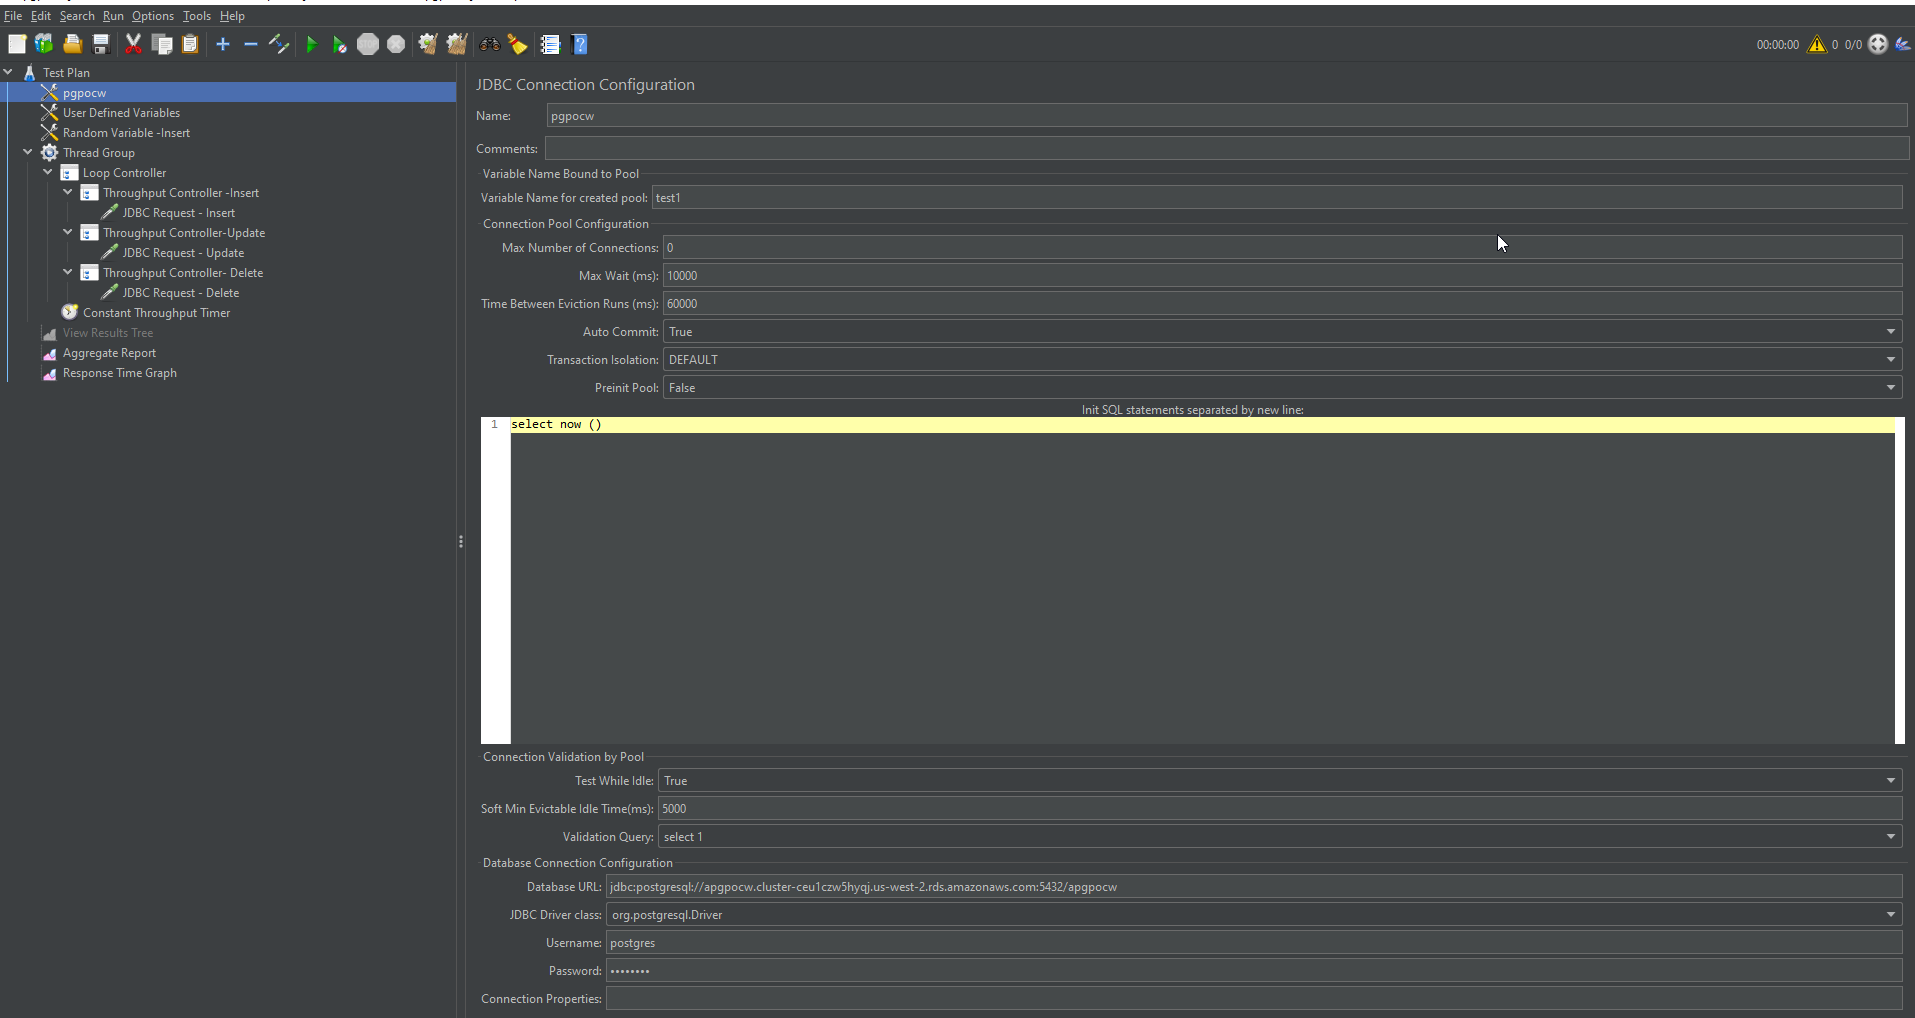
The following screenshot shows JDBC Database Connection.
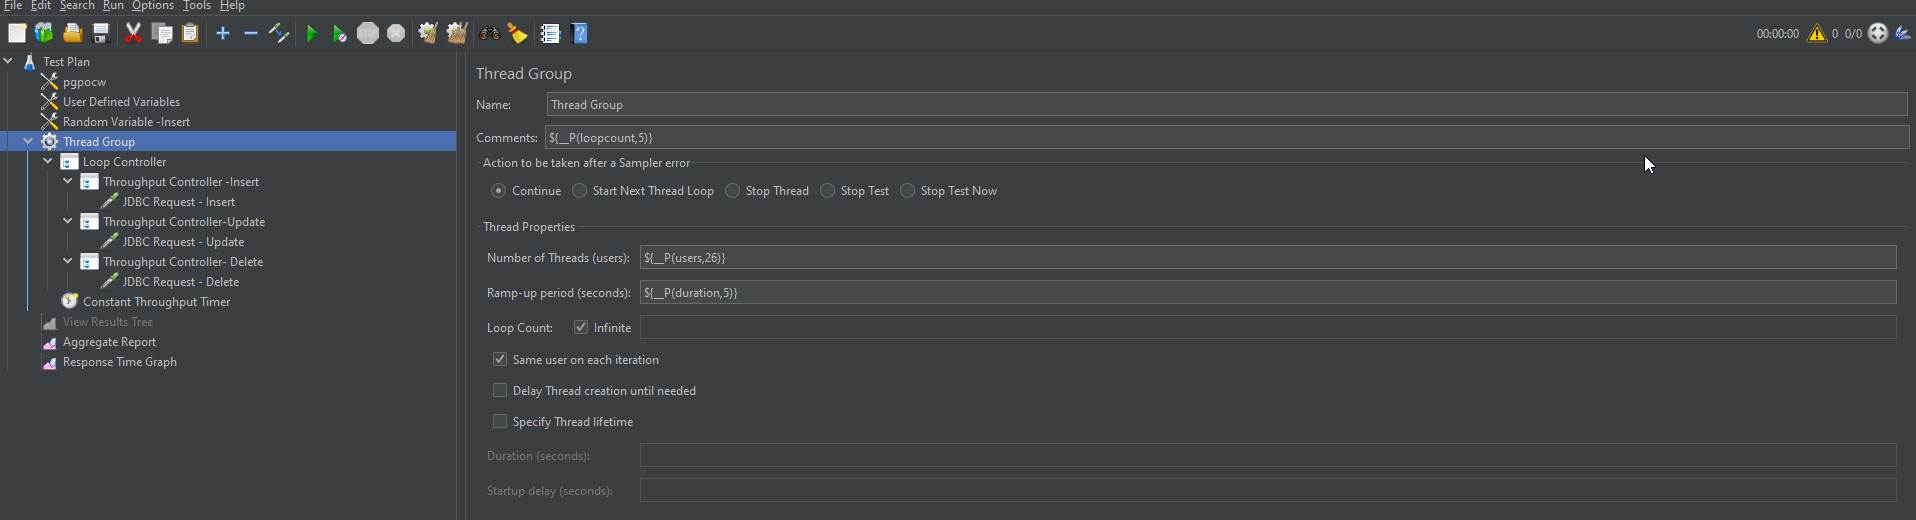
The following screenshots shows Thread Group configuration, where you can configure Number of threads, Ramp-up Period and Loop Counts.
For Apache JMeter installation, refer to Building high-quality benchmark tests for Amazon Redshift using Apache JMeter and complete 25 steps to create a test plan. This test plans will help you create synthetic load in the database and we can measure throughput with aggregate report.
- Connect to EC2 instance.
- Choose the Apache JMeter executable JAR file to open the console.
- Create a new test plan.
- Create the JDBC connection config element.
- Update the JDBC connection config—the variable name for the created pool needs to be the same across the test plan and the subsequent thread group.
- Choose (right-click) Test Plan, choose Add, Config Element, and User Defined Variable.
- Update the user-defined variable.
- Choose (right-click) Test Plan, choose Add, Config Element, and Random Variable.
- Update the random variable.
- Choose (right-click) Test Plan, choose Add, Threads (Users), and Thread Group.
- Update the thread group.
- Choose (right-click) Thread Group, choose Add, Logic Controller, and Loop Controller.
- Update the loop controller.
- Choose (right-click) Thread Group, choose Add, Logic Controller, and Throughput Controller.
- Copy the same controller three times for insert, update, and delete.
- Update the throughput controller.
- Choose (right-click) JDBC Request, under each throughput controller.
- Pass your preferred SQL statements for testing.You can use the sample SQL code from the template below included in this post.
- Choose (right-click) Test Plan, choose Add, Listener, and View Results Tree.This enables quick debugging and status checks on each throughput controller activity. The results tree should be turned off during test cycles to avoid excessive workloads on the test machines and overall JMeter performance.
- Choose (right-click) Test Plan, choose Add, Listener, and Aggregate Report.
- Label the report appropriately:
- Columns of interest are
#Samples, which shows the number of operations from each throughput controller. - Column Average shows the average time it takes to complete the throughput controller statement.
- Error% shows the number of failures on each statement.
- Throughput shows the TPS (transaction per second).
- Columns of interest are
- Change the JVM parameters in the
jmeter.bat(Windows) file located in the Apache Home/binfolder (for example,C:\apache-jmeter-5.4.1\binjmeter). - Increase the heap size from 1G to 4G; set
HEAP=-Xms4g -Xmx4g -XX:MaxMetaspaceSize=256m. - Restart Apache JMeter.
- Run Apache JMeter from the command prompt or GUI mode. From the command prompt, use the following example code:
The following objects are created on both the source and target databases for testing AWS DMS replication:
We use the following SQL commands to generate our synthetic load in:
You can also add the test statements to the Apache JMeter plan if you have an application that has a greater percentage of deletes:
You can create additional INSERT or DELETE statements based on specific requirements.
For this post, we generate load in three different phases. During the ramp-up phase, we increase the database load and capture database performance and evaluate database performance statistics along with latency in the replicated database with AWS DMS replication tools.
During the ramp-up period, you can set users to 100 and period to 60 seconds, so that it creates 100 users in the span of 1 minute, which is approximately 0.6 seconds per user (100 users / 60 seconds). You can set the loop count to 100 or forever, which tells you how many times you want to repeat your test. For our testing purposes we use forever, so we can generate sufficient load and can stop it when we have sufficient data to understand key performance indicators (KPIs).
The Apache JMeter load generated 30 parallel threads with 2-minute increments. We can observe how change data capture (CDC) is capturing those incoming changes and replicating a similar pattern in the target database.
We can use the same SQLs in other databases like Oracle or MySQL; we just have to change the SQL syntax respective to the database engine, and we can repurpose the same database table structure to generate artificial load and evaluate database performance.
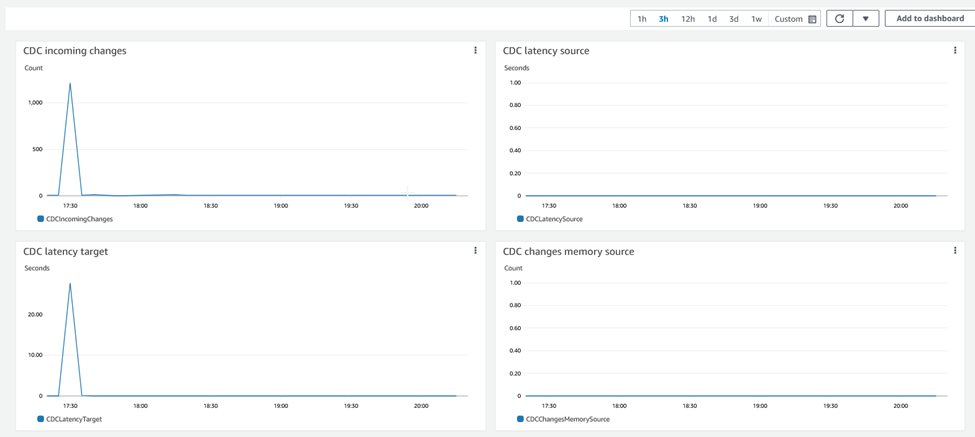
The following CloudWatch CDC graphs shows replication latency on source and target systems during the test.
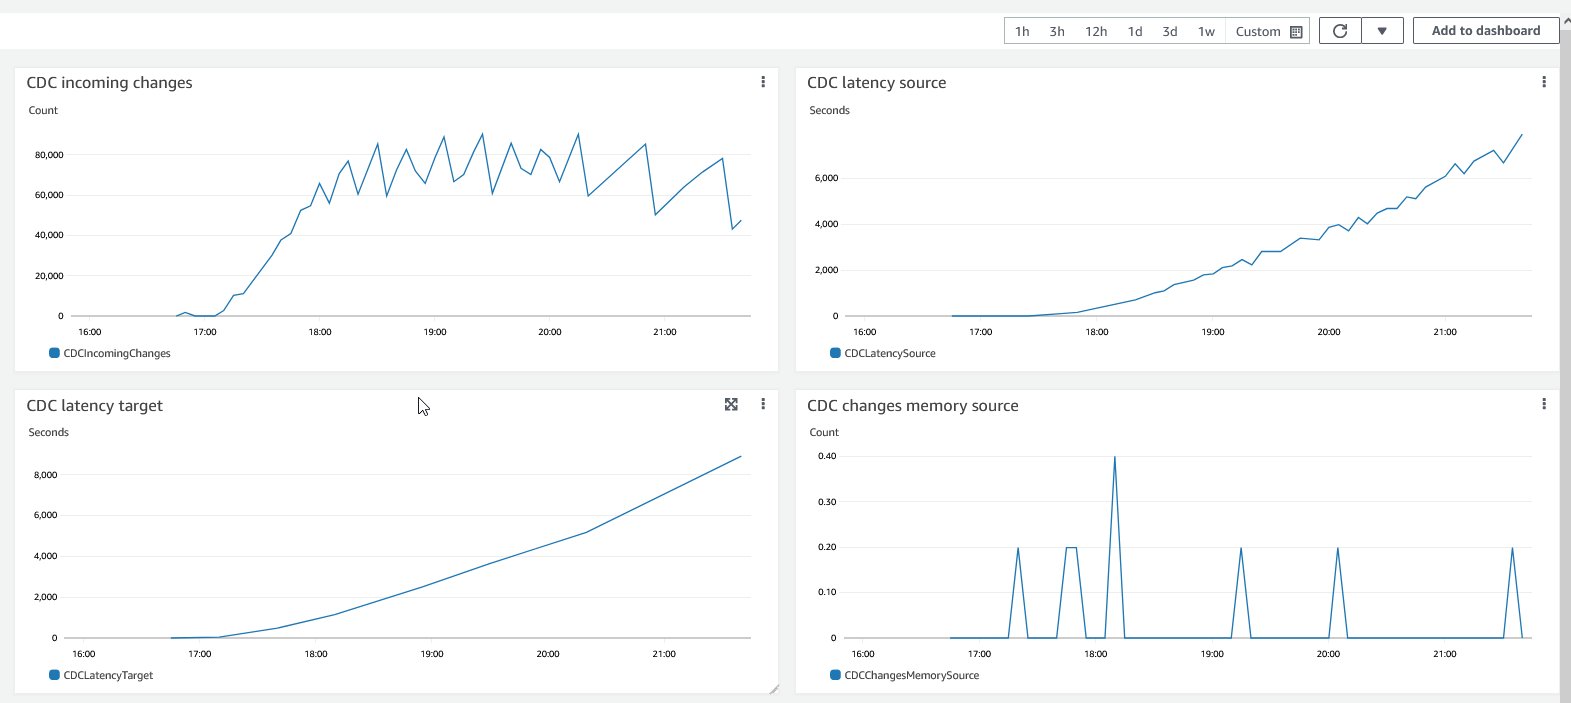
On the target database, the CDC process is applying that SQL, so you see an exponential growth of DML statements and a steadily declining number of runs over a period. From this bell curve, we can capture and estimate latency of CDC and make changes to the instance size to increase throughput.
KPIs for any replication is transaction per second, and it varies based on the size of the transaction, network latency, and data integrity constraint on the target system. In our solution, we generate a real-time scenario where we have different sizes of workloads. For workload 1, transactions are 1 KB, which runs frequently, and 75 MB transactions occur every 15 minutes. For workload 2, transaction size is 2MB.
For database admins, it’s very important to maintain sufficient free space for transactional log generation so it can maintain the database’s optimal performance. In our solution, data is being replicated to the target system, we need to make sure that the source and target instance have sufficient compute resources to process the application data and replicated data, Cloud gives you flexibility to change compute resources. We can adjust the instance class based on performance evaluation. We can also change the instance class for our AWS DMS instance, and change the AWS DMS task settings to increase replication performance. On the target system, source tables without primary keys (PKs) would be a big problem for DMS CDC operations.
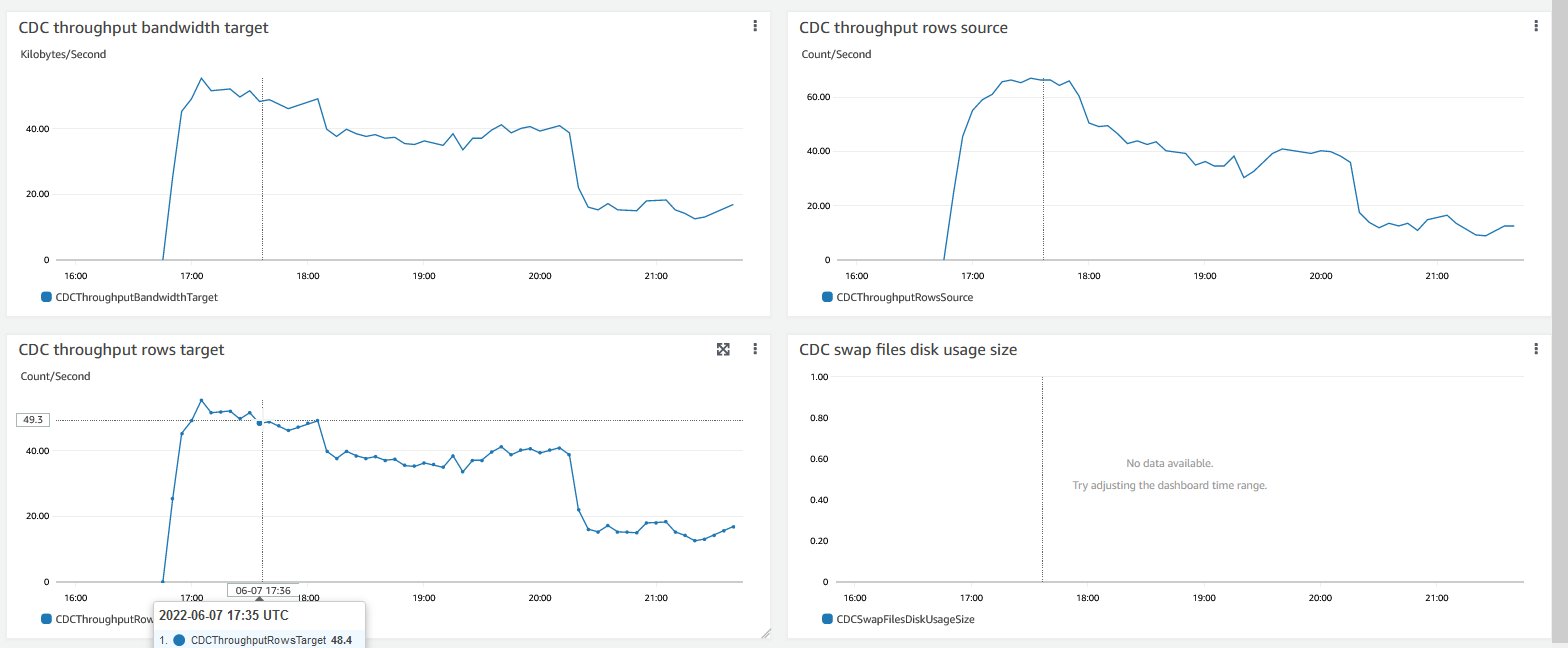
The following graphs illustrate how CDC captures metrics at the source and target system. Also you can observe throughput bandwidth for the source system.

The following graphs show how CDC applies metrics at the target.
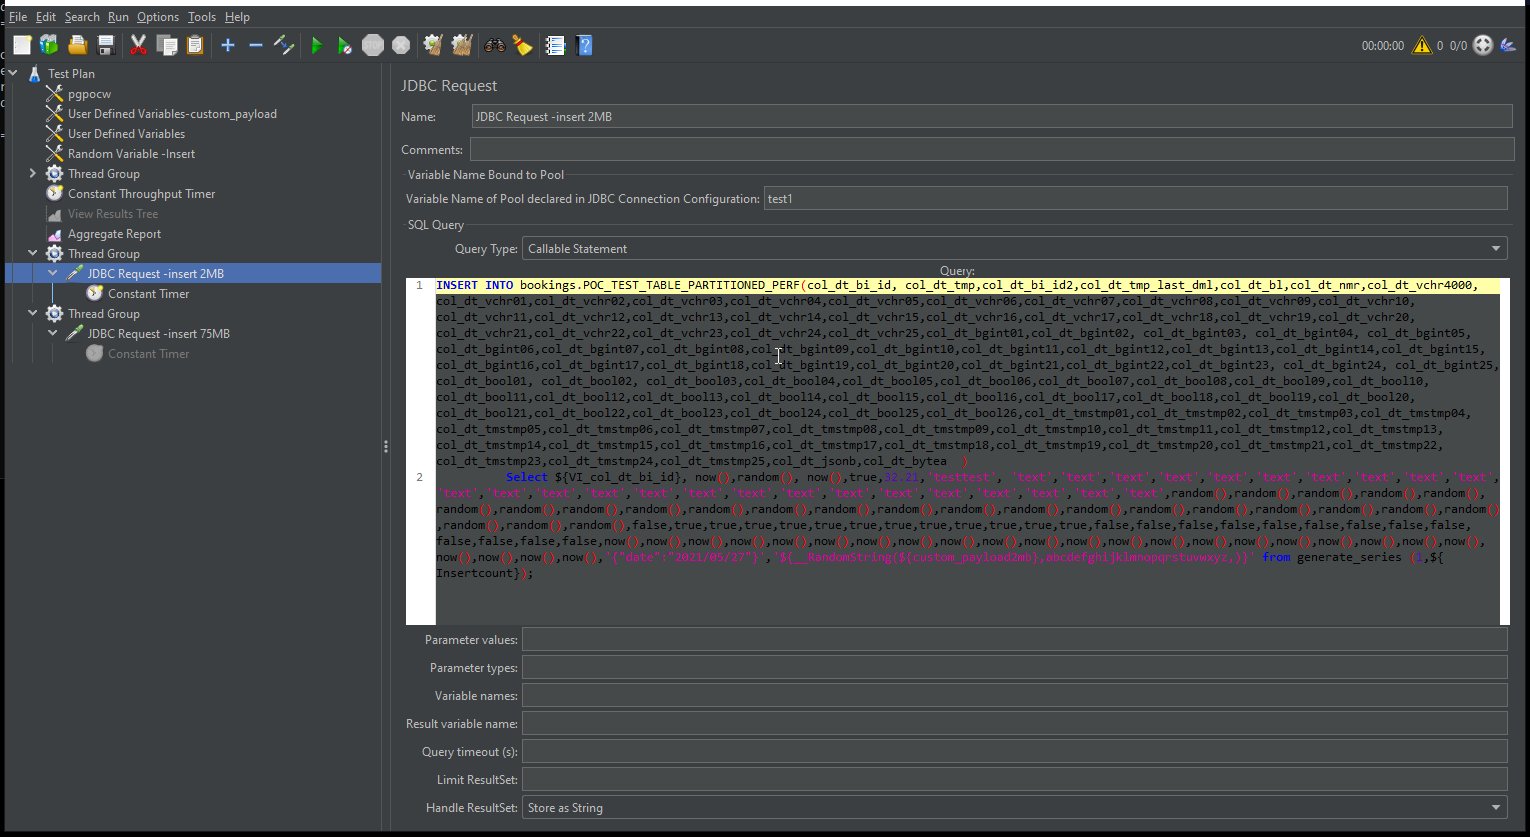
In the following screenshot, we can observe the thread group with 2 MB inserts.
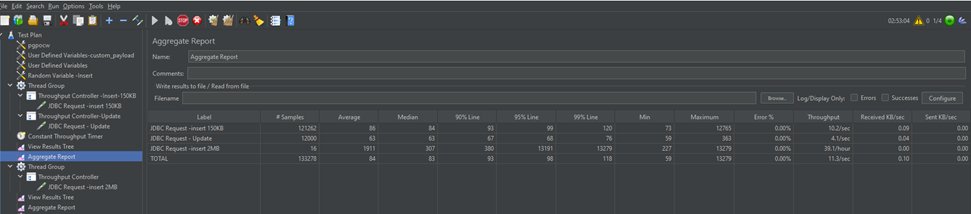
To evaluate replication performance, you can go through the following screenshot which shows the aggregate report, including your throughputs. In our example, it shows that 15 KB inserts were run at 10.2/sec. Similarly, updates ran at around 4.1/sec, and for 2 MB size, at 39.1/hour. We can analyze this data and identify any bottlenecks in our application to identify whether we have any issues with database constraints or issues with triggers or any errors. You can do multiple tests, save the results, and go through various scenarios to evaluate replication performance.
Clean up
The services involved in this solution incur costs. When you’re done using this solution, clean up the following resources:
- EC2 instances – Stop or delete (terminate) the EC2 instances that you provisioned for installing Apache JMeter and hosting services
- Aurora PostgreSQL instances – Delete the DB instances that you created
- AWS DMS instance – Delete the replication instance that you created
Conclusion
In this post, we showed how to use Apache JMeter to create a synthetic load to mimic a production scenario where you have various DML statements and evaluate performance. Choosing right AWS DMS replication instance makes a significant difference in performance. We recommend doing thorough testing of your environment based on the test scenario described in this post to help you choose the right database instance for your database migration. Leave a comment with your questions or feedback.
About the authors
 Harshad Gohil is a Cloud/Database Consultant with Professional Services team at Amazon Web Services. He helps customers to build scalable, highly available and secure solutions in AWS cloud. His focus area is homogenous and heterogeneous migrations of on-premise infrastructure to AWS cloud.
 John Lonappan is a Senior Database Specialist Consultant / Solutions Architect at Amazon Web Services (AWS) with a focus on relational databases. Prior to AWS, John has worked as Database Architect for large Data center providers across the Globe. Outside of work, he is passionate about, Long drives, EV Conversion, playing chess and traveling.
 Arjun Nakkala is a Database consultant with Professional services team. He is helping and enabling customers to build high-available, cost-effective database solutions and migrate their commercial engines to AWS cloud. Curious to learn and implement new technologies around the databases and orchestrate migrations through automation. Prior to joining AWS, he supported production and mission-critical database implementation across the financial, banking and healthcare industry segments.