AWS Database Blog
Help prevent out-of-memory restarts on Aurora MySQL 8.4
When an Amazon Aurora MySQL-Compatible Edition instance runs critically low on memory, the operating system terminates the mysql process. This drops every connection, rolls back in-flight transactions, and triggers a cluster restart. The instinctive fixes (move to a larger instance, or lower max_connections) treat the symptom, not the underlying memory pressure your workload generates.
Aurora has long included out-of-memory (OOM) avoidance that watches system memory and takes recovery actions before the OS steps in. On Aurora MySQL version 3, use the aurora_oom_response parameter to configure these actions; Aurora provides sensible defaults that you can customize. Aurora MySQL version 8.4 adds a new instance-level parameter, aurora_enable_memory_management, on by default, that can help Aurora choose and adjust recovery actions dynamically based on current conditions.
For the complete parameter reference, see the Aurora documentation. Here, we reproduce a memory-pressure event, read the signals Aurora exposes while it happens, and watch the feature keep the database alive that would otherwise have restarted. Then we cover the decisions: when to leave automatic management on versus taking manual control, and what changes when you upgrade from version 3 to 8.4.
Prerequisites
To follow along, you need:
- An Aurora MySQL DB cluster. Automatic memory management (
aurora_enable_memory_management) is available starting in Aurora MySQL version 8.4. On version 3, use the separateaurora_oom_responseparameter instead to configure recovery actions manually. - Permissions to modify DB parameter groups and to view Amazon CloudWatch metrics.
- The Performance Schema enabled, so you can inspect the heaviest memory consumers. On Aurora MySQL version 3, Aurora enables memory instrumentation by default once you enable Performance Schema. On both Aurora MySQL versions, enabling Amazon CloudWatch Database Insights automatically turns on Performance Schema.
Reproducing the OOM scenario is optional and should only be done on a non-production test cluster.
How Aurora MySQL uses memory
An Aurora MySQL instance divides its memory between shared structures and per-session structures. The largest shared consumer is the InnoDB buffer pool, which Aurora sizes automatically from instance memory. On top of that, every connection reserves memory for its own buffers, and queries that sort, group, or join can allocate internal temporary tables that consume memory when they exceed their limits.
Three consumers drive almost every OOM event, and they are also where you fix it:
- The buffer pool is sized to the instance and rarely the sole culprit, but it leaves less headroom on smaller classes.
- Per-connection memory scales with connection count. A fleet that opens thousands of mostly idle connections turns connection growth into memory growth.
- Temporary tables from large
GROUP BY,ORDER BY,DISTINCT, orUNIONoperations can allocate significant memory per query.
A bigger instance gives you more total memory, so it takes longer for buffer pool growth, connection buffers, or temporary tables to exhaust it. But whichever of the three is driving the pressure keeps growing, and will eventually hit the new, higher ceiling too. Identifying which one is the real driver is what lets you fix the cause instead of only paying for more headroom.
How Aurora protects itself: The recovery-action ladder
The OOM avoidance in Aurora escalates through a set of actions, from least to most disruptive. On Aurora MySQL 8.4 with automatic management on, Aurora selects and adjusts these for you. On Aurora MySQL version 3, they are the entries in aurora_oom_response. Some actions are also restricted by deployment type: provisioned clusters run on instances you size yourself, while Aurora Serverless v2 clusters scale capacity automatically and don’t support the two actions that resize memory structures directly.
| Action | What it does | Notes |
print |
Logs the memory-intensive queries and connections to the error log. Nothing is terminated. | Versions 3 and 8.4. |
tune |
Shrinks internal table caches (table_open_cache, table_definition_cache). These restore automatically when memory recovers. |
Provisioned only. Not supported on Aurora Serverless v2, which scales capacity automatically instead. |
tune_buffer_pool |
Shrinks the InnoDB buffer pool. It restores automatically when memory recovers. | Provisioned instances with 2 vCPUs only. Not supported on Aurora Serverless v2. Must be paired with kill_query or kill_connect or it does nothing. |
decline |
Rejects new queries with an error while memory is low. | Versions 3 and 8.4. |
kill_query |
Terminates running SELECT queries, highest memory consumers first. DDL, other DML, and transactions are unaffected. |
If both kill_query and kill_connect are set, only kill_connect activates. |
kill_connect |
Terminates user connections, rolling back their transactions and terminating DDL. | In 3.11+ and 8.4, also terminates connections that try to allocate memory during pressure. |
The ladder matters because it escalates from least to most disruptive: Aurora tunes caches and the buffer pool first, and only terminates queries or connections if pressure continues. Getting that order right by hand, along with constraints such as tune_buffer_pool needing a terminate action to take effect, is a common pitfall. That is exactly what automatic management removes.
Aurora MySQL version 3 today, and what changes when you upgrade to version 8.4
On version 3, Aurora auto-configures aurora_oom_response from engine version, instance class, and memory. Per the Aurora documentation on out-of-memory issues, smaller instances on 3.08+ default to a protective set like print,tune,tune_buffer_pool,decline,kill_connect, and from 3.09 larger instances default to print,decline,kill_connect. Defaults vary by engine version and instance class, so check the effective value with SHOW GLOBAL STATUS LIKE 'aurora_oom%' rather than assuming.
The upgrade to version 8.4 introduces one behavior worth planning for. When aurora_enable_memory_management is ON (the default), your existing aurora_oom_response is ignored, which is expected and generally an improvement. But if you turn automatic management OFF on version 8.4, aurora_oom_response is empty by default, unlike version 3’s populated defaults. A version 8.4 cluster with automatic management disabled and nothing configured can therefore have fewer recovery actions enabled than the version 3 cluster it was upgraded from. If you plan to run with manual control on version 8.4, set aurora_oom_response explicitly as part of the upgrade, and validate the memory-health metrics on a non-production cluster first.
Reproduce and read a memory-pressure event
A parameter list doesn’t show you what an incident looks like. This section forces one on a test cluster, reads the signals Aurora exposes in order, and then shows the same workload with protection turned off so you can see what the feature is actually helping to prevent.
Force memory pressure
On a non-production Aurora MySQL version 8.4 test cluster (here a db.r7g.large with 16 GB and a table of about 6.1 million rows, roughly 3.7 GB in size), drive many concurrent sessions through large in-memory sorts. Each session gets its own sort buffer, the per-connection memory MySQL uses to sort result rows for operations like ORDER BY when no index can produce the order directly. Give each session a large sort buffer, then run a full-table ORDER BY on an unindexed column, from roughly 40 sessions at once. The exact number that triggers pressure varies by engine patch version and instance state. Too few sessions do not saturate memory, and too many can overwhelm the instance faster than automatic management can shed load, so ramp up gradually (for example 40, then 60, then 100) until AuroraMemoryHealthState climbs above 0:
The instance has 16 GB, but 40 sessions each able to claim up to a 1 GB sort buffer can demand up to 40 GB, far more memory than exists. As concurrency rises, two CloudWatch metrics move together: FreeableMemory (the memory on the instance available for new allocations, including OS and database caches) falls, and SwapUsage (how much of that memory has spilled to disk-backed swap because physical memory ran out) climbs. On its own, falling FreeableMemory isn’t an alarm. MySQL and the OS use free memory for caching. The pattern that signals danger is a rapid FreeableMemory decline combined with rising SwapUsage. Under this load, between 20:51 and 20:54 UTC (the same window AuroraMemoryHealthState spiked, see Figure 3), FreeableMemory repeatedly fell from a steady approximately 6.7 GB down to as low as 1.3 GB while automatic management held the line. SwapUsage rose to roughly 184 MB.
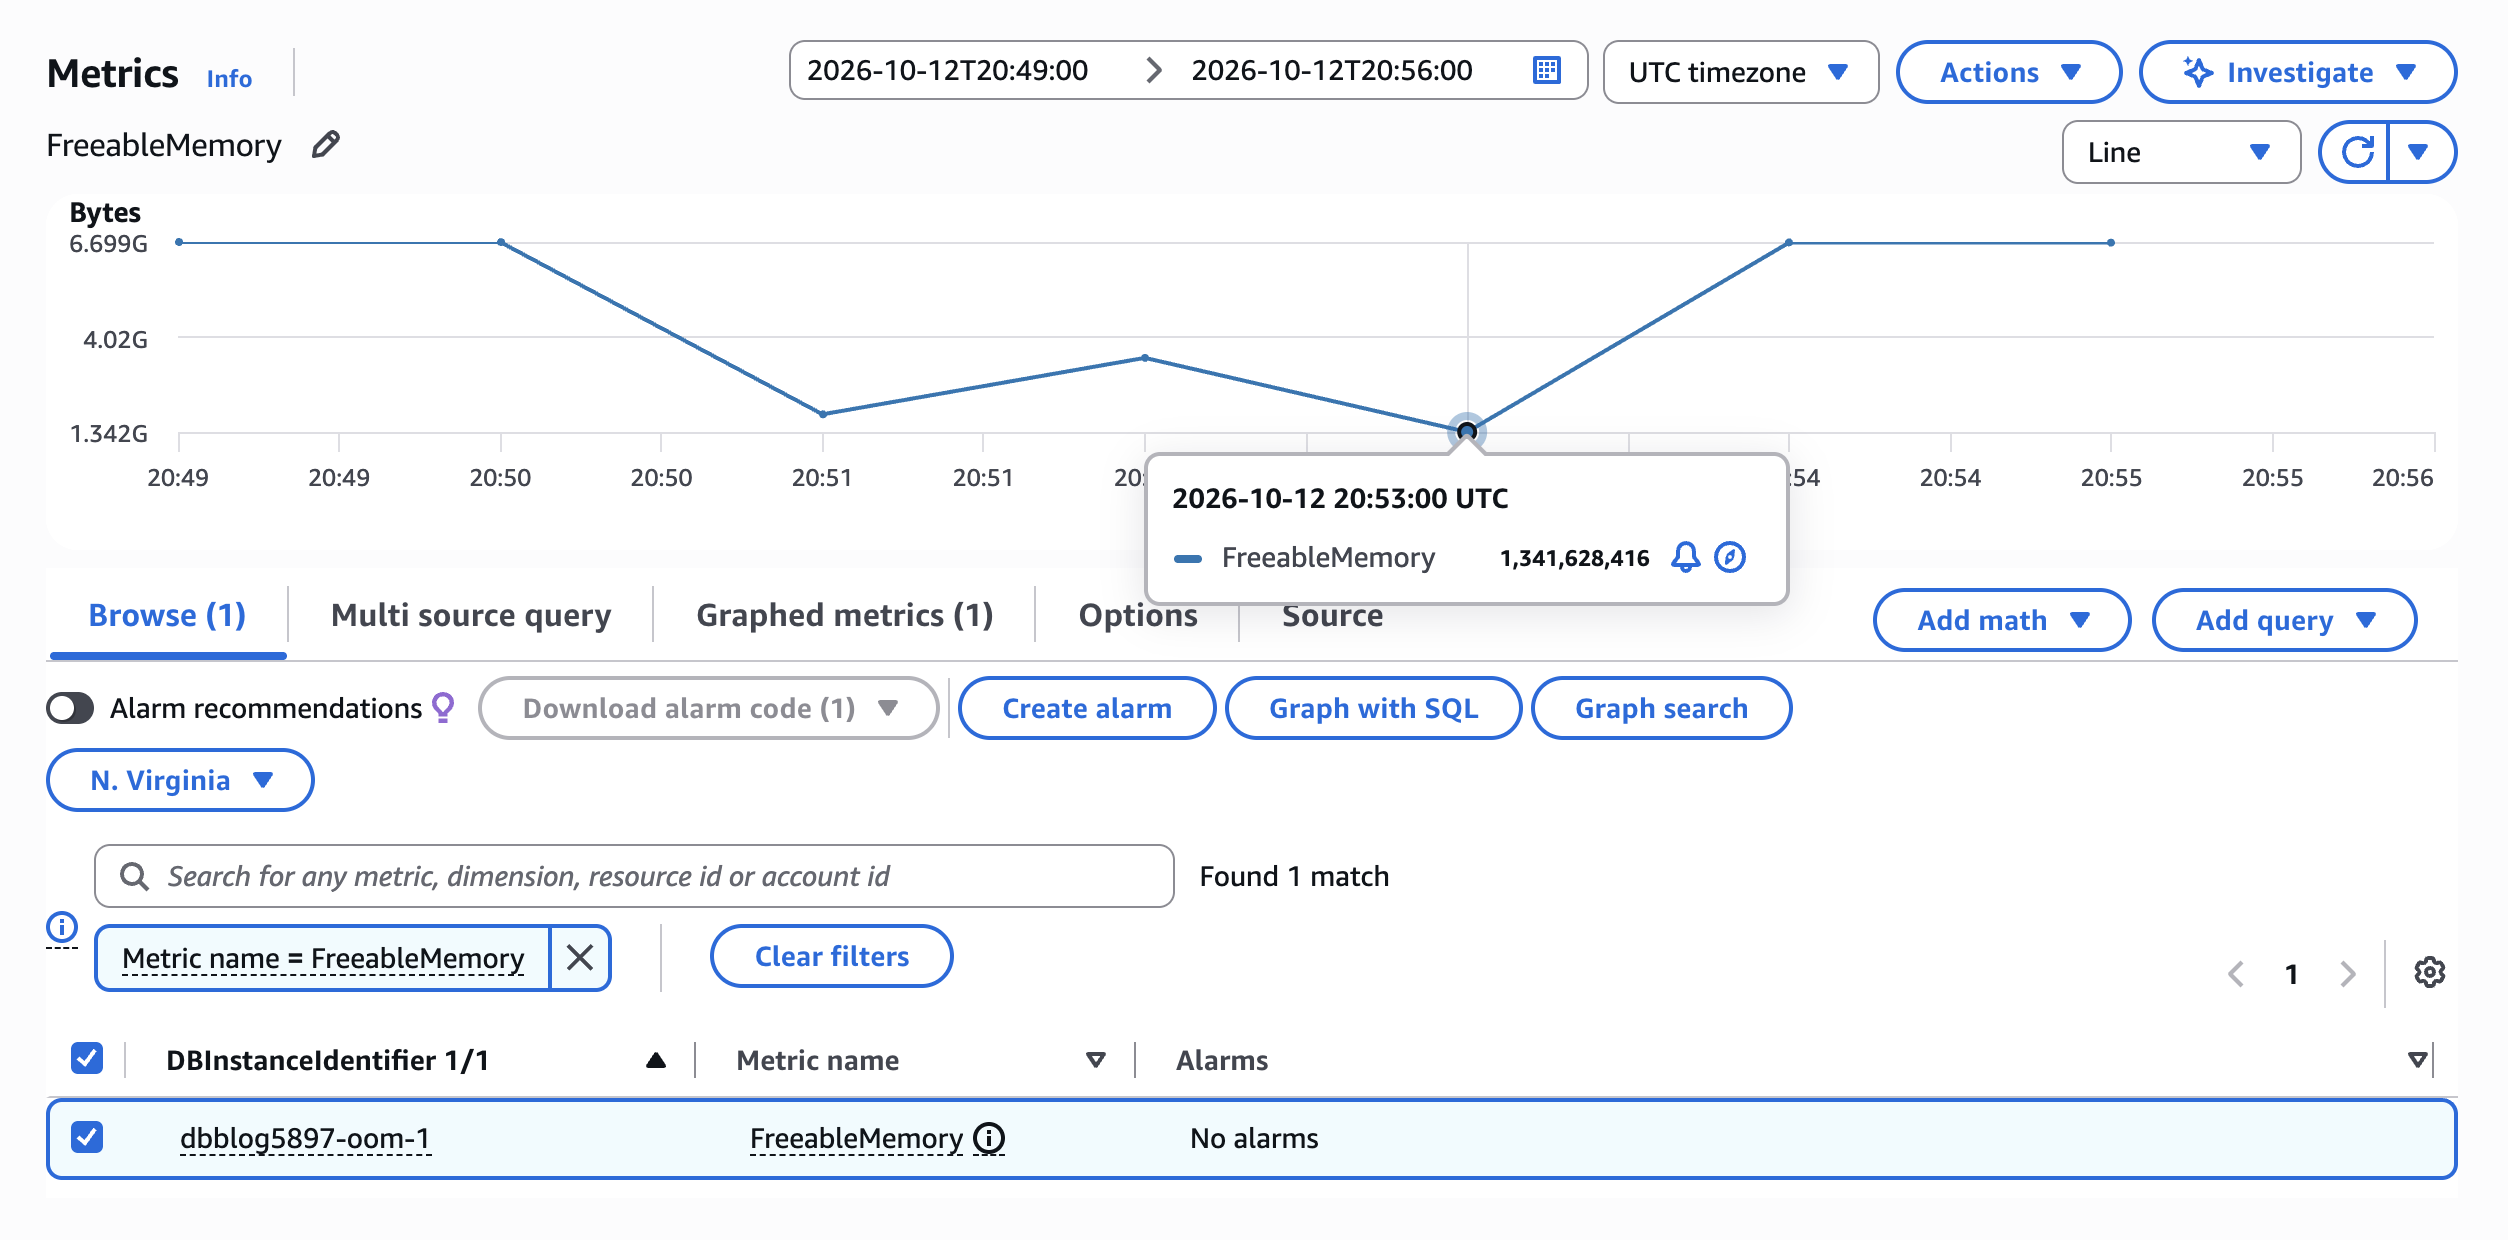
Figure 1: CloudWatch FreeableMemory for the instance. It holds steady near 6.7 GB, then dips as low as 1.3 GB between 20:51 and 20:54 UTC as the workload saturates memory, recovering each time automatic management sheds load. The run with automatic management turned off (described in the following section) shows a different shape: a single sharp drop followed by the OS terminating the process.
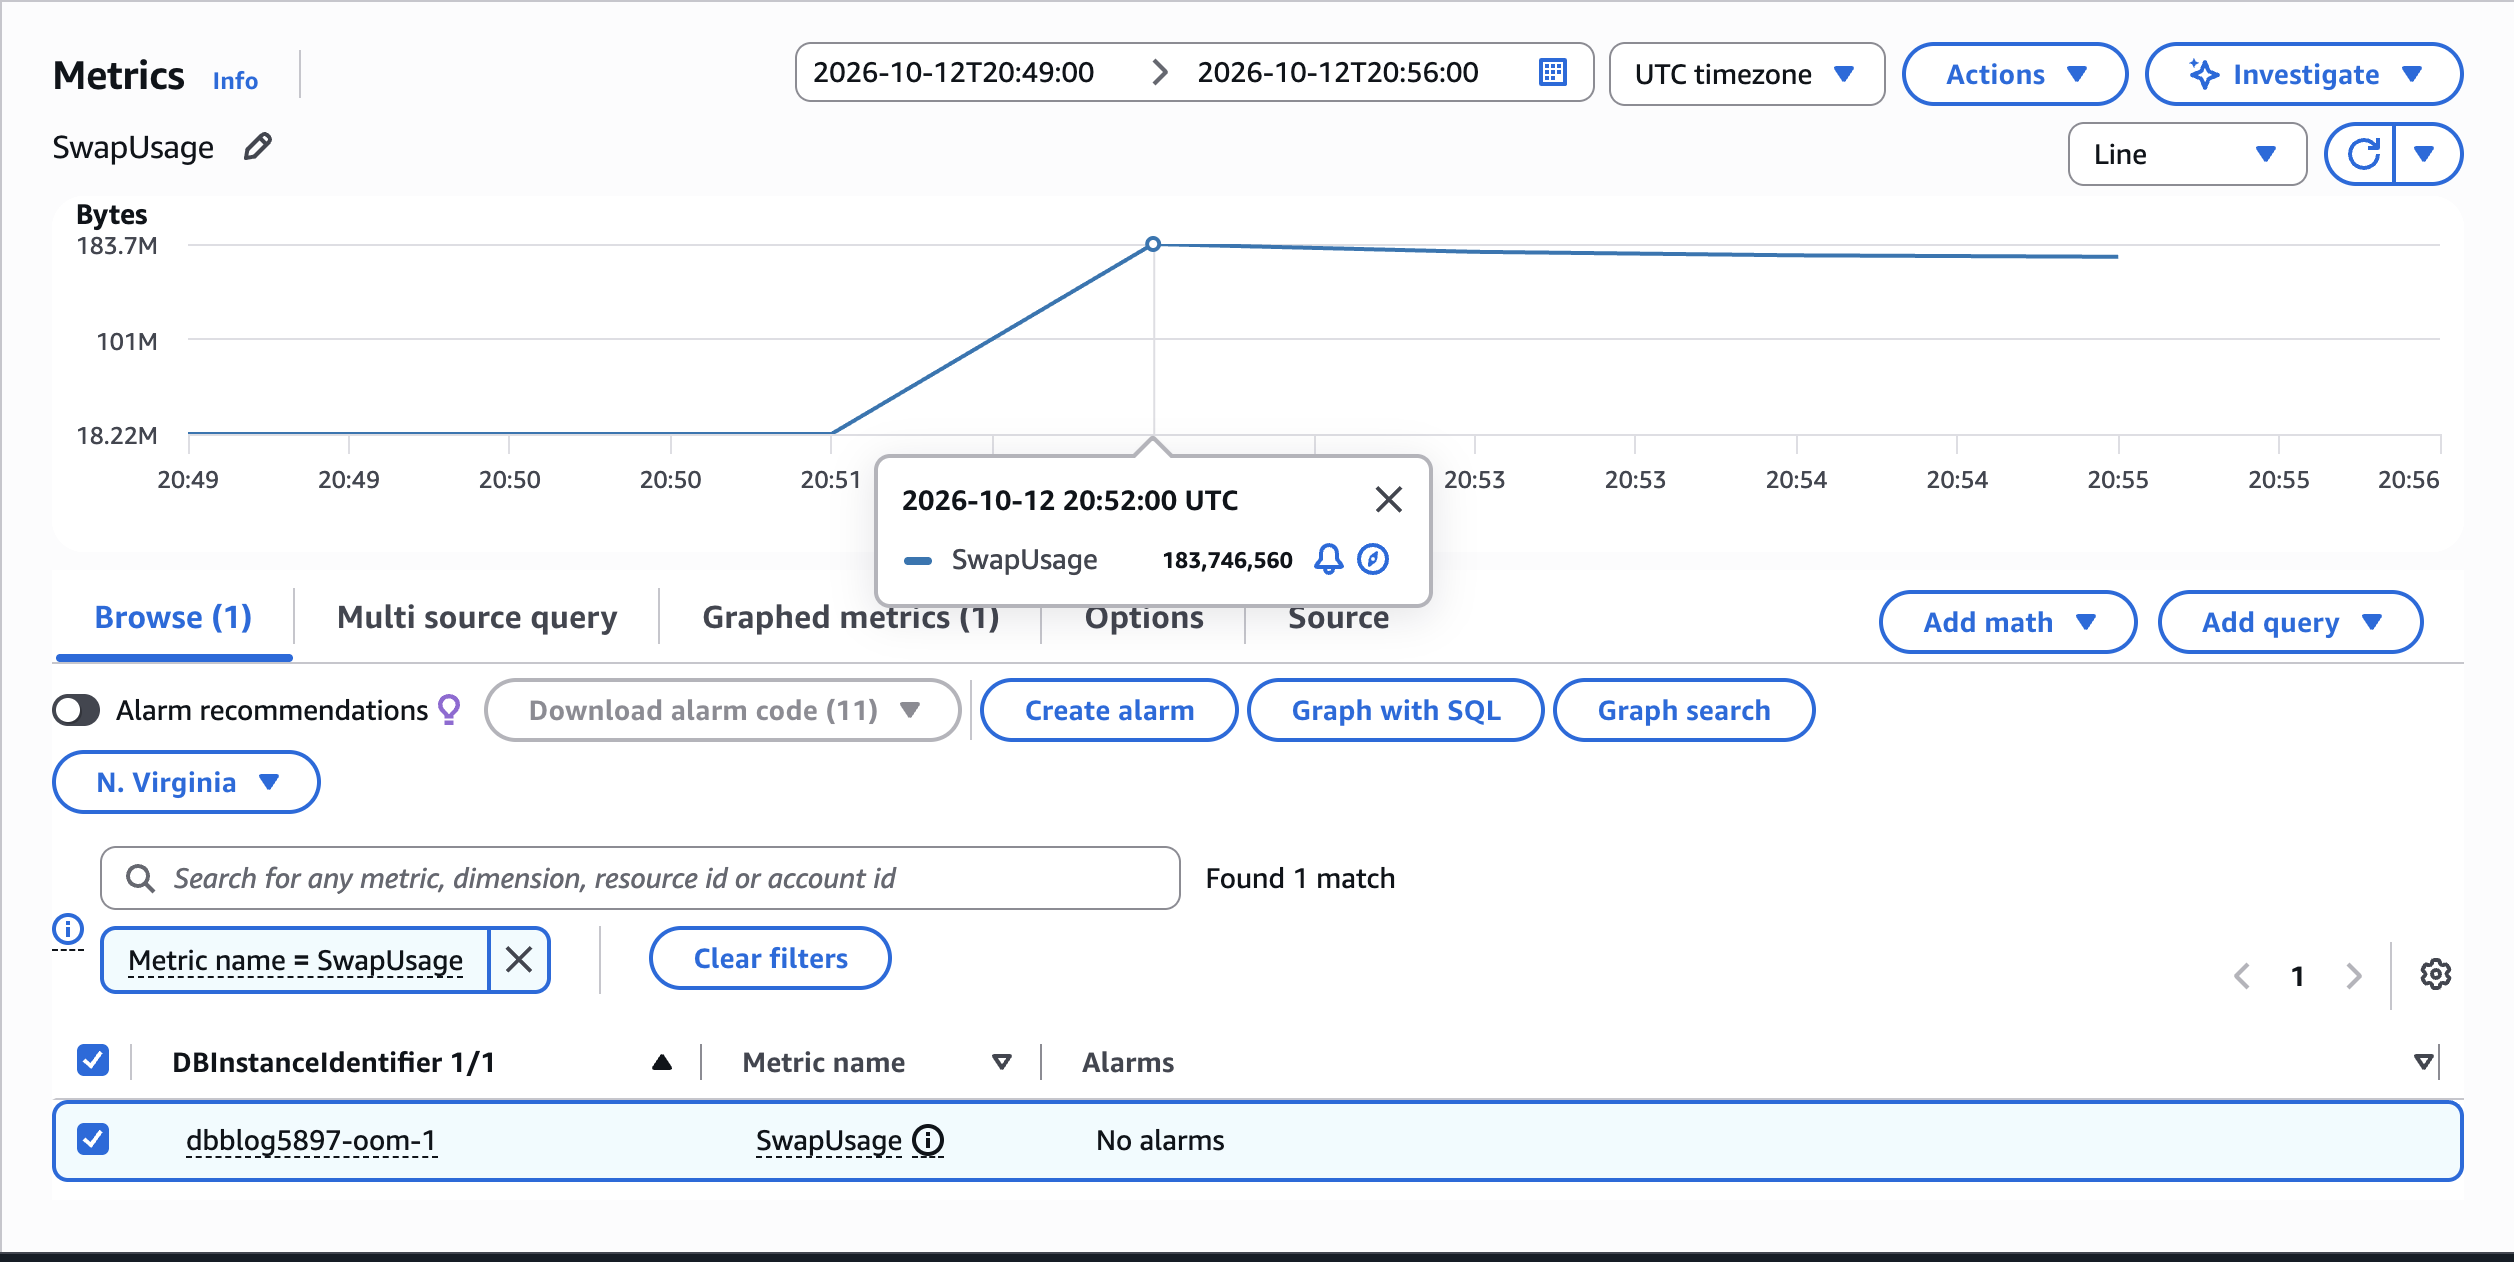
Figure 2: CloudWatch SwapUsage over the same window, rising to about 184 MB as memory tightens.
Read the signals in order
When memory tightens, Aurora exposes the event through a consistent set of signals. Reading them in order tells you what happened and what to do.
1. Start with memory health. AuroraMemoryHealthState reports 0 (healthy), 5 (moderate pressure), or 10 (critical). Find it in the CloudWatch console under the Amazon Relational Database Service (Amazon RDS) metrics for your DB instance, or query it directly with the CloudWatch GetMetricData API. A move from 0 to 5 to 10 is the event beginning. Alarm on any sustained value above 0 so you see pressure before a restart, not after.
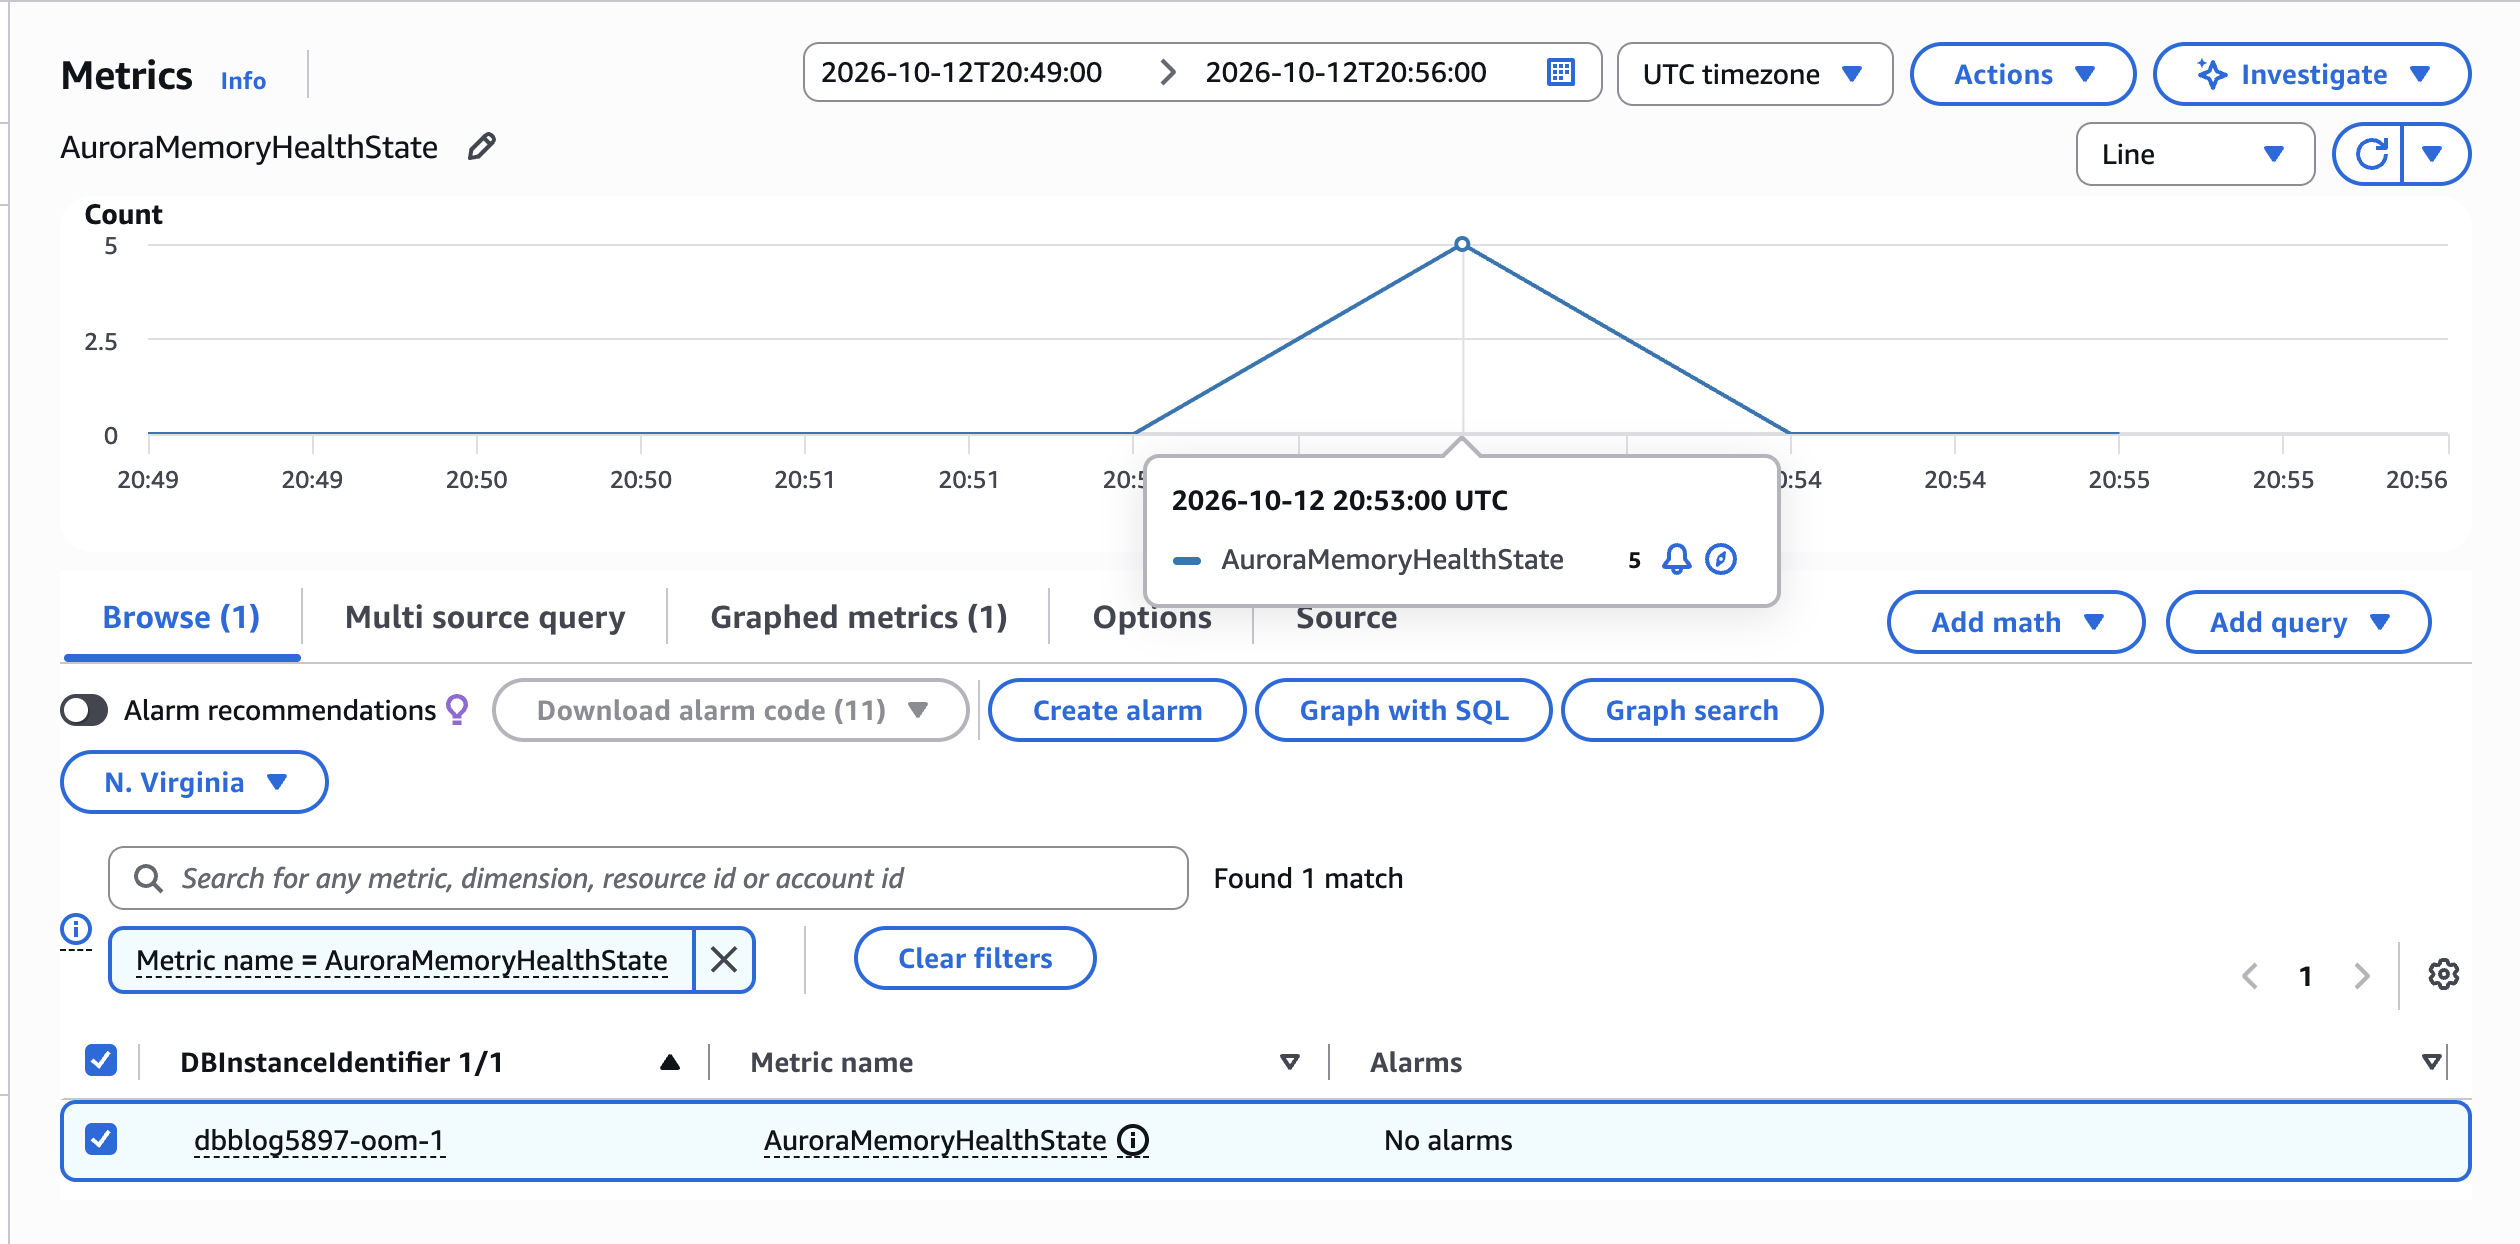
Figure 3: CloudWatch AuroraMemoryHealthState. It sits flat at 0 and spikes to 5 (moderate pressure) at the moment the workload saturates memory.
2. Confirm which actions are in effect. Check the runtime OOM status. Connect to the instance with a MySQL client (for example, the mysql command-line tool or MySQL Workbench) and run this on an Aurora MySQL version 8.4.8 instance at rest:
Aurora_oom_response shows the actions Aurora is actually using (here print,decline,kill_connect), chosen automatically even though the settable aurora_oom_response parameter is empty on version 8.4 (see the preceding version 8.4 section). aurora_oom_avoidance_recovery_state is INACTIVE when memory is healthy. Polling the same query under load shows the transition mid-event:
ACTIVE means Aurora is intervening right now.
3. See what Aurora did during the event. Under the load, AuroraMemoryHealthState rose from 0 to 5 and Aurora began shedding work. Applications saw the recovery actions directly, in their own database client’s error output, as MySQL error 1041:
Those counts are also tracked as CloudWatch metrics, AuroraMemoryNumDeclinedSqlTotal and AuroraMemoryNumKillConnTotal, so you don’t need to rely on client-side error counting to know how much work the feature shed. Over this pressure window they climbed in repeated bursts rather than a single steady ramp, matching the error log’s pattern of distinct detect-and-recover cycles a few seconds apart:
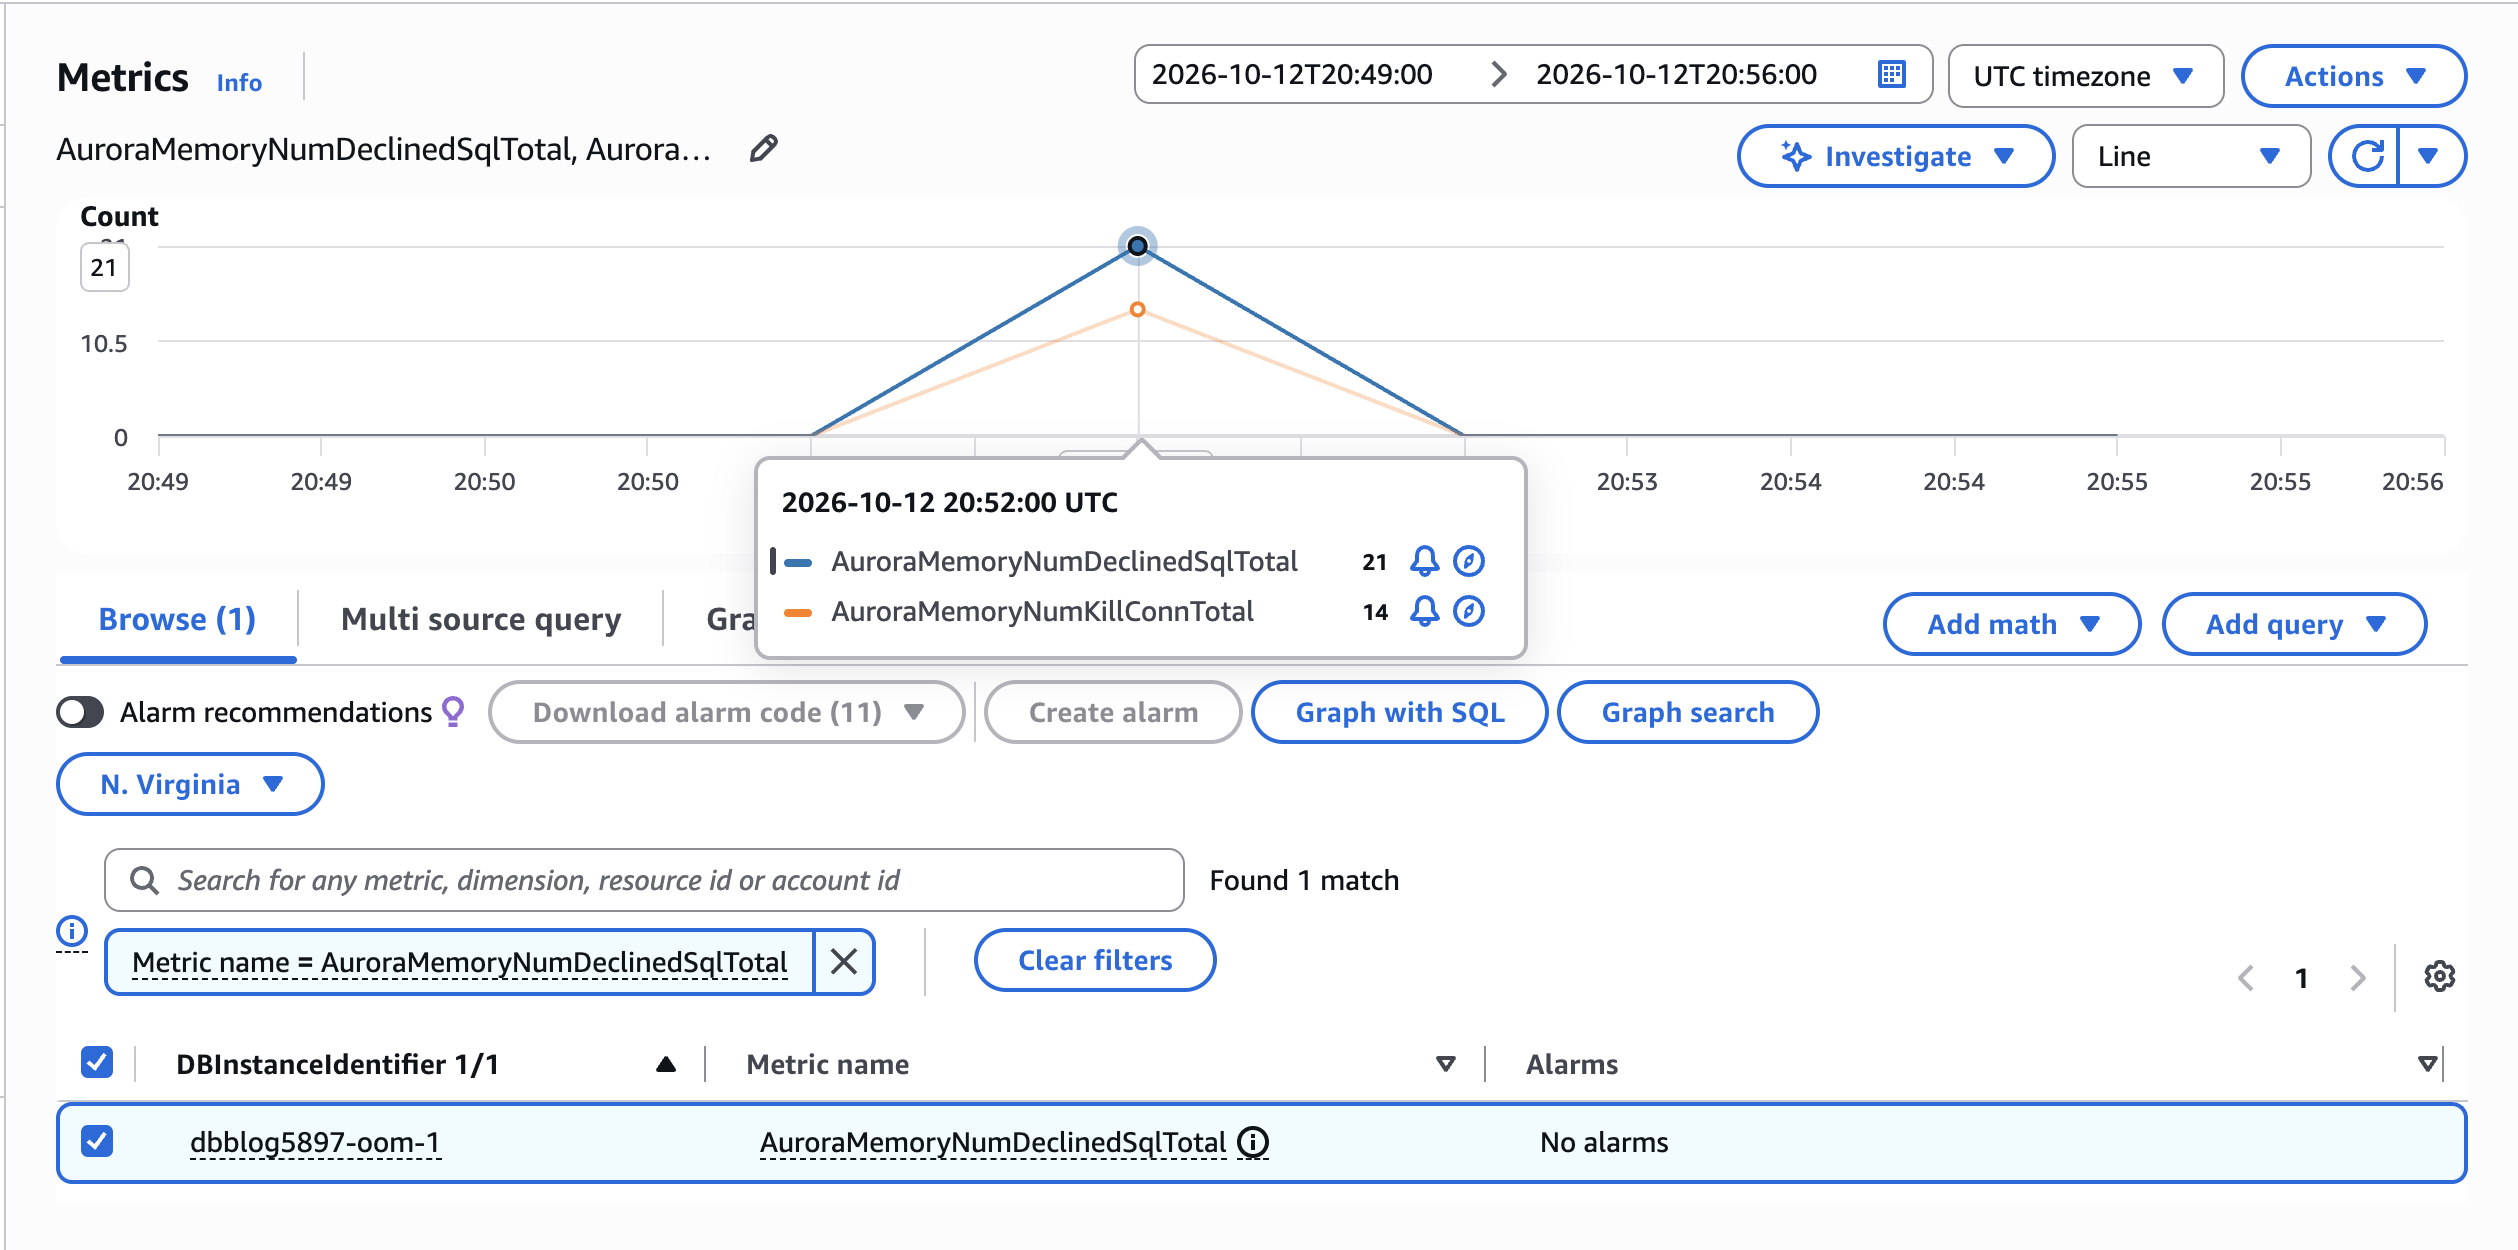
Figure 4: CloudWatch AuroraMemoryNumDeclinedSqlTotal and AuroraMemoryNumKillConnTotal over the pressure window, peaking at 21 declined queries and 14 terminated connections in the 20:52 UTC data point.
The number of terminated connections can exceed the number of connections open at a single instant, because clients that get disconnected often reconnect immediately and get caught by the next cycle. The cumulative count across a multi-cycle event reflects that repeated churn, not a one-time mass termination. Those are the decline and kill_connect actions from the ladder doing their job: new and heaviest work is rejected so the instance stays up. Critically, the database did not restart.
4. Read the error log. Download it from the RDS console (go to your instance, then Logs & events, then Logs) or with aws rds download-db-log-file-portion. Recovery messages are prefixed Aurora memory management: on version 8.4 (and OOM crash avoidance: on version 3), and they name the specific queries and connections involved:
The memory report names the biggest consumers. Here, 5 surviving user connections held about 5.37 GB between them, each one close to the full 1 GB sort_buffer_size setting. That provides a route from detecting pressure to identifying its root cause, and the paired “Memory recovered” line confirms what the recovery cost: 21 declined queries and 2 terminated connections for this single cycle.
5. Attribute it to a consumer. Use the Performance Schema memory summary to find the components and connections holding the most memory, then map it back to buffer pool, per-connection memory, or temporary tables:
This output comes from a lighter run of the same query with 4 concurrent sessions, which kept memory below the level where Aurora declines the diagnostic query itself. Filesort_buffer::sort_keys alone accounts for about 4.0 GB, close to 1 GB per session, matching the sort_buffer_size setting. That is roughly 18 times every other component combined, and about 43 times the next-largest single component (hash0hash, at about 94 MB). That single line confirms the cause: the concurrent ORDER BY sorts allocating large per-session sort buffers, not the buffer pool or a leak elsewhere. Under critical pressure, Aurora can decline this diagnostic query along with the workload, so run it as soon as pressure eases, or rely on the error log’s memory report during the peak.
6. Confirm the outcome. AuroraMemoryHealthState returns to 0 and aurora_oom_avoidance_recovery_state goes back to INACTIVE once the pressure clears. That means Aurora rode out the event. If instead os.memory.outOfMemoryKillCount (a Performance Insights operating system counter) is non-zero, the OS terminated the process and a restart followed. Recovery didn’t keep up, and the workload or instance size needs attention.
The same workload with protection off
To see what the feature helps prevent, set aurora_enable_memory_management = OFF with an empty aurora_oom_response, reboot to apply (changing this parameter takes effect only after a reboot), and run the identical workload in a separate test window from the preceding protected run. With no recovery actions, memory pressure runs to exhaustion and the OS terminates the database process:
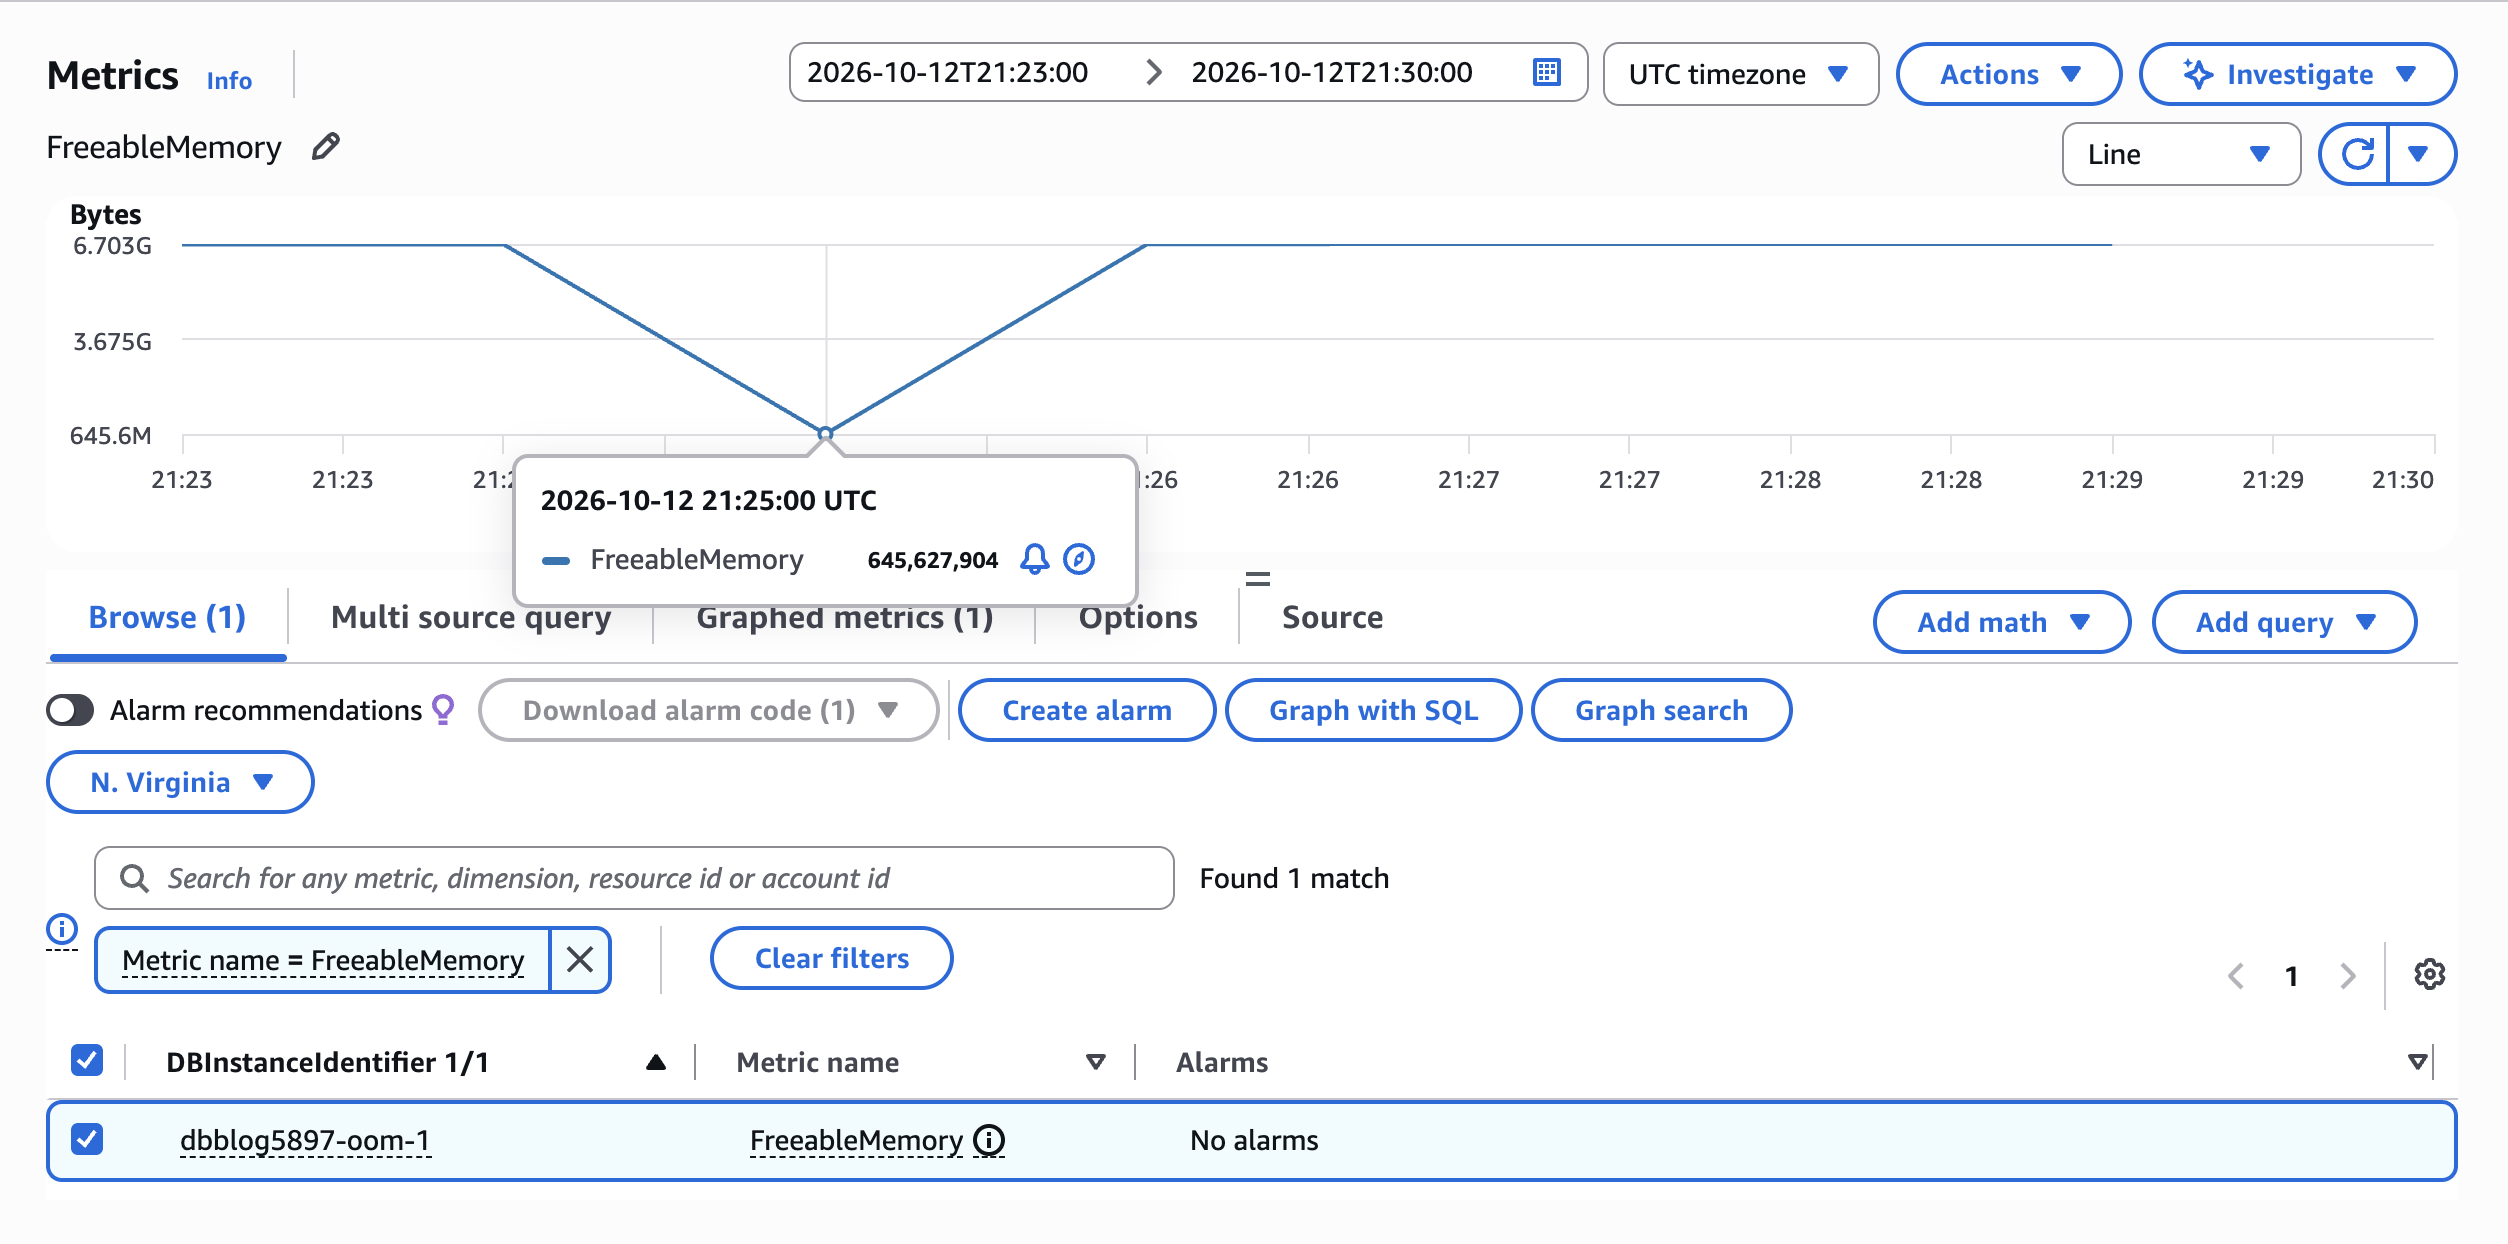
Figure 5: CloudWatch FreeableMemory for the same workload with automatic memory management off. Unlike the protected run’s repeated recovery, memory drops once to about 645 MB at 21:25 UTC and then snaps back to baseline as the instance restarts.
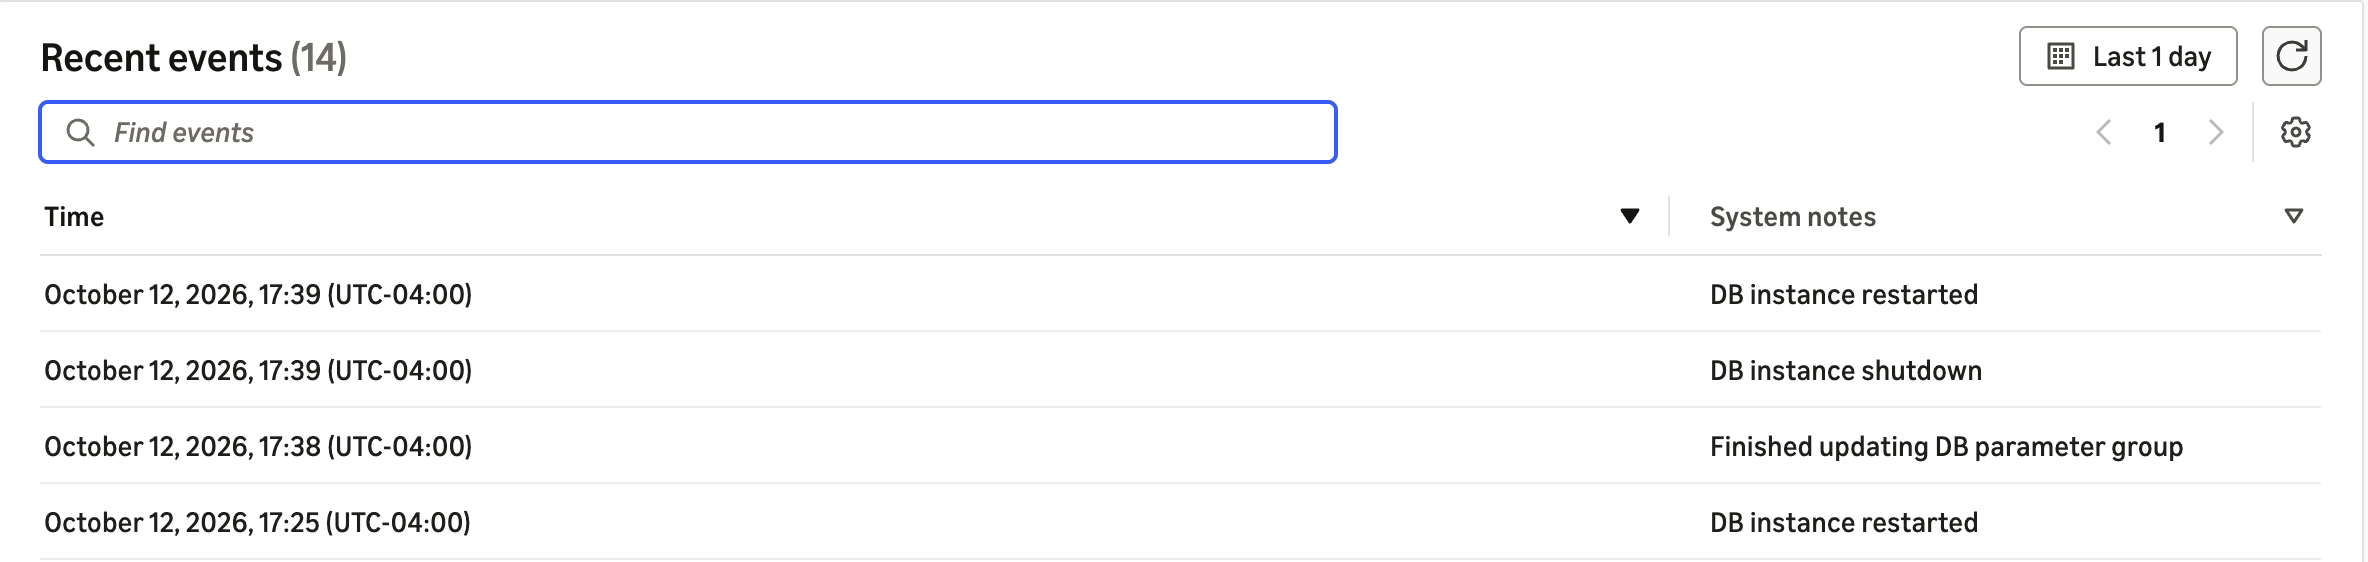
Figure 6: RDS events for the instance with automatic memory management turned off. The 17:25 restart has no preceding shutdown entry, unlike the planned parameter-group reboot preceding it. The RDS console displays times in your browser’s local time zone (here UTC-04:00), so 17:25 in this figure is the same event as 21:25 UTC in Figure 5.
The database was unreachable for about 30 seconds: the new mysqld process started roughly 29 seconds after the load launched and was accepting connections again a few seconds after that. Every connection drops and the cluster restarts. Instead of the graceful 1041 declines, applications see connection resets and “can’t connect” errors. That illustrates how the feature can help maintain database availability by shedding load during memory pressure events. With automatic management back on (the default), the same workload produces the recovery sequence from the previous section: some declined queries and terminated connections, and a database that stays up. That contrast is the whole value of the feature.
After an OFF test, turn the feature back on, reboot, and verify it:
Leaving the parameter group on OFF after a test is how an unprotected production cluster happens by accident.
Decide: Keep automatic management on, or take manual control
For the large majority of Aurora MySQL version 8.4 workloads, the right choice is the default: leave aurora_enable_memory_management set to ON. Aurora adjusts the actions to conditions, and you avoid the constraints that make manual configuration error-prone. Verifying it’s on and staying on a current patch level is the whole task.
There are narrower cases for turning it OFF and setting aurora_oom_response yourself:
- You need a deterministic, fixed action set for change-controlled environments where dynamic behavior is undesirable.
- Your workload is latency-sensitive online transaction processing (OLTP) and you would rather terminate a heavy query (
kill_query) than reject all new queries (decline), or the reverse. - You must protect a specific class of work and want to avoid
kill_connectentirely.
If you do take manual control, two rules matter: pair tune_buffer_pool with kill_query or kill_connect or it won’t resize the pool, and never leave aurora_oom_response empty in production, which disables recovery entirely.
Aurora Serverless v2 differences
The preceding reproduction used a provisioned instance. Aurora Serverless v2 responds differently, per the Aurora documentation: it responds to memory pressure first by scaling up Aurora Capacity Units (ACUs) to add memory. If pressure persists while scaling is in progress, Aurora can terminate existing connections to recover. Termination of connections that try to allocate memory happens only once the instance has reached its configured maximum ACU and can scale no further. The tune and tune_buffer_pool actions are not supported on Aurora Serverless v2. The others behave as on provisioned instances. Two implications: size the maximum ACU with real memory headroom so scaling has room to work, and make sure clients reconnect gracefully, since error 1041 can appear here too (see Limitations).
Take immediate action
When you catch memory pressure in progress:
- Confirm protection is active.
SHOW GLOBAL STATUS LIKE 'aurora_oom%'showsaurora_oom_avoidance_recovery_state = ACTIVEduring an event. To check whether automatic management itself is on, useSHOW GLOBAL VARIABLES LIKE 'aurora_enable_memory_management'instead, since that’s a parameter, not a status. - Find and stop the heaviest query. Identify it from the error log or Performance Schema and cancel it if it’s non-critical with
CALL mysql.rds_kill_query(<id>);. - Stabilize connections. Pool with Amazon RDS Proxy so a connection surge doesn’t become a memory surge.
- Reduce pressure at the source. Index the queries that build large temporary tables, and right-size
max_connectionsto the instance.
Summary
The following table sums up how OOM protection differs between the two Aurora MySQL versions:
| Capability | Aurora MySQL version 3 | Aurora MySQL version 8.4 |
| Prevention parameter | aurora_oom_response (auto-set defaults) |
aurora_enable_memory_management (ON by default) |
| Mechanism | Fixed recovery-action ladder | Dynamic recovery-action ladder |
| Default protection | Populated defaults by instance class | Managed automatically |
| Manual override | Edit aurora_oom_response |
Set OFF, then set aurora_oom_response (empty by default) |
| Key metric | AuroraMemoryHealthState |
AuroraMemoryHealthState |
Limitations
- If you turn automatic management
OFFon version 8.4,aurora_oom_responseis empty by default, so no recovery actions run until you configure them explicitly. tune_buffer_poolis supported on provisioned instances with 2 vCPUs only, and needs to be paired withkill_queryorkill_connect. On its own it does nothing.- If both
kill_queryandkill_connectare set, onlykill_connectactivates. kill_connectrolls back open transactions on the connections it terminates.- Applications need retry handling for MySQL error
1041wherever they connect to Aurora MySQL. A provisioned instance under automatic management can decline queries and terminate connections the same way Aurora Serverless v2 does. - The feature
aurora_enable_memory_managementis available only in Aurora MySQL 8.4. OOM avoidance is specific to Aurora MySQL and does not exist on RDS for MySQL.
Conclusion
Out-of-memory restarts are preventable, and on Aurora MySQL they’re increasingly avoided for you. We reproduced a memory-pressure event, read it through health state, the recovery counters, and the error log, and saw the same workload restart the database once protection was removed. We then covered when to keep automatic memory management on versus taking manual control, what changes when you move from version 3 to 8.4, and the Aurora Serverless v2 differences.
A safe posture on version 8.4 is the default: keep aurora_enable_memory_management on, stay current on patches, and alarm on AuroraMemoryHealthState so a protected instance does not quietly becomes a stressed one. And because recovery actions are a safety net, reduce the pressure at its source: pool connections so connection growth doesn’t become memory growth, and index the queries that build large temporary tables.
To learn more, see Troubleshooting out-of-memory issues for Aurora MySQL databases, Troubleshooting memory usage issues for Aurora MySQL databases, and Best practices for Aurora MySQL performance and scaling. If you have questions or suggestions, leave a comment, or visit AWS re:Post.