AWS Database Blog
How Intuit and AWS systematically improved resiliency on ElastiCache using AWS Fault Injection Service
Intuit is a global financial technology platform that helps consumers and small businesses prosper. With products including TurboTax, QuickBooks, Credit Karma, and Mailchimp, Intuit serves tens of millions of customers across more than 100 countries. For products like TurboTax, which processes millions of tax returns across a compressed filing season, and QuickBooks, which small businesses depend on for daily financial operations, availability is not a quality-of-life consideration. It’s directly tied to customer outcomes and business continuity.
At this scale, caching isn’t an optimization layer. It’s load-bearing infrastructure. Intuit’s services rely on Amazon ElastiCache to offload database reads, accelerate authorization decisions, and serve entitlement and configuration data at low latency across multiple Availability Zones.
Amazon ElastiCache is a fully managed, in-memory caching service that supports Valkey, Memcached, and Redis OSS, delivering microsecond read and write latency for real-time applications such as caching, session stores, and leaderboards. ElastiCache manages provisioning, software patching, node monitoring, and backups, so teams can scale in-memory workloads without operating the underlying cache infrastructure.
Three categories of services sit at the center of this architecture: a unified caching layer that provides shared data access for downstream consumers, an entitlement service that manages product access and subscription state, and a web orchestration service that coordinates page assembly and content delivery for customer-facing experiences. Together, these services handle a significant share of Intuit’s peak traffic, making their reliability a direct proxy for customer experience.
In this post, we show you how Intuit and AWS built higher resiliency using AWS Fault Injection Service (AWS FIS) and Amazon ElastiCache to verify the fixes under a real Availability Zone impairment at production-level load. We walk through the experiment setup, what to measure during the fault window, and the before-and-after results, so you can run the same validation on your own clusters.
Challenge
Routine workload monitoring across Intuit’s services surfaced a recurring pattern: a small number of client-side misconfigurations in how applications connected to ElastiCache were causing repeated disruptions. The ElastiCache service itself was healthy. The issues came from the clients connecting to it, and each one traced back to the same short list of root causes. Rather than treating them as isolated incidents, Intuit’s Safety Engineering team engaged AWS architects to investigate resilience across the full stack, from client library configuration to control-plane behavior. That investigation produced a structured validation plan, a co-authored resiliency checklist, and ultimately a production-scale AWS GameDay to prove the fixes held under real AZ loss.
The investigation surfaced a consistent pattern across three categories of failure:
- Infrastructure-level issues: Availability Zone (AZ) impairments, node-level failures, and network bandwidth exhaustion.
- Application-level gaps: clients running Lettuce versions earlier than 6.2.2 missed out-of-the-box resilience benefits: topology refresh was absent, connection and retry tuning was insufficient, and the result was avoidable risk during node failures.
- Operational gaps: limited observability into key metrics like bandwidth and replication lag, and reliance on manual recovery during failover.
The monitoring data revealed how these gaps compounded in practice.
- A missing client-side topology refresh setting turned a routine node replacement into a cascading shard failure.
- A flawed autoscaler health check caused a system to fail back to a still-degraded region, extending an otherwise short outage.
- An unmonitored bandwidth metric let a cache instance silently exceed capacity for hours, triggering a retry storm that blocked recovery entirely.
Both teams reached a shared conclusion: failures are inevitable, and a caching tier that assumes “the cache is always up” will eventually prove that assumption wrong. The focus shifted from preventing every failure to two outcomes that move the reliability needle: early detection and rapid, automated recovery.
Building on this, AWS and Intuit designed a controlled failure simulation targeting one of the three Availability Zones hosting Intuit’s Redis clusters, using the AWS FIS action aws:elasticache:replicationgroup-interrupt-az-power to impair every node in the targeted zone.
Two mitigation approaches were evaluated to offset that reduction:
- Scale out in the unaffected AZs. Effective, but dependent on control-plane operations that may themselves be degraded during a real AWS event.
- Static stability. Pre-provision enough capacity in the surviving AZs to absorb the loss of one AZ without any control-plane action. This is the preferred posture, because it removes the control-plane dependency from the recovery path entirely.
Solution: turning root causes into tested guardrails
The team turned each recurring root cause into a specific, testable control, then validated those controls under a real Availability Zone failure.
GameDay scenario: Simulate the loss of a single Availability Zone
In the planned GameDay scenario, Intuit simulated a failure in one of the three AZs where the ElastiCache cluster is deployed, using the AWS FIS action aws:elasticache:replicationgroup-interrupt-az-power to force all nodes in the targeted AZ into an impaired state.
The objective: Confirm that Lettuce clients detect the impairment and automatically redirect retries and new requests to healthy nodes in the unaffected AZs, with no manual intervention.
This test intentionally reduces capacity for normal workloads, a tradeoff the team accepted to validate behavior under real AZ loss. Mitigation comes from either scaling in the unaffected AZs (control-plane dependent) or, preferably, static stability, so recovery has no control-plane dependency at all.
Resiliency checklist for Amazon ElastiCache (validated during GameDay)
Before any fault was injected, every service in scope worked through the Resiliency Checklist for Amazon ElastiCache, a structured set of prerequisites spanning client configuration, cluster architecture, observability, and operational readiness. Each item required evidence, not only a yes or no, and gaps were remediated ahead of the GameDay date. This turned the checklist into a forcing function for fixing known weak points before they could fail under test. The checklist organizes resilience into four areas:
- Client-side configuration – Lettuce version 6.2.2 or later, with
refreshTopologyEnabled=trueso the client closes stale connections and initiates new connections after a failover instead of pinning dead nodes. - Cluster architecture – Cluster mode enabled, multi-AZ on, a minimum of two replicas per shard for redundancy and read scaling, and at least three shards to preserve quorum if one AZ is lost. Encryption enabled both in-transit and at-rest.
- Observability – Amazon CloudWatch alarms on engine CPU and memory (alerting at 65 percent utilization), network bandwidth (sized to each instance type’s baseline and burst limits), current and new connections per AZ, and replication lag, so saturation is caught before it cascades, not after.
- Operational readiness – Infrastructure managed through infrastructure as code (IaC) with drift detection, standardized tagging, connection pooling enforced client-side, and regular failover drills using the ElastiCache
TestFailoverAPI in non-production.
GameDay approach
Intuit’s Safety Engineering and GameDay team, which runs resilience exercises across more than 500 critical cloud-native services, built the scenario and experiment framework from scratch. After determining the root causes, multiple Intuit teams successfully ran an ElastiCache GameDay using AWS FIS to simulate AZ-failure scenarios.
The exercise methodically reproduced historical failure patterns (AZ loss, bandwidth exhaustion, retry storms, failover behavior, and cross-Region synchronization) while validating the preceding checklist controls.
The GameDay itself validated a concrete set of controls drawn directly from prior root-cause analyses:
- Lettuce topology refresh – Adaptive and periodic refresh enabled so the client re-discovers cluster topology after a failover instead of pinning dead nodes.
- Right-sizing – Node types and shard count are sized to survive the loss of one AZ (static stability), not just steady-state load.
- Bandwidth and replication monitoring – CloudWatch alarms on network bandwidth, replication lag, and engine CPU to catch saturation before it cascades.
- Exponential backoff with jitter – Client retry policy tuned to avoid retry storms against impaired nodes.
- Graceful database fallback – Verified that a cache-unreachable condition falls through to the database without crashing downstream services.
Routine workload monitoring across Intuit’s services surfaced a pattern: recurring cache-access disruptions were tracing back to a small set of unresolved root causes in client configuration and supporting infrastructure, not the ElastiCache engine itself. Following this success, the Intuit team expressed strong interest in expanding their FIS capabilities to additional workloads.
Experiment setup
The experiment is deliberately minimal: four resources, one fault action, and a single authoritative timestamp that anchors every measurement in this post.
Create the following resources:
- Create the replication group. Deploy a Multi-AZ Amazon ElastiCache cluster replication group and tag it
fis-testing=yes. The tag gives AWS FIS a reusable target, so you don’t hardcode an Amazon Resource Name (ARN). - Create the CloudWatch log group. Configure Amazon CloudWatch logging with log schema version 2. Two events matter:
action-start– The moment the fault becomes effective. This is T0 for every latency and recovery figure reported in this post.action-end– The moment power is restored and the cluster returns to full capacity.
- Create the AWS Identity and Access Management (IAM) role. Scope an IAM role to the three permissions AWS FIS needs: calling the ElastiCache action, resolving targets by tag, and writing to Amazon CloudWatch Logs.
- Create the experiment template. Add the
aws:elasticache:replicationgroup-interrupt-az-poweraction, set the duration to 5 minutes (PT5M), and target the Availability Zone that currently hosts the primary node. Target the primary’s Availability Zone to force a genuine failover rather than a no-op.
Failover behavior during the experiment
When the action runs, the following happens without your intervention:
- AWS FIS interrupts power to the target Availability Zone.
- ElastiCache promotes the replica with the least replication lag.
- ElastiCache updates the primary endpoint DNS record.
- Your client reconnects, provided it’s configured with topology refresh and exponential backoff.
No configuration change and no manual intervention is required. If you want this resilience without configuring clients at all, Amazon ElastiCache Serverless handles failover transparently behind its managed proxy.
Note: Because the action impairs an entire Availability Zone for the duration of the experiment, run a few practice rounds in a non-production environment before you test in production.
For the full step-by-step build, including IAM policy documents, the experiment template wizard, and a console walkthrough, refer to Resilience testing on Amazon ElastiCache with AWS Fault Injection Service.
Running the experiment
Running the fault is only half the exercise. The value comes from measuring how the application behaved during the fault window. To do that, the team drove the system with a production-level load test and overlaid the FIS fault interval (action-start to action-end) on the application and ElastiCache dashboards. We started the load test to establish a steady-state baseline, and the experiment was started while that load was running.
Success criteria: three key checks
- Connection handling – A resilient client shows only a brief burst of connection errors at failover, then reconnects automatically. A sustained error plateau points to connection-pool or retry misconfiguration.
- Graceful fallback – On cache miss or unreachable cache, requests fall back to the database without overwhelming it. Database query rate should rise temporarily but stay within safe limits.
- Bounded latency – Latency may rise transiently during failover (for example, tens of milliseconds to a few hundred) and should return to baseline once topology settles. Spikes into multiple seconds indicate timeout/retry tuning issues.
With the template created and the IAM role granted both ElastiCache and CloudWatch permissions, you’re ready to inject the fault and observe the system respond. Before running the experiment, verify that sufficient load is generated against the targeted cluster. This ensures the fault produces an observable impact on your metrics and validates the system’s response under realistic conditions.
Baseline ElastiCache metrics under load
Before injecting the fault, the dashboards establish the normal operating band. Capturing this baseline is essential as the experiment proceeds.
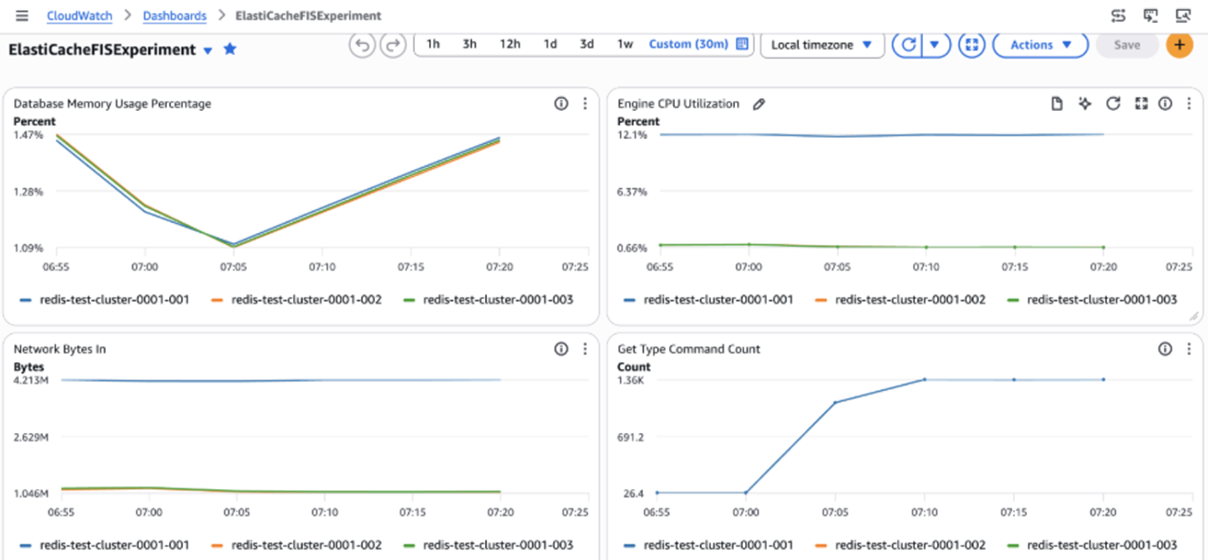
Figure 1: Baseline application and cache metrics before the fault, with steady-state throughput, flat p50/p99 latency, near-zero error rate, and ElastiCache CPU, connections, and bandwidth within range
Figure 1 shows the application under load but pre-fault: request throughput is steady. Error rate sits at or near zero, and p50/p99 latency is flat. On the cache side, engine CPU, current connections, and network bandwidth are all comfortably within range, confirming the cluster has the static-stability headroom to absorb the loss of one AZ.
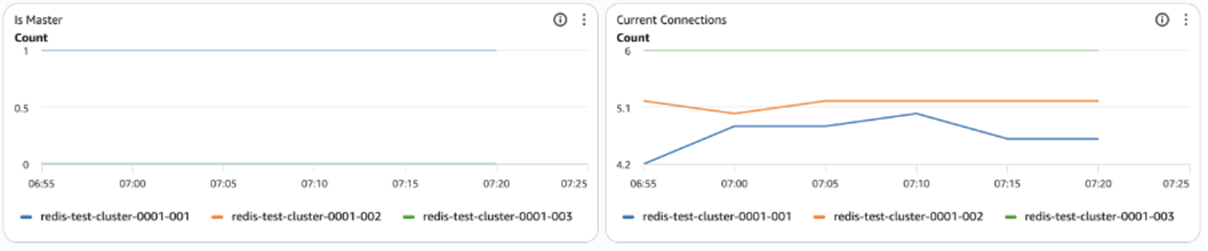
Figure 2: Condensed baseline metrics strip that establishes the normal band failover behavior is measured against
Figure 2 is the condensed baseline strip. It’s the reference band that the fault-window charts are compared against to judge how far, and for how long, the system deviated from normal.
Start the experiment
Open the template in the AWS FIS console and choose Start experiment (top right), then confirm. FIS first resolves the target (the tagged replication group, in the chosen AZ) and then begins the action.
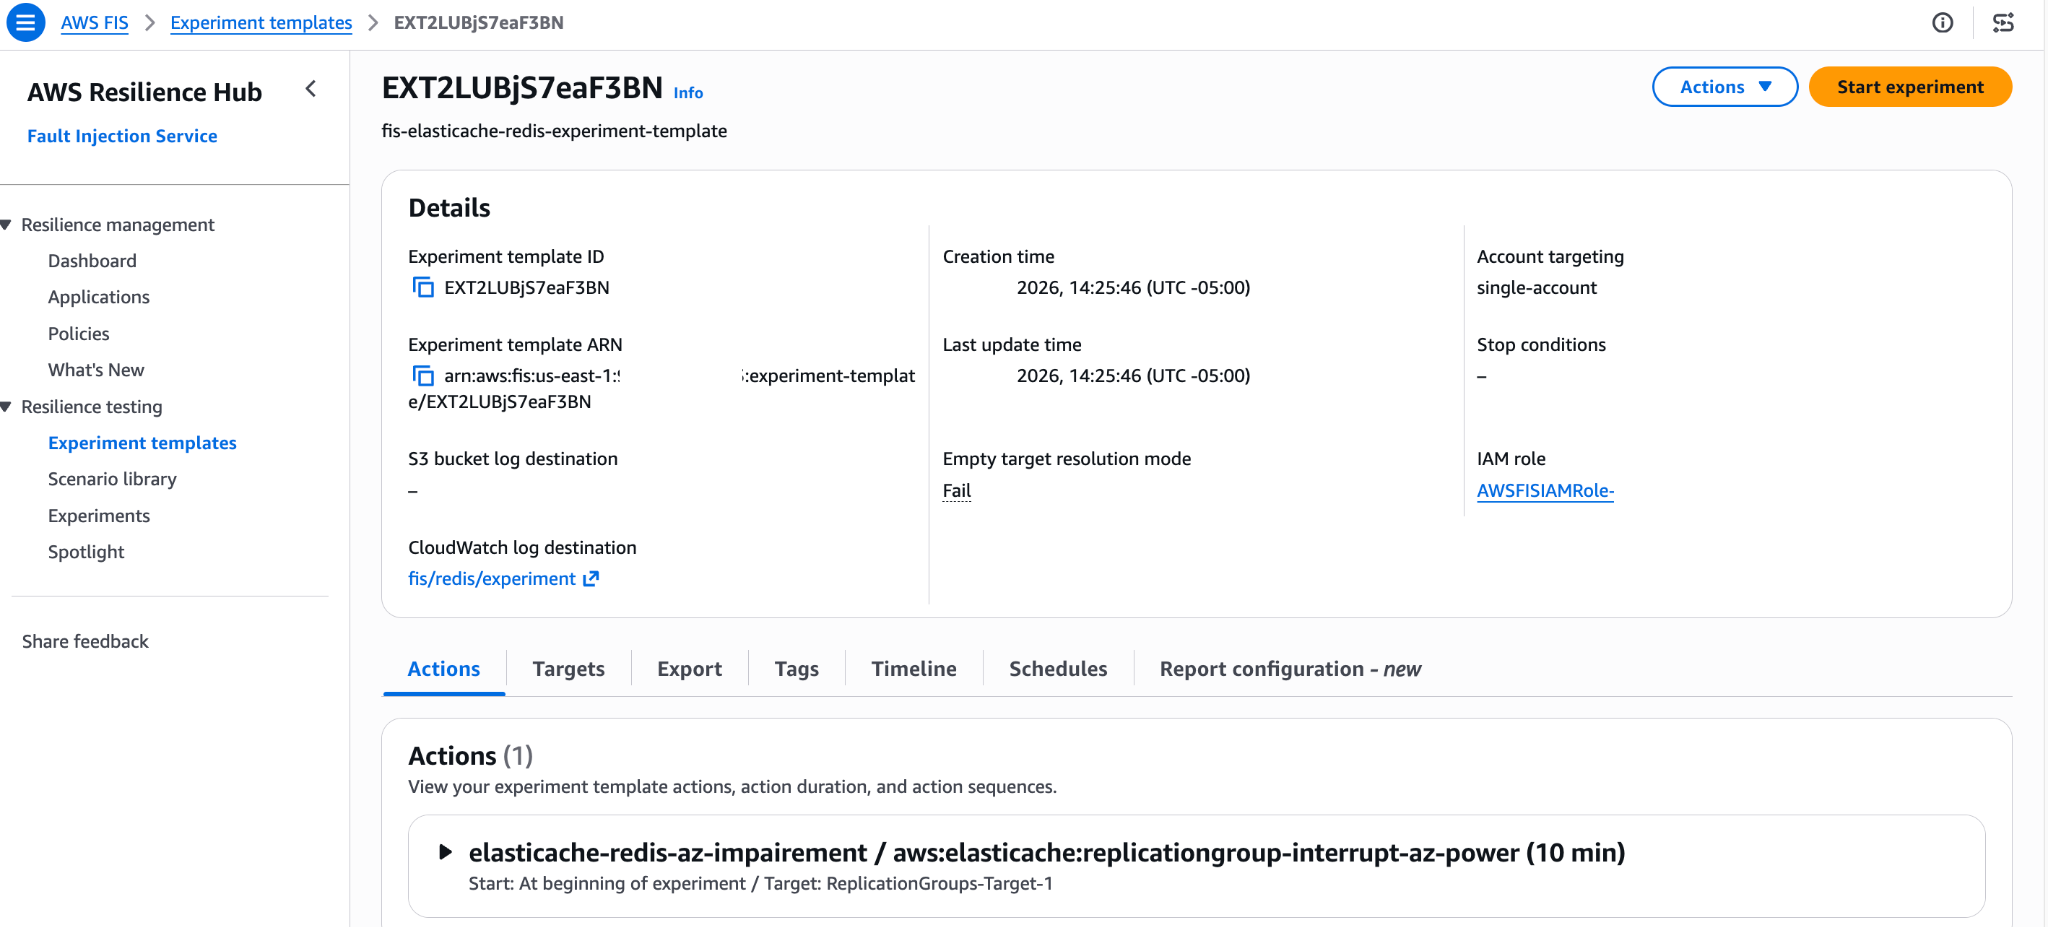
Figure 3: Starting the experiment to launch the Availability Zone power interruption against the tagged replication group
Confirm the experiment is running
The Experiment details page moves to the Running state (Figure 4). From here, follow the CloudWatch log destination link to view the action timeline in real time. Keep this page and your application dashboards open side by side.
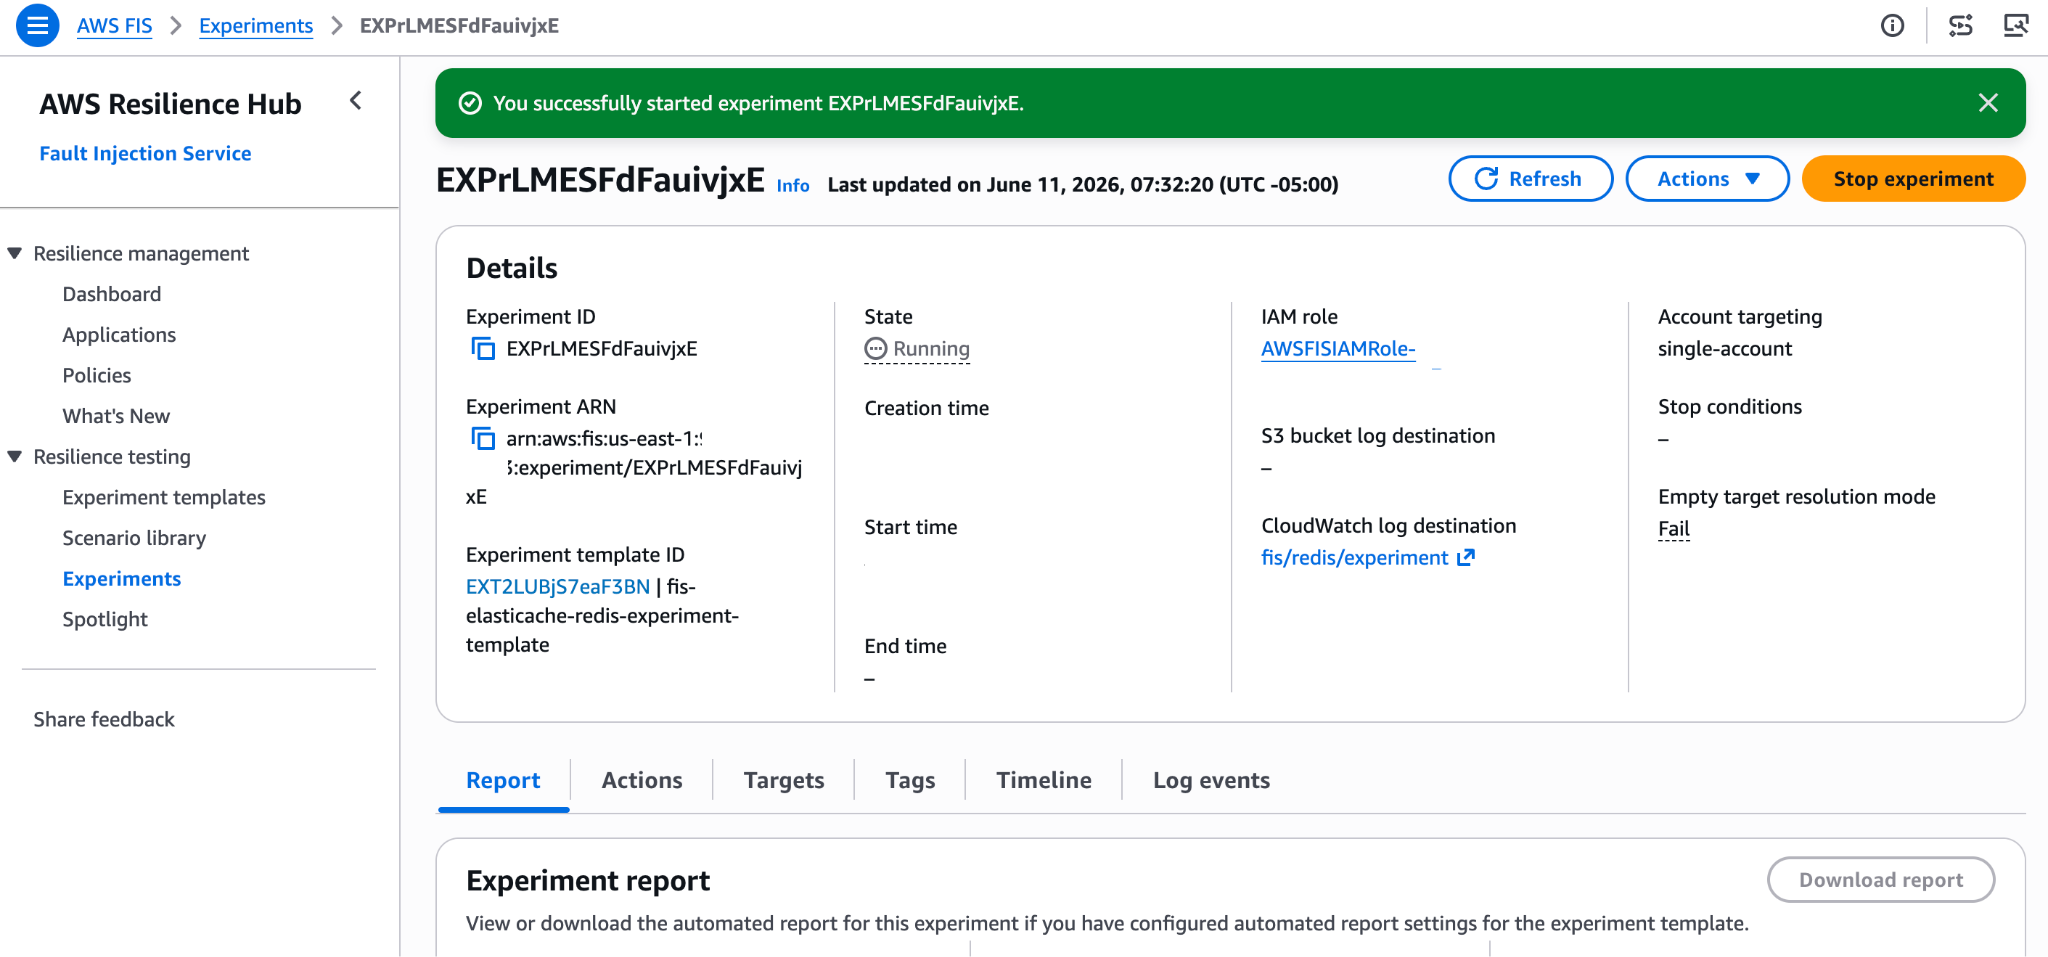
Figure 4: The experiment in the Running state on the AWS FIS experiment details page
Observe the cluster entering failover
Switch to the ElastiCache console. The cluster and the affected nodes move to the Modifying state (Figure 5) as ElastiCache detects the impairment.
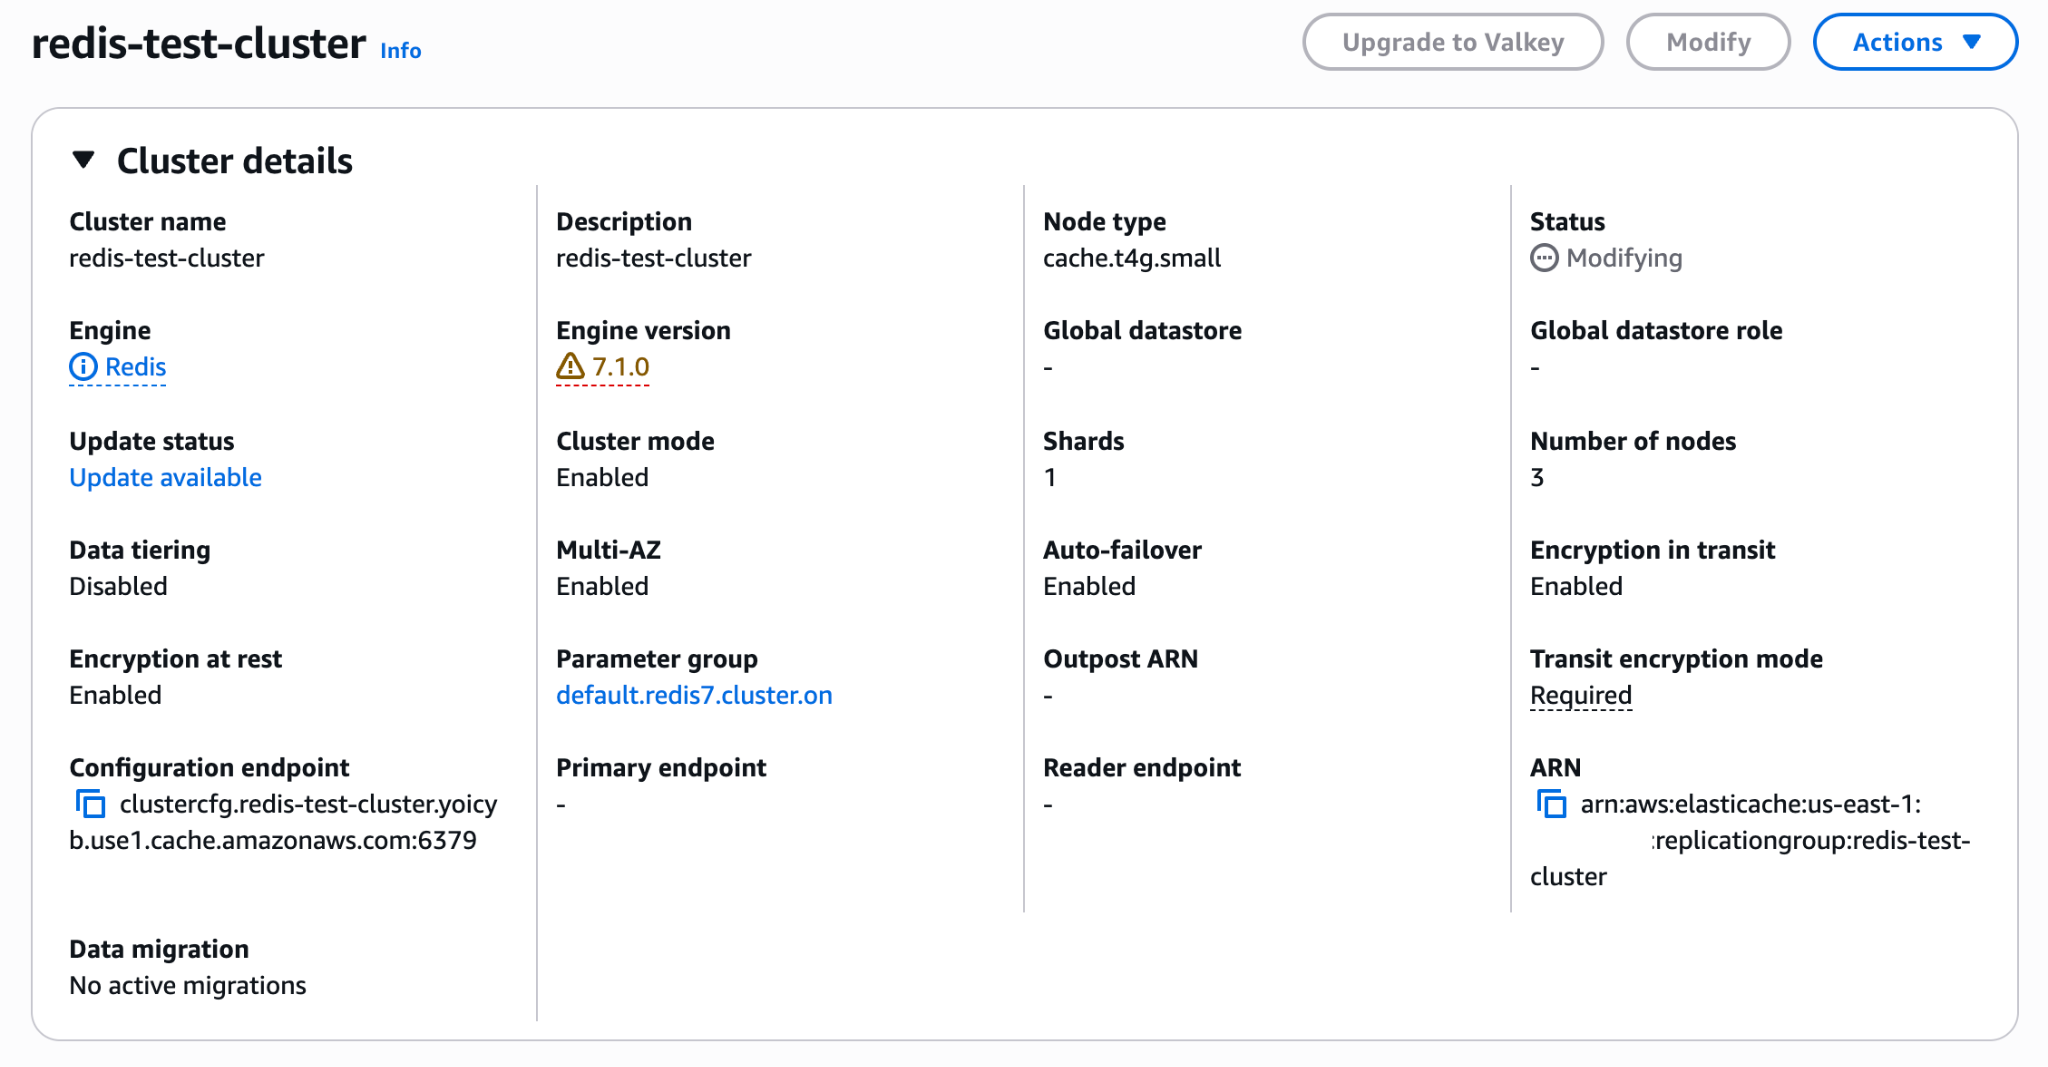
Figure 5: The ElastiCache console showing the cluster in the Modifying state as failover is processed
Verify the node role change
Within seconds, a healthy node in a surviving AZ takes over as the new primary (Figure 6). Because the primary endpoint DNS is updated automatically, clients using the primary endpoint reconnect to the new primary without any configuration change. This is the central behavior the experiment validates.
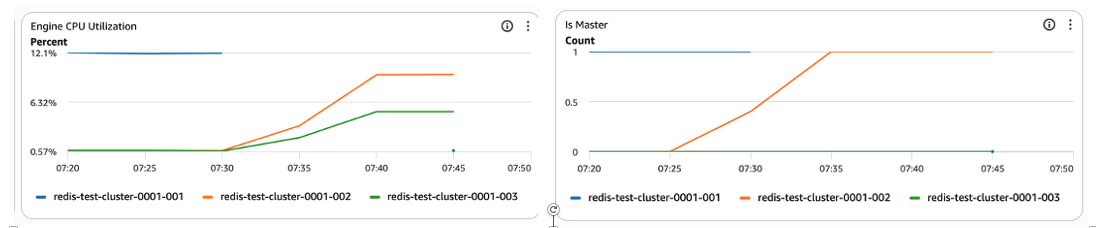
Figure 6: A healthy node in a surviving Availability Zone taking over as the new primary
During and after the AZ impairment experiment
Twenty-five minutes into the load test, the FIS experiment impaired the primary nodes in the targeted Availability Zone. At the moment of impairment there’s a short, contained spike in connection errors as the Lettuce client detects the dead nodes. Because adaptive topology refresh is enabled, the client re-discovers the cluster and reroutes retries and new requests to healthy nodes. Latency rises transiently and then settles back into the baseline band. There’s no sustained error plateau and no manual intervention.
From the ElastiCache perspective, failover and replication re-sync appear as brief transients in connection count and replication lag, while engine CPU and network bandwidth on the surviving-AZ nodes step up to carry the redirected traffic and stay within safe limits. This is exactly what the right-sizing and static-stability checklist item is meant to guarantee.
The cluster and all nodes are back to Available, the originally impaired node has rejoined as a read replica, and the application error rate has returned to zero, all well inside the 5-minute fault window.
Outcome
Validating fault tolerance is the outcome this exercise delivers, and the Resiliency Checklist is how Intuit gets there. The checklist is the most durable output of this exercise, more than any single metric that follows. Every item traces back to a real root cause surfaced through workload monitoring, so completing the checklist proves the datastore withstands each fault the item guards against. The services in scope were the first at Intuit to complete the Resiliency Framework for Amazon ElastiCache end-to-end. Their results now serve as the metrics-backed reference for the success criteria across Intuit’s caching infrastructure. This isn’t a retrospective on what was fixed. It’s the benchmark any team onboarding a new datastore can measure itself against. The checklist is now published centrally and linked from runbooks, launch checklists, and architecture templates. This turns one team’s GameDay investment into an enterprise-wide reliability standard.
GameDay results summary: The before and after
By simulating the exact failure scenarios that previously caused outages, we confirmed that the architectural fixes transformed structural fragility into automated resilience.
- Recovery time (mean time to recovery, or MTTR): approximately 95 percent faster. Reduced from a historical average of tens of minutes to under 2 minutes (system auto-recovered).
- Customer impact: approximately 96 percent reduction, blast radius contained. Reduced from measurable service degradation across critical services to a 0 percent impact with production-level load.
- Operational load during failover: approximately 93 percent reduction. AZ failures that previously required manual escalation and intervention now resolve automatically through self-healing.
- Error rate during failover: contained to a brief, bounded window. Connection errors lasted roughly 60 seconds during topology refresh, with no sustained error plateau and no customer-visible impact beyond the failover window.
- Time to detect (TTD): approximately 75 percent faster. Reduced from 10+ minutes, sometimes hours with no automated detection, to approximately 3 minutes with alert-driven auto-recovery.
- Incident recurrence reduction: Achieved a 90 percent or greater reduction in repeat incidents with the same root cause, and 0 repeat incidents once remediation and the resiliency checklist are complete.
Key wins
- Conquered the topology failure mode. We verified that the Lettuce client topology refresh fix works under pressure. In previous incidents, clients kept trying to connect to dead nodes, causing retry storms. During GameDay, traffic was automatically rerouted to healthy nodes within 60 seconds.
- Created a scalable resiliency standard. Beyond fixing these specific services, we codified the learnings into a Resiliency Checklist for Amazon ElastiCache. This artifact is now available to apply to all new and existing datastores, serving as a preventative lever for the entire organization.
- Validated fallback mechanisms. We confirmed that even under stress, if the cache becomes unreachable, requests fall back to the database without crashing downstream services, ensuring business continuity.
Conclusion
“We stopped trying to prevent every failure and started proving recovery. This exercise turned a year of monitoring signals into a checklist any team at Intuit can run.”
— Brendan Byrne, Director of Cloud Engineering & Operations, Intuit
In this post, we showed how routine workload monitoring surfaced a recurring pattern of cache-access disruptions at Intuit, and how a systematic collaboration between Intuit’s Safety Engineering team and AWS architects turned that pattern into a tested, reusable fix. Using the AWS FIS action, we ran an Availability Zone impairment experiment at production-level load. Lettuce topology refresh, exponential backoff with jitter, and static stability across zones carried the recovery. This led to recovery time dropping from over 50 minutes to under 2 minutes with no manual intervention, and customer degradation for critical services falling to effectively zero.
The next phase is already underway: Intuit is building AI-driven systems that plan, execute, and analyze GameDays autonomously, turning resilience testing from a scheduled exercise into a continuous capability. The checklist validated here becomes machine-executable policy.