AWS Database Blog
Improve RDS Proxy multiplexing for PostgreSQL, Part 1: Common causes
After you enable Amazon Relational Database Service (Amazon RDS) Proxy in front of Amazon Aurora PostgreSQL-Compatible Edition or Amazon RDS for PostgreSQL, you might find that the number of connections to your database stays the same or even increases. This is unexpected and undesirable. Connection pooling is one of the proxy’s main benefits, allowing a small number of backend database connections to serve many client connections. The cause is usually how client applications manage their connections. Certain client behaviors prevent the proxy from reusing backend connections, so it’s forced to pass each client connection through to the database one-for-one, eliminating multiplexing and greatly reducing proxy benefits.
In this post, we show the common conditions that impede healthy multiplexing in RDS Proxy for Amazon Aurora PostgreSQL and RDS for PostgreSQL. We focus on the behavior of Java and Python applications and on how specific frameworks and configurations reduce connection reuse. These conditions fall into three categories: connection pinning, pool fragmentation, and connections held by uncommitted transactions. Each has a different root cause, but all produce the same symptom: more backend connections than expected and higher load on the database.
This is Part 1 of a two-part series. In this post, for each condition we explain why it happens, how to confirm it using Amazon CloudWatch metrics, and the configuration change that restores multiplexing. In Part 2, we show how to use CloudWatch Logs Insights to further diagnose and find the root cause when metrics alone are ambiguous, what healthy multiplexing looks like in metrics and logs, and how to set up alarms that catch regression.
The Java examples in this post use Apache Spark, and the Python examples use psycopg2 and psycopg (v3). However, the JDBC driver pinning behavior and pool fragmentation mechanics apply to any application that connects to PostgreSQL through RDS Proxy, including Java services, Spring Boot applications, and any framework that uses the PostgreSQL JDBC driver.
This series applies to RDS Proxy for both Aurora PostgreSQL and RDS for PostgreSQL. We ran our tests on Aurora PostgreSQL, but the behaviors we describe are properties of how RDS Proxy handles PostgreSQL connections, so the same analysis applies to both.
How RDS Proxy multiplexes connections
RDS Proxy maintains a pool of backend database connections and shares them across client connections. This works because not all clients are active at the same time. Each client typically uses a connection briefly to execute a query or a set of queries, then goes idle while the application processes results, waits for user input, or sleeps between operations. During these idle periods, the proxy can lend that backend connection to other clients who need to execute their own queries.
The proxy decides when to borrow and return connections based on transaction boundaries. When a client begins a transaction, the proxy assigns it a backend connection from the pool. When that transaction completes (commit or rollback), the proxy returns the connection to the pool for reuse. In autocommit mode, each statement is its own transaction, so the connection is returned after each statement.
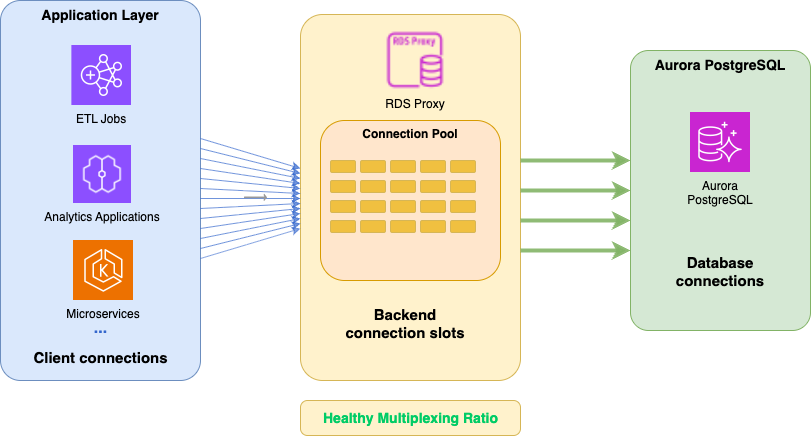
Figure 1: RDS Proxy connection multiplexing architecture
Figure 1 illustrates this architecture. On the left, hundreds of client connections from Amazon EMR Spark executors and Python applications connect to RDS Proxy. The proxy maintains a small pool of database connections (backend connections) to Aurora PostgreSQL and shares them across all clients. When multiplexing is working effectively, the proxy opens far fewer database connections than it accepts from clients.
Reusing backend database connections across clients is important because database connections are a limited resource. Every open connection consumes database resources, such as memory and CPU, whether that connection is active or idle. PostgreSQL limits the total number of connections through the max_connections parameter, which Aurora PostgreSQL and RDS for PostgreSQL derive from the instance’s available memory by default. When this limit is reached, new connections are rejected. RDS Proxy helps by serving many clients with fewer backend connections, but only when multiplexing is working effectively.
Four proxy settings control the connection pool, and the first two size it (see Configuring connection settings for all of them):
- MaxConnectionsPercent – The maximum number of backend connections the proxy can open, as a percentage of the database’s
max_connections. This caps how much of the database’s connection capacity the proxy will use. - MaxIdleConnectionsPercent – The maximum idle connections the proxy retains in the pool expressed as a percentage of the
max_connectionssetting for the RDS DB instance target group. These are pre-warmed connections ready to be assigned immediately when a client needs one, avoiding the latency of establishing a new backend connection on demand. - ConnectionBorrowTimeout – How long the proxy waits for a backend connection to become available before it returns a timeout error. This matters when the pool is exhausted, for example when pinned connections hold every backend connection.
- IdleClientTimeout – How long a client connection can be idle before the proxy closes it. Lowering it removes stale client connections sooner.
Amazon RDS Proxy takes a safe approach to connection reuse. As described in the RDS Proxy concepts documentation, if the proxy can’t be certain that a connection is safe to reuse outside of the current session (because the session has established state that other clients should not inherit), it keeps the session on the same backend connection until the session ends. This conservative behavior is why pinning, fragmentation, and uncommitted transactions reduce multiplexing: each one puts the session into a state that prevents the proxy from reusing connections across clients.
Prerequisites for diagnosing
Before we look at each condition in detail, it helps to have the right visibility in place. The following items let you detect reduced multiplexing and tell which condition is responsible. Part 2 covers the additional logging that you need for connection-level root-cause analysis.
- An Aurora PostgreSQL cluster or RDS for PostgreSQL instance with an RDS Proxy – If you don’t have a proxy yet, see Creating a proxy for Amazon Aurora or Creating a proxy for Amazon RDS.
- AWS Identity and Access Management (IAM) permissions – Permissions to view CloudWatch metrics and read the proxy’s log group. To apply the changes in this post, you also need rds:ModifyDBProxyTargetGroup (pool settings and InitQuery) and rds:ModifyDBProxy (for example, the idle client timeout).
- Driver and version – Know which database driver and driver version your client applications use. The driver version is a client-side artifact, so check your application’s dependency manifest (for example, the postgresql entry in your Maven
pom.xmlor sbt build) rather than querying the database. - CloudWatch metrics – RDS Proxy publishes connection metrics to Amazon CloudWatch under the AWS/RDS namespace at 1-minute intervals, with no configuration required. The key metrics are ClientConnections (client connections to the proxy), DatabaseConnections (backend connections), DatabaseConnectionsCurrentlyBorrowed (backend connections currently in use by a client), DatabaseConnectionsCurrentlySessionPinned (backend connections currently pinned), and DatabaseConnectionsCurrentlyInTransaction (backend connections currently in an open transaction). We use these metrics to diagnose the presence of each condition that prevents connection reuse. For the full list of the metrics emitted by RDS Proxy, see the RDS Proxy monitoring documentation.
- CloudWatch Proxy logs (standard logging) – Make sure you can read the CloudWatch Logs log group for your proxy. Standard logging, which is on by default, captures client connections, disconnections, and pinning warnings, including a tokenized digest of the SQL that triggered pinning. You don’t need enhanced logging to detect pinning. Note, storing and querying logs in CloudWatch Logs incurs standard CloudWatch Logs charges.
Condition 1: Connection pinning from SET statements
Connection pinning is the most common reason for reduced multiplexing. When the proxy detects a session state change that isn’t appropriate for other sessions, such as a SET command, it pins the client to a specific backend connection for the remainder of the session. After pinned, that backend connection isn’t reused by other clients until the client session ends.
For some database engines (MariaDB, MySQL, SQL Server), RDS Proxy provides a session pinning filter. This setting instructs the proxy to ignore all SET operations and doesn’t pin connections when they occur (see Initialization queries and pinning filters in the Amazon Aurora configuration guidelines). However, for PostgreSQL targets (Aurora PostgreSQL and RDS for PostgreSQL) this filter is not currently supported, and SET commands cause pinning. For PostgreSQL workloads, the way to reduce pinning from SET statements is to minimize the SET statements themselves. Note that SET isn’t the only operation that can cause pinning. For a full list, see Conditions that cause pinning for PostgreSQL in the RDS Proxy documentation.
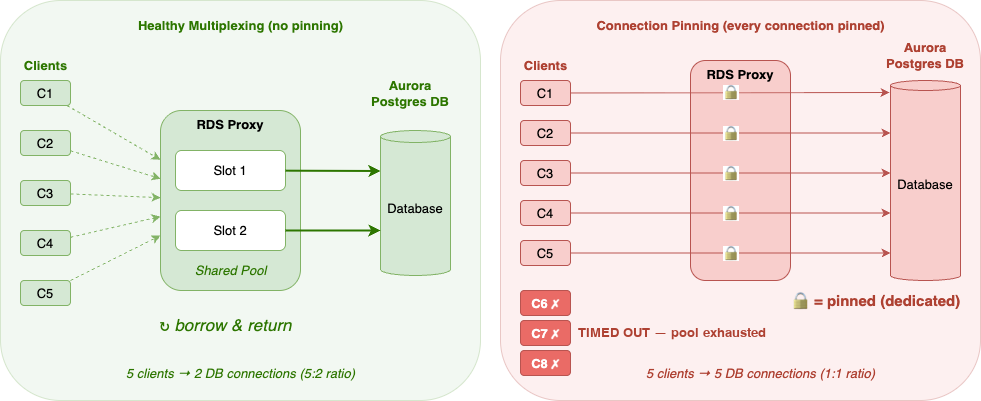
Figure 2: Healthy multiplexing compared to pinned connections
Figure 2 shows the difference between healthy multiplexing and connection pinning. On the left, clients share a small number of backend connections. The proxy borrows and returns connections as clients complete their work. On the right, every client is pinned to its own backend connection and can’t use multiplexing. When the pool is exhausted, additional clients wait for a backend connection and receive a timeout error if none becomes available within the ConnectionBorrowTimeout period.
Why it happens
Pinning in Java and Python applications usually comes from one of three places: the database driver, a framework that sets session options for you, or your own application code. We start with the JDBC driver, because it can pin every connection before your application runs a single query.
The PostgreSQL JDBC driver – In earlier versions of the PostgreSQL JDBC driver (42.2.x or older), the driver automatically sends SET commands during connection setup, without any application code requesting it. The driver sends a startup packet, then issues SQL SET statements to configure extra_float_digits and application_name:
Every connection through the proxy gets pinned before the application even runs its first query. This behavior changed over several iterations of the driver and has been corrected in version 42.7.x and newer, where all parameters are included in the startup packet, which the proxy treats as connection negotiation rather than a session state change:
Spark DataFrame JDBC writes – Customers running Amazon EMR jobs that write data through RDS Proxy encounter a second source of pinning. Spark’s DataFrame JDBC writer (df.write.format("jdbc")) defaults to isolationLevel=READ_UNCOMMITTED, so before every write operation it issues SET SESSION CHARACTERISTICS AS TRANSACTION ISOLATION LEVEL READ UNCOMMITTED. This is a SQL SET statement, and it triggers pinning.
Python psycopg drivers – psycopg2 and psycopg (v3) don’t cause pinning on their own. They don’t send SET statements during connection setup. Pinning only occurs if application code explicitly issues a SET:
How to diagnose it
You can usually confirm pinning without leaving CloudWatch, and the proxy logs then point you to the statement responsible. Start with the metrics.
In CloudWatch metrics, pinning shows up as DatabaseConnectionsCurrentlySessionPinned elevated relative to your baseline. Some pinning is normal (administrative connections, monitoring tools). Investigate when pinned connections represent a significant fraction of DatabaseConnections.
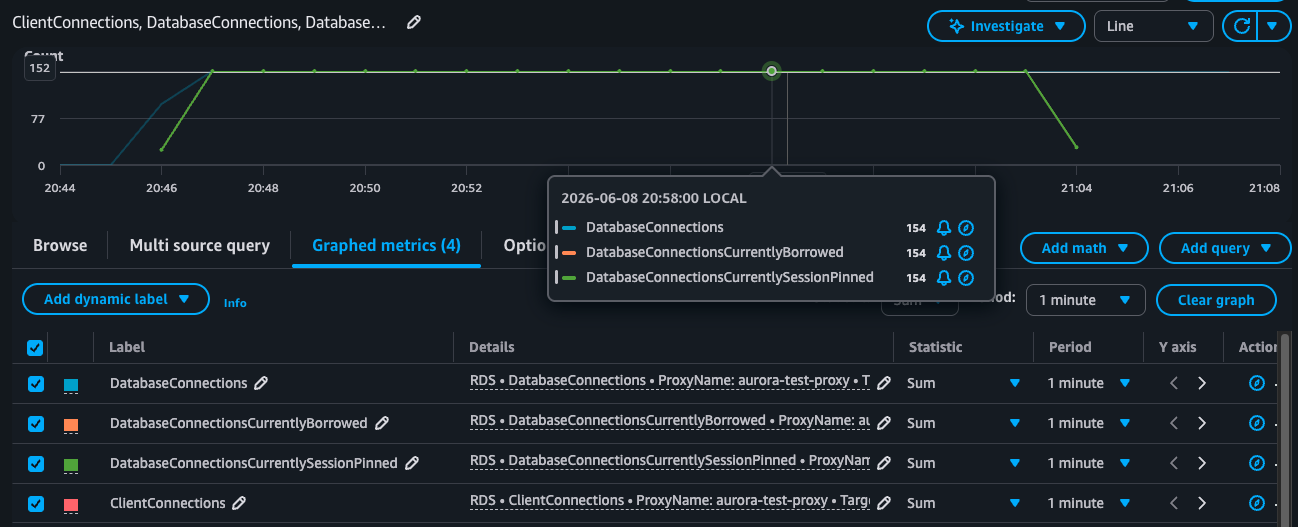
Figure 3: CloudWatch graph that demonstrates pinned connections
Figure 3 shows a workload in which pinning is widespread. DatabaseConnections, DatabaseConnectionsCurrentlyBorrowed, and DatabaseConnectionsCurrentlySessionPinned converge at the same level (154 in the tooltip), meaning each backend connection is held by one client for the length of its session. The proxy provides little multiplexing benefit in this state. Not all pinning is avoidable. The goal is to minimize unnecessary pinning so that the majority of connections benefit from multiplexing.
In proxy logs, pinning warnings appear in standard logging (no enhanced logging required) and include a digest of the SQL statement that triggered pinning. This digest is usually the quickest way to confirm pinning and identify the offending statement. For a deeper, connection-level view, Part 2 shows how to use CloudWatch Logs Insights with enhanced logging to see pinned connections, where the pinned count equals the borrow count for each connection.
How to resolve it
Pinning usually has the largest effect on multiplexing, so we recommend fixing it before you look at the other two conditions. The right fix depends on where the SET statement comes from, so match each of the following changes to the source that you identified in the previous steps:
- Upgrade the PostgreSQL JDBC driver to version 42.7.x or newer. This removes pinning from driver initialization without changing application code.
- For older JDBC drivers, add assumeMinServerVersion=9.0 to the JDBC URL or connection properties. This suppresses both
SET extra_float_digitsandSET application_nameby including them in the startup packet instead (see Minimizing pinning). It is safe with any PostgreSQL server version 9.0 or newer, which includes all currently supported Aurora PostgreSQL versions. - For Spark DataFrame writes, add .option(“isolationLevel”, “NONE”) as a Spark write option. By default, Spark sends
SET SESSION CHARACTERISTICS AS TRANSACTION ISOLATION LEVEL READ UNCOMMITTEDbefore each write. PostgreSQL has no distinct READ UNCOMMITTED level and runs it as READ COMMITTED, so READ COMMITTED is the level you were already getting. With NONE, Spark sends no SET at all, and PostgreSQL uses its default of READ COMMITTED. This is the same effective level, with the pinning-causing statement gone. Note that isolationLevel is a Spark option, not a JDBC driver parameter. Placing it in the JDBC URL has no effect. - Remove explicit SET statements from application code. Use schema-qualified table names instead of
SET search_path, and pass ApplicationName as a connection property instead of a SET command. - Use the proxy’s InitQuery setting for session defaults you need on every connection. InitQuery is a proxy-level option that runs initialization SQL (such as
SET search_path) on every new backend connection without triggering pinning, because every pooled connection runs the same initialization SQL and therefore shares the same state (see Initialization queries and pinning filters).
Condition 2: Pool fragmentation from connection identity differences
Even after you resolve pinning, you might find that the proxy is still opening more backend connections than expected. A common reason is pool fragmentation.
Why it happens
To understand fragmentation, it helps to know how the proxy decides which clients can share a backend connection. It doesn’t treat the pool as one large group.
For PostgreSQL targets, RDS Proxy partitions its backend connection pool by the combination of three values from the client’s startup packet: username, database, and ApplicationName. Clients that differ in any of these three values are placed in separate pool partitions. Connections in one partition aren’t shared with clients in another, even if they are idle. This means the proxy might maintain idle backend connections in some partitions while opening new connections for others, because no idle connection exists in the partition the current client needs.
Common causes:
- Different database users – When an organization uses separate database users for different workloads (for example, python_user for a Python service and spark_user for Amazon EMR jobs), RDS Proxy creates a separate pool partition for each user. Even though both users connect to the same database through the same proxy, their backend connections are never shared.
- Different ApplicationName values – This is equally common in Amazon EMR environments. When each Spark job appends its job name to the JDBC URL (ApplicationName=Job1, ApplicationName=Job2), or a framework automatically sets ApplicationName per instance, each unique value creates a separate partition. Python applications using psycopg2 or psycopg (v3) that don’t set ApplicationName at all default to an empty value. This empty value is yet another partition, separate from Java/Scala clients that do set it.
- Different database names – While less common, some organizations use multiple databases when schemas would suffice. If you have multiple databases on the same cluster, verify the separation is necessary. Consolidating into a single database with separate schemas can reduce fragmentation without sacrificing isolation.
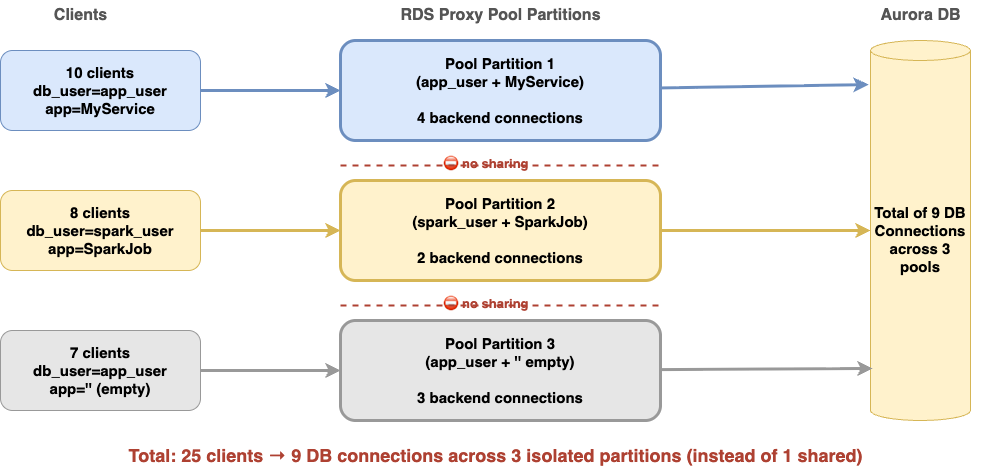
Figure 4: RDS Proxy pool fragmentation
Figure 4 shows how different connection identities fragment the pool. Twenty-five clients connect through the same proxy, but because they differ in database user or ApplicationName, the proxy places them in three separate partitions that don’t share connections. Ten clients using app_user and MyService use four backend connections, eight clients using spark_user and SparkJob use 2, and seven clients using app_user with an empty ApplicationName use 3. That’s nine backend connections in total, and an idle connection in one partition can’t serve a client in another. Note the first and third partitions: both use the same database user, app_user, yet the proxy keeps them apart only because their ApplicationName differs. A difference in ApplicationName alone is enough to split clients into separate pools. Standardizing connection identity would let these clients share a single pool.
Fragmentation also compounds across proxy nodes. For high availability and to scale connection handling capacity, RDS Proxy runs on multiple internal nodes across Availability Zones, and each node maintains its own set of pool partitions. You have no control over which node a client connection lands on, so be aware that this multiplies the minimum number of backend connections the proxy maintains.
How to diagnose it
Fragmentation is harder to spot than pinning, because no single connection looks wrong. The signal is in how the pool as a whole is sized relative to the work being done.
In CloudWatch metrics, possible fragmentation shows up as DatabaseConnections remaining high even when DatabaseConnectionsCurrentlyBorrowed is low and DatabaseConnectionsCurrentlySessionPinned is low or zero. This pattern of many idle backend connections with relatively little pinning can indicate that the proxy is maintaining separate pool partitions that don’t share connections.
We explore this further in Part 2, which explains how to identify the users or applications that fragment the pool.
How to resolve it
The goal is to have every client that can share backend connections land in the same pool partition. Because the partition is defined by username, database, and ApplicationName, the fix is to make those three values match across the clients that should share a pool. Apply the following changes:
- Consolidate database users where possible. Each distinct username creates a separate pool partition, even if all other parameters match.
- Standardize ApplicationName across all jobs and services that should share a pool. Use one name per service, not per job or per instance.
- For JDBC clients:
For Python drivers, set application_name explicitly to match (psycopg2 and psycopg v3 default to empty, creating a separate partition):
Condition 3: Uncommitted transactions holding connections
Unlike the first two conditions, which come from how the proxy manages connections, this one starts with how the client application manages transactions. The effect is similar to temporary pinning: a backend connection stays tied to one client until its transaction is committed or rolled back.
Why it happens
This condition is less obvious than pinning but can be equally impactful. RDS Proxy uses the transaction as its unit of connection reuse: it borrows a backend connection when a transaction begins and returns it to the pool when the transaction ends. If a transaction remains open for an extended period, the backend connection remains borrowed until the transaction completes (or until the proxy closes the connection on reaching the maximum client connection lifetime. See RDS Proxy connection considerations).
This condition frequently occurs in Python applications using psycopg2 or psycopg (v3) with autocommit=False, which is the default. When autocommit is off, the driver implicitly begins a transaction on the first statement. This happens whether that statement is a SELECT or an INSERT. The proxy borrows a backend connection when the transaction starts and holds it until the transaction is committed or rolled back. If the application runs a query and then goes idle without committing (for example, sleeping between batches or waiting for the next request), the backend connection remains borrowed the entire time, and other clients can’t use it.
If the client disconnects without committing, the proxy closes the backend connection rather than returning it to the pool. The proxy logs this as: “The database connection closed. Reason: The client connection that borrowed this database connection from the connection pool was closed in the middle of a transaction.” This requires the proxy to open a new backend connection or borrow an existing idle one for subsequent clients. That is a more expensive outcome than pinning, where the connection is at least returned to the pool after the client disconnects. The proxy doesn’t distinguish between read and write queries. What matters is the transaction state.
How to diagnose it
Uncommitted transactions are easiest to recognize by contrast with a healthy proxy. When transactions are short, a backend connection is borrowed and returned in a fraction of a second. Short borrow/release cycles like these aren’t always registered in the metrics, so you often see low numbers (sometimes even zero) for DatabaseConnectionsCurrentlyBorrowed and DatabaseConnectionsCurrentlyInTransaction. That is the healthy case: the proxy is reusing connections so quickly that few are in use at any sampled moment.
Uncommitted transactions look different. DatabaseConnectionsCurrentlyBorrowed and DatabaseConnectionsCurrentlyInTransaction are both elevated and sustained, because a connection held open for minutes is in use across the sampling and shows up in the reported values. When the pool is saturated, both approach DatabaseConnections. The pattern is most telling when it persists while your clients are idle or issuing few queries. Keep in mind that longer-running queries also keep connections in use: the 10-second queries in our tests register in the metrics even without any uncommitted transaction, so judge the numbers against what your workload normally does.
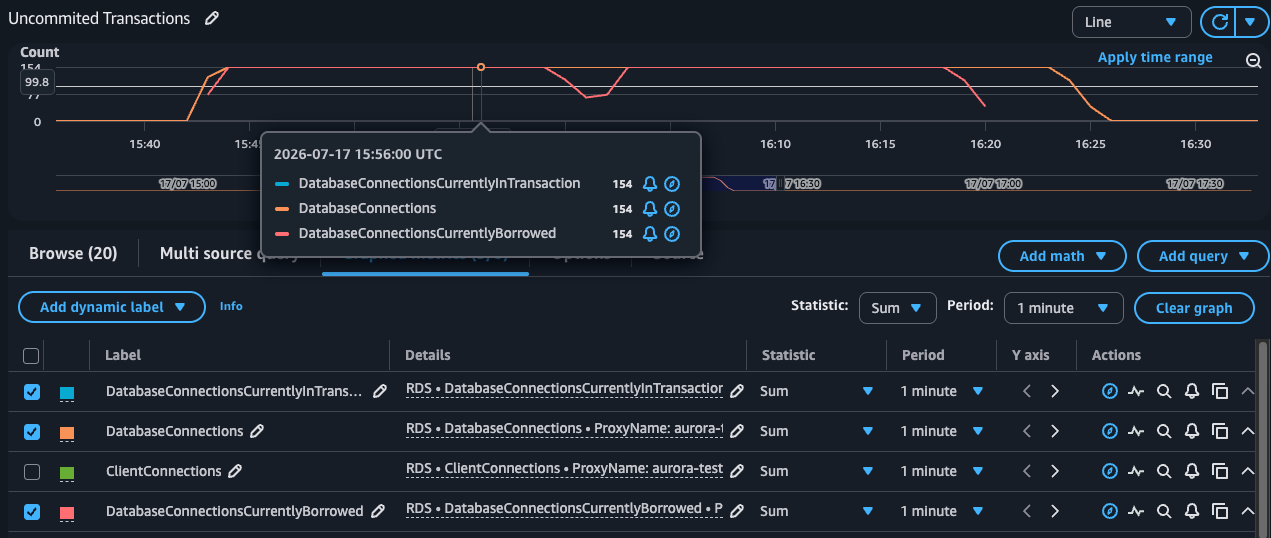
Figure 5: CloudWatch graph that demonstrates uncommitted transactions
Figure 5 shows this pattern for a workload that issues no SET statements but leaves its transactions open. DatabaseConnections, DatabaseConnectionsCurrentlyBorrowed, and DatabaseConnectionsCurrentlyInTransaction rise together to the same level (154 in the tooltip) and stay there. Because the workload never pins, open transactions are holding the backend connections, which is the key diagnostic difference from Condition 1. Add DatabaseConnectionsCurrentlySessionPinned to your own graph to confirm that it stays low. You can also search the proxy logs for the “closed in the middle of a transaction” message to see how often clients are disconnecting with open transactions.
How to resolve it
The fix is to end each transaction as soon as the work is done, so the proxy can return the backend connection to the pool for other clients. Apply the following changes:
- Commit after each unit of work when using
autocommit=False– This releases the backend connection promptly. - Consider
autocommit=Truefor applications that don’t need explicit transaction control. - Avoid long idle periods between a query and its commit – The backend connection remains borrowed the entire time.
The following Python example shows the difference. The first block holds a transaction open while the application sleeps, and the other two release the backend connection:
Comparing pinned and healthy workloads
To see how much these conditions matter, we ran the same Python workload twice against an Aurora PostgreSQL 16.11 cluster. Every 10 seconds for 15 minutes, 25 new client connections each ran a 10-second query and then held their connection open for 2 minutes, for about 2,250 connections in total. The proxy’s MaxConnectionsPercent was set to 8 percent. In the first run, each connection issued SET search_path before its queries. In the second run, it didn’t.
In the first run in Figure 3 we presented earlier, DatabaseConnections climbed to 154, and every one of those backend connections was borrowed and pinned. The proxy reached its pool limit, and some clients timed out waiting for a backend connection. In the second run (Figure 6), the proxy served a steady state of 325 concurrent client connections with about 59 backend connections, of which about 25 were borrowed at a time. That is roughly 5.5 client connections for each backend connection.
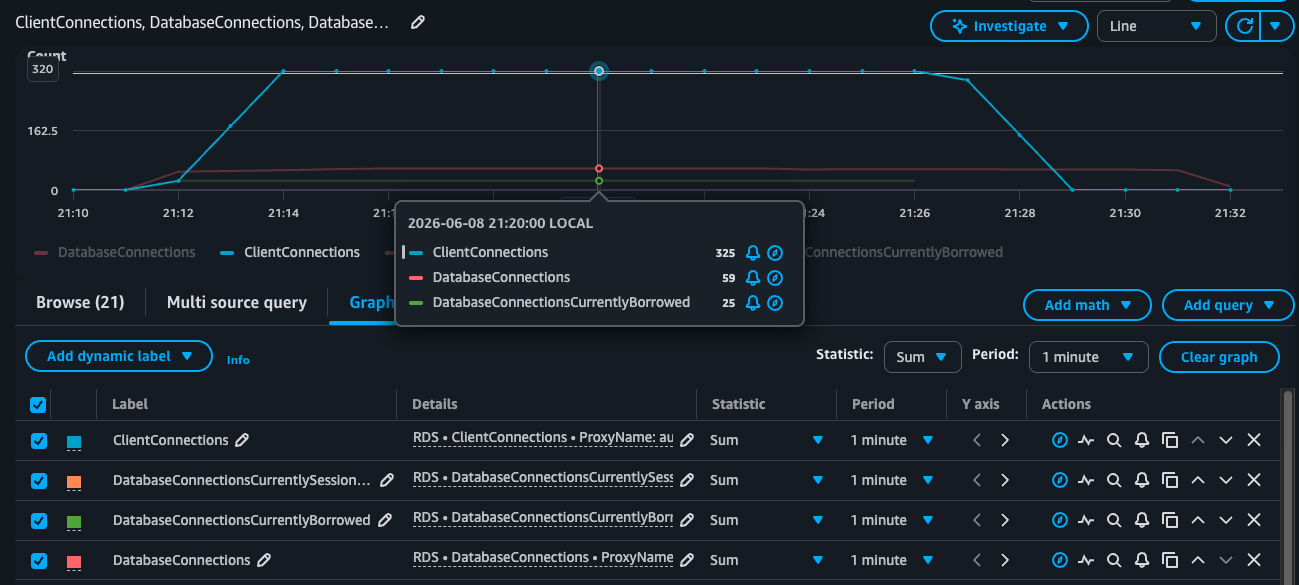
Figure 6: CloudWatch graph for healthy multiplexing
Figure 6 shows the second run. ClientConnections holds at 325 while DatabaseConnections stays near 59. The gap between the two is the multiplexing benefit. Your results will differ with query duration, connection hold time, and concurrency.
Considerations and limitations
The techniques in this post apply to most PostgreSQL workloads, but a few constraints are worth knowing before you roll out changes. Keep the following in mind:
- The session pinning filter is not available for PostgreSQL targets (Aurora PostgreSQL and RDS for PostgreSQL). On MySQL, MariaDB, and SQL Server targets, you can configure the proxy to ignore SET statements. On PostgreSQL, the only way to avoid pinning from a SET is to prevent the statement from being sent.
- Pool fragmentation is multiplied across proxy nodes. For high availability, RDS Proxy runs on multiple internal nodes across Availability Zones, and each node maintains its own pool partitions. The number of nodes is managed by the service and is not something you control directly, so factor this in when reasoning about total backend connections.
- Consolidating database users has security trade-offs. Separate database users are often how teams enforce least privilege and keep per-user audit trails, so they aren’t always safe to merge. Only consolidate users that genuinely share the same privilege and audit requirements. Never merge users to improve multiplexing if doing so would grant a workload broader database access than it needs. When users must stay separate, standardizing ApplicationName within each user is the safer first step and still reduces fragmentation within that user’s partition.
- Several CloudWatch metrics, including DatabaseConnectionsCurrentlyBorrowed, are point-in-time gauges sampled during that minute. Short borrow-and-release cycles that complete between samples aren’t fully captured, so treat these metrics as indicators of sustained state rather than exact per-second counts.
- Some pinning is unavoidable and expected. Administrative tools, monitoring agents, and certain session-scoped operations legitimately pin connections. The goal is to minimize pinning caused by drivers and frameworks, not to drive the pinned count to zero.
Related posts
- Understanding the differences between PgBouncer and Amazon RDS Proxy for PostgreSQL connection pooling – Compares the two PostgreSQL connection poolers, including how each handles transaction-level multiplexing and pinning. Read it if you are still deciding which pooler fits your workload, then return here to tune RDS Proxy.
- Improving application availability with Amazon RDS Proxy – Background on how RDS Proxy provides connection pooling, multiplexing, and faster failover recovery.
- Improve RDS Proxy multiplexing for PostgreSQL, Part 2: Diagnose and monitor – The second post in this series, covering CloudWatch Logs Insights root-cause analysis and regression alarms.
Conclusion
In this post, you learned how connection pinning, pool fragmentation, and uncommitted transactions prevent RDS Proxy from multiplexing connections effectively, how to confirm each one with CloudWatch metrics, and how to apply targeted fixes.
The key takeaway: eliminate SET statements first, commit transactions promptly, and standardize your connection identity (username, database, ApplicationName) across all clients.
In Part 2, we show how to use CloudWatch Logs Insights to find the root cause when metrics are ambiguous, what healthy multiplexing looks like in metrics and logs, and how to set up alarms that catch regression.
To get started, review the RDS Proxy documentation on avoiding pinning and the RDS Proxy concepts guide.