AWS Database Blog
Improve RDS Proxy multiplexing for PostgreSQL, Part 2: Diagnose and monitor
In Part 1 of this series, we showed how connection pinning, pool fragmentation, and uncommitted transactions prevent Amazon Relational Database Service (Amazon RDS) Proxy from multiplexing connections, and how to confirm and fix each one using Amazon CloudWatch metrics. Metrics alone don’t always tell the full story, though. They are sampled once per minute, the conditions often coexist, and they can’t tell you which client application, database user or Amazon EMR job is responsible and what specifically about client behavior caused it.
In this post, we show how to use Amazon CloudWatch Logs Insights with enhanced proxy logs, rather than the standard proxy logs we used in Part 1, to find the root cause of reduced multiplexing. We also show what healthy multiplexing looks like in both metrics and logs, and how to set up CloudWatch alarms that catch regression.
As a quick recap, the three conditions we discussed in Part 1 are:
- Connection pinning – Session state changes, such as SET statements, lock a client to one backend connection for the rest of the session.
- Pool fragmentation – Clients that differ in username, database, or ApplicationName are placed in separate pool partitions that don’t share connections.
- Uncommitted transactions – A backend connection stays borrowed until its transaction is committed or rolled back.
Prerequisites
This post builds on the telemetry described in the Part 1 prerequisites, which used CloudWatch metrics and standard proxy logging. In addition, the root-cause analysis described in this post also requires the following:
- Enhanced logging – Turn on enhanced logging for your proxy. It makes the proxy emit DEBUG-level messages to the same log group that show the borrow/release cycle: which client borrowed which backend connection, and when it was returned to the pool. You need it to understand multiplexing behavior, to diagnose pool fragmentation and uncommitted transactions, and to run the Logs Insights queries later in this post. Enhanced logging generates significant log volume and incurs additional CloudWatch Logs charges (see Amazon CloudWatch pricing), so enable it temporarily for diagnosis and disable it afterward.
- Enable enhanced logging in the RDS console (Proxies → Modify → Enhanced logging) or by using the CLI, and disable it when you are done:
Warning: Enhanced logging records detailed information about the SQL statements sent through the proxy, including the statement text, which might contain sensitive data. Before enabling it in production, restrict access to the proxy’s CloudWatch Logs log group (
/aws/rds/proxy/<proxy-name>) to only the people who need it, and set a short retention period so the debug logs aren’t kept longer than the investigation requires. RDS Proxy automatically disables enhanced logging 24 hours after you turn it on. Disable it as soon as you finish diagnosing rather than relying on that timeout. - AWS Identity and Access Management (IAM) permissions –
rds:ModifyDBProxyto turn enhanced logging on and off, andlogs:StartQuery,logs:GetQueryResults, andlogs:DescribeLogGroupsto run CloudWatch Logs Insights queries. - Database connection logging – Set the log_connections parameter to “on” in your DB Cluster Parameter group or DB Parameter Group, so the database logs connection authorized entries that include the
application_namefor each backend connection, and publish the PostgreSQL log to CloudWatch Logs. This is required for the per-user and per-ApplicationName correlation procedure later in this post.
Going deeper: root-cause analysis with CloudWatch Logs Insights
The per-condition diagnosis in Part 1 relies on CloudWatch metrics, which tell you which condition is present. When the metrics are ambiguous (the conditions often coexist), or when you need to pinpoint which application, user, or connection is responsible, enhanced proxy logs give you connection-level detail. The following CloudWatch Logs Insights queries work across all three conditions to confirm what the metrics suggest and to identify the root cause. For the field, command, and function reference, see the CloudWatch Logs Insights query syntax.
Connection-reuse summary – With enhanced logging enabled, this query shows how each backend connection was used, including how many times it was borrowed, released, and whether it was pinned:
When multiplexing is working well, you should see individual backend connections with many borrows and releases. When pinning is elevated, the borrow/release count per connection drops as the client holds on to the database backend connection for much longer when that connection is pinned.
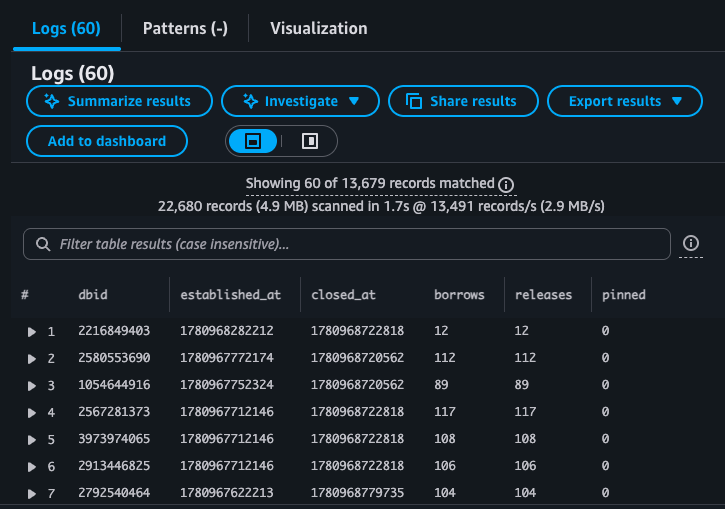
Figure 1: Logs Insights results showing healthy connection reuse
Figure 1 shows what healthy connection reuse looks like in the query results. Each row is a backend connection, and the visible rows show 12 to 117 borrows, the same number of releases, and no pins. Also note that the total number of backend connection that existed during that test (unique dbid values) is 60.
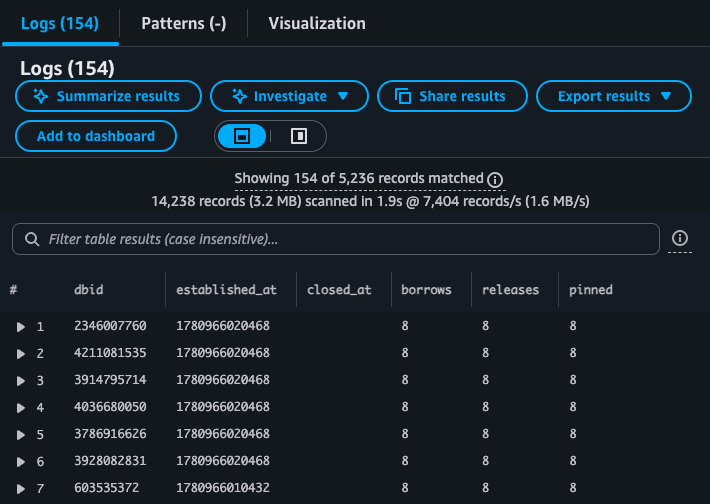
Figure 2: Logs Insights results showing limited reuse from pinned connections
Figure 2 shows the pinned case, where every visible connection has 8 borrows and 8 pins, so reuse is limited. Also note that the total number of connections that was created during this test is 154, which is almost 3 times the size of the pool when multiplexing was working correctly and there was no pinning.
Note: The established_at and closed_at timestamps are epoch milliseconds. To convert in Excel: =(B1/1000)/86400+DATE(1970,1,1), then format as yyyy-mm-dd hh:mm:ss.
Single-connection lifecycle – To trace the full lifecycle of a specific backend connection (every client that borrowed it, when it was released, and when it closed), use the following CloudWatch Logs Insights query:
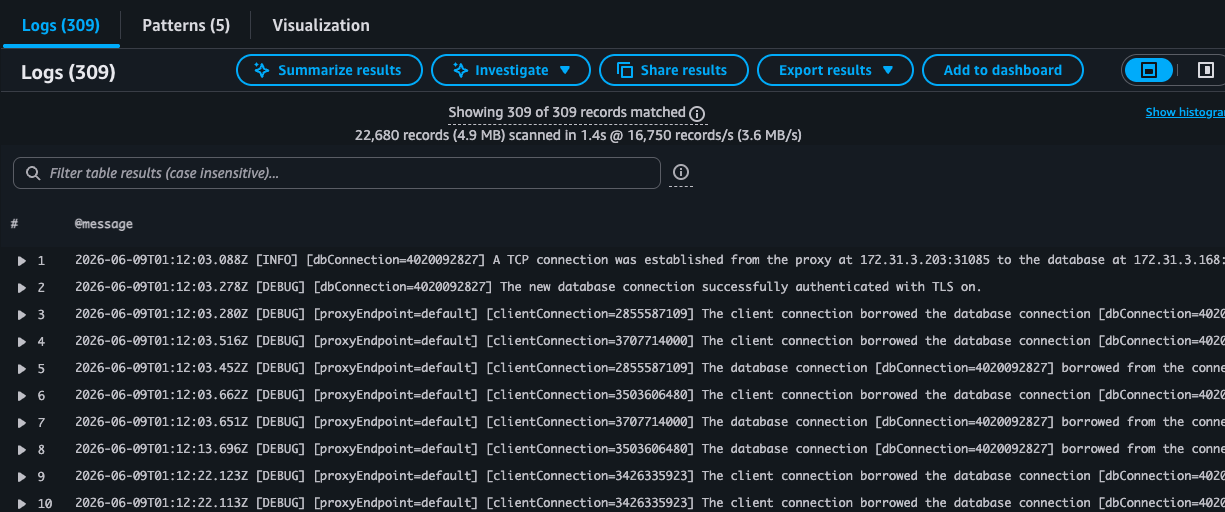
Figure 3: Logs Insights view of a single connection lifecycle
Figure 3 shows the lifecycle of a single backend connection (dbConnection=4020092827) that was borrowed 153 times by different clients during a healthy multiplexing test. Each borrow/release pair represents a different client using and returning the same backend connection. This is what effective connection reuse looks like: one database connection serving many application requests.
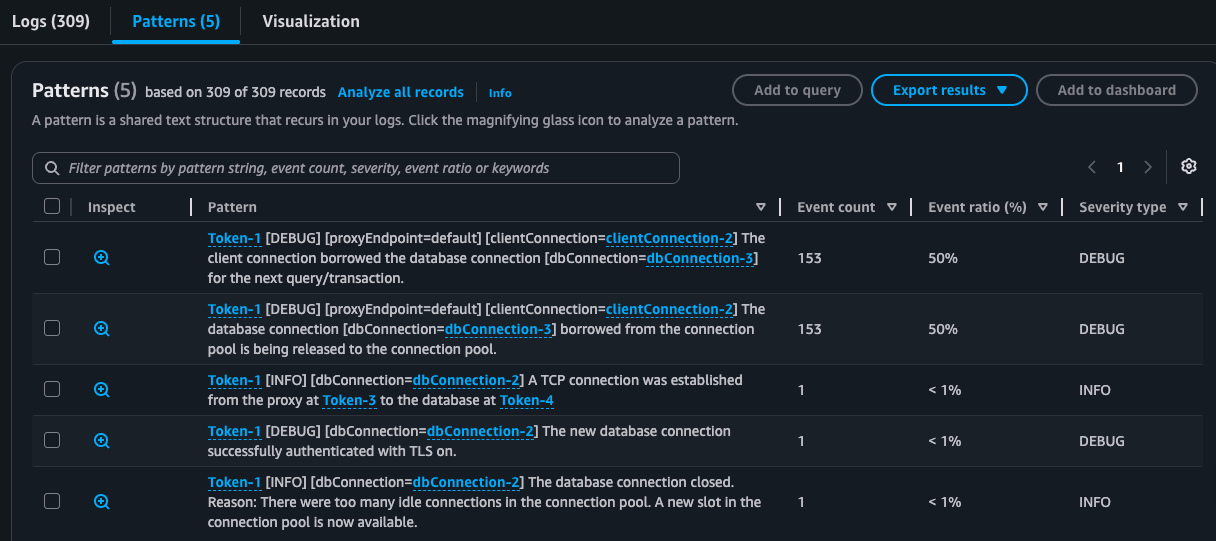
Figure 4: Logs Insights pattern view
Figure 4 shows the Patterns view for the same connection, where you can see the type of statements and their frequency. It confirms the 153 borrows and releases, demonstrating effective multiplexing.
Per-user and per-ApplicationName correlation – To identify which specific applications are causing pinning or fragmentation, correlate proxy enhanced logs with PostgreSQL database logs. This advanced procedure provides per-application visibility when you need to pinpoint the source. It uses two data sources: proxy enhanced logs (borrow/release/pin events per dbConnection ID, plus TCP connection details) and CloudWatch PostgreSQL database logs (connection authorized entries that include the application_name for each backend PID).
- Get borrow, release, and pin counts per backend connection – Run the connection-reuse summary query shown earlier in this section. Each row is one backend connection, identified by its dbConnection ID.
- Query proxy logs for TCP establishment events to extract the proxy source IP:port for each dbConnection:
Each TCP establishment message contains the proxy’s outbound IP:port and the dbConnection ID. This IP:port is what the database sees as the client address.
- Query the PostgreSQL database logs for connection authorized entries:
These entries contain the client IP:port (which matches the proxy’s outbound IP:port from Step 2), the database user, database name, and application_name.
- Join the results using the proxy source IP:port as the linking key. This produces a table showing each backend connection with its borrow count, pin count, database user, and ApplicationName. The final output has two useful views:
- Per-connection detail – Each dbConnection with borrows, releases, pins, user, and ApplicationName.
- Summary by user + ApplicationName – Total connections, total borrows, and total pins per pool partition.
A healthy environment shows high borrow counts per connection and minimal pins. A fragmented environment shows many connections with low borrow counts, grouped into multiple user/ApplicationName combinations. Pinned connections show a pinned count equal to the borrow count, with low borrow counts.
What healthy multiplexing looks like
After pinning is eliminated, transactions are committed promptly, and pool partitions are consolidated, the proxy multiplexes effectively. It’s worth knowing the telemetry and log signatures of a healthy proxy so you can confirm you are there and recognize when you have drifted away from it.
In CloudWatch metrics, a healthy, well-multiplexed proxy shows:
- DatabaseConnections well below ClientConnections – The gap between the two is the multiplexing benefit: the proxy serves many clients from a much smaller pool. This is the headline signal of health.
- DatabaseConnectionsCurrentlySessionPinned low relative to total DatabaseConnections – A small number of pinned connections is normal (administrative tools, monitoring). Pinned connections should be a small fraction of the pool rather than tracking close to DatabaseConnections.
- DatabaseConnectionsCurrentlyBorrowed well below DatabaseConnections – Connections are borrowed for query execution and returned promptly after the transaction completes, so the borrowed count tracks active work rather than the size of the pool. Compare this with Condition 3 in Part 1, where the borrowed count tracks DatabaseConnections. Because this metric is a point-in-time gauge sampled once per minute, fast sub-second borrow/release cycles might make it appear lower than the actual borrow activity. The enhanced logs give the full picture.
- DatabaseConnectionsCurrentlyInTransaction low – Connections aren’t held in open transactions for extended periods. Brief spikes during active query execution are expected, but the metric should drop back as transactions commit.
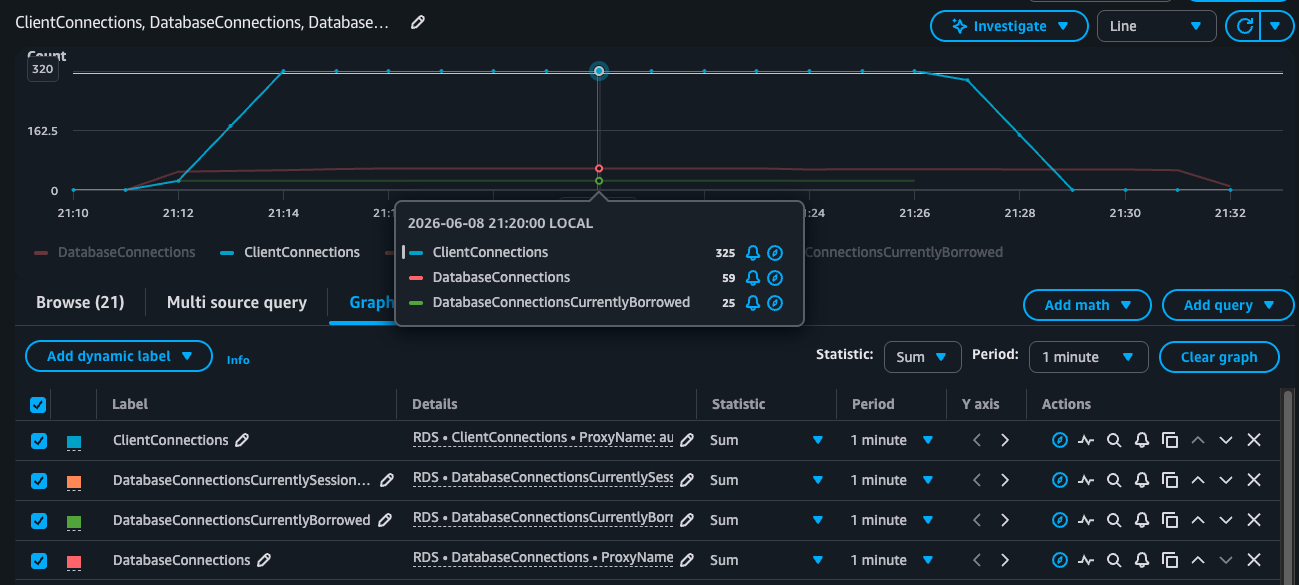
Figure 5: CloudWatch graph for healthy multiplexing
Figure 5 shows this healthy state: ClientConnections remains high while DatabaseConnections is much lower, DatabaseConnectionsCurrentlySessionPinned is flat at zero, and DatabaseConnectionsCurrentlyBorrowed stays well below DatabaseConnections (about 25 of 59 here) because connections are returned to the pool between queries.
In enhanced proxy logs, the connection-reuse query from the previous section tells the same story from the connection’s point of view: individual backend connections show a high number of borrows and releases from different clients, with minimal pins (Figure 1). The single-connection lifecycle view makes this concrete: one backend connection borrowed and released by many clients in sequence (Figure 3).
In the test described in Part 1, the pinned run held 154 backend connections, all of them borrowed and pinned. The same workload without pinning served a steady state of 325 concurrent client connections with about 59 backend connections.
The magnitude of improvement depends on your workload: query duration, connection hold time, and concurrency level. Workloads with short queries, prompt commits, and consistent connection identity (same username, database, and ApplicationName) will see the highest multiplexing ratios. Workloads with longer transactions or mixed connection identities will see more modest but still meaningful reductions.
Monitoring for regression with CloudWatch alarms
After you restore effective multiplexing, you can set up CloudWatch alarms to detect future regression. Code changes, driver upgrades, new Amazon EMR jobs, or framework updates can reintroduce pinning or fragmentation, often without anyone noticing until database load rises. The following two alarms cover the signals that matter most: the number of pinned connections, and the overall ratio of backend to client connections.
Alarm 1: Connection pinning detected
This alarm fires when backend connections are pinned for a sustained period, indicating that new application code or a driver change has introduced SET statements. Configure it with the following settings:
- Metric: DatabaseConnectionsCurrentlySessionPinned.
- Threshold: > [your baseline] for 5 consecutive 1-minute data points.
- Action: Review the pinning warnings in the proxy logs to identify the SQL statement that triggered pinning. If you need connection-level detail, temporarily enable enhanced logging and use the Logs Insights queries in this post.
To create this alarm, run the following AWS CLI command (replace my-proxy with your proxy name and 10 with your baseline):
Because some pinning is normal, the threshold should reflect your own environment rather than zero. To set it, observe DatabaseConnectionsCurrentlySessionPinned for a few days during normal operations after applying fixes, and use the sustained maximum value as your baseline.
Alarm 2: Multiplexing ratio degraded
This alarm fires when the ratio of backend connections to client connections exceeds a threshold, indicating that multiplexing efficiency has dropped. Unlike Alarm 1, it catches any of the three conditions, including fragmentation and uncommitted transactions, because all of them raise the number of backend connections relative to clients. Configure it with the following settings:
- Metric math expression: IF(cc > 50, dc / cc, 0), where dc is DatabaseConnections and cc is ClientConnections. The IF guard avoids dividing by zero when there are no clients, and the client-count floor (here, 50) keeps the alarm from firing at low traffic, where idle connections retained by MaxIdleConnectionsPercent can push the raw ratio up even though multiplexing is healthy. Set the floor to a client count that represents real traffic for your workload.
- Statistic and dimensions: Sum for both metrics, with dimensions ProxyName= and TargetGroup=default.
- Threshold: > 0.5 for 5 consecutive 1-minute data points.
- Action: Check for new pinning, uncommitted transactions, or pool fragmentation using the diagnostic steps in Part 1 and this post.
To create this alarm, run the following AWS CLI command (replace my-proxy with your proxy name and adjust the client-count floor and threshold for your workload):
A ratio of 1.0 means no multiplexing (one backend per client). A ratio below 0.2 indicates healthy multiplexing (5:1 or better). In the healthy run from Part 1, the ratio was about 0.18 (59 backend connections for 325 client connections). Adjust the 0.5 threshold based on the ratio your workload normally achieves.
Considerations and limitations
Keep the following in mind when you use the techniques in this post:
- Enhanced logging adds overhead and cost. It emits DEBUG-level messages for every borrow and release, which can be a large volume on a busy proxy. It increases CloudWatch Logs ingestion and storage charges and can add proxy overhead, so enable it only while diagnosing and disable it when you are done. RDS Proxy also disables it automatically 24 hours after you turn it on and will need to be re-enabled if longer troubleshooting window is required.
- The IP:port correlation is a best-effort join, not a guaranteed key. The procedure links proxy logs to database logs by matching the proxy’s outbound IP:port to the client address the database records. Ports are reused over time as connections close and reopen, so a match is reliable only within the same time window, and close correlation requires synchronized timestamps across both log sources. Treat the result as strong evidence of which user and ApplicationName a connection belongs to, not as a precise mapping. For a quick answer, the per-connection reuse query alone is often enough. Use the full correlation only when you need per-application attribution.
- Log volume can limit CloudWatch Logs Insights scans. Logs Insights scans a bounded amount of data per query and charges by data scanned. On a high-volume proxy with enhanced logging on, narrow each query’s time range and add filter clauses early so you scan less, get results faster, and keep query cost down.
Related posts
- Improve RDS Proxy multiplexing for PostgreSQL, Part 1: Common causes – The first post in this series, which explains connection pinning, pool fragmentation, and uncommitted transactions and how to confirm each one with CloudWatch metrics.
- Understanding the differences between PgBouncer and Amazon RDS Proxy for PostgreSQL connection pooling – Compares the two PostgreSQL connection poolers, including how each handles transaction-level multiplexing and pinning.
- Improving application availability with Amazon RDS Proxy – Background on how RDS Proxy provides connection pooling, multiplexing, and faster failover recovery.
Cleaning up
Enhanced logging is meant to be temporary, and the investigation leaves a few other artifacts behind. After you have diagnosed and resolved your multiplexing conditions, complete the following cleanup steps:
- Explicitly disable enhanced logging (vs. waiting for the automatic 24-hour timeout) to stop debug-level logging. Enhanced logging generates significant CloudWatch Logs volume and cost when left enabled:
- Review CloudWatch Logs retention – The debug logs generated during investigation might no longer be needed. Adjust the log group retention period to avoid unnecessary storage costs.
- Remove diagnostic queries – If you saved CloudWatch Logs Insights queries for the investigation, archive or delete them after you have confirmed the fixes are working.
Conclusion
In this post, you used CloudWatch Logs Insights with enhanced proxy logs to find the root cause of reduced multiplexing, learned what healthy multiplexing looks like in metrics and logs, and set up alarms to catch regression.
The key takeaway: use metrics for ongoing monitoring, and turn on enhanced logging when metrics show drift and you need to identify which connection, user, or application is responsible. Remember to disable it when you are done.
To learn more, review the RDS Proxy documentation on avoiding pinning and the RDS Proxy concepts guide.