AWS Database Blog
Monitor self-managed databases with Amazon CloudWatch Database Insights
If you monitor self-managed databases on Amazon Elastic Compute Cloud (Amazon EC2), you can now use Amazon CloudWatch Database Insights to observe them alongside your Amazon Aurora and Amazon Relational Database Service (Amazon RDS) fleet from a single console. Database Insights consolidates monitoring into one unified experience, removing the need for multiple tools. It gives you a single place to understand database health, troubleshoot performance issues, and reduce mean time to resolution across your entire fleet.
Many organizations run database fleets that span managed services and self-managed instances. Monitoring those self-managed databases has typically meant juggling a different tool for each engine and platform, leading to slower incident response and blind spots when correlating application issues with database behavior. Amazon CloudWatch Database Insights for self-managed databases closes this gap by delivering three key benefits. First, a single pane of glass displays self-managed and AWS managed databases side by side. Second, a normalized view across platforms and engines means your team only needs to learn one tool. Third, monitoring continuity preserves your dashboards and operational knowledge as you migrate workloads from self-managed to AWS managed databases.
In this post, we show how you can use CloudWatch Database Insights to monitor and troubleshoot performance across your self-managed instances.
What’s new
Amazon CloudWatch Database Insights for self-managed databases currently supports self-managed PostgreSQL running on Amazon EC2, and delivers the following capabilities for your self-managed instances:
- Fleet View – View your databases (Aurora, RDS, and self-managed) in a single fleet health dashboard. Self-managed instances appear with a distinct “Self-Managed” badge so you can identify them alongside your managed database resources.
- DB Load analysis – Visualize active sessions broken down by wait event type to quickly determine if your workload is constrained by CPU, I/O, or lock contention.
- Top SQL – Identify the queries driving the most load on your database, including calls, average latency, and rows returned.
- Query Execution Plans – View execution plans for your top queries to understand how the database engine processes them, helping you identify inefficient operations such as sequential scans or costly joins.
- Wait Events – View a detailed breakdown of wait events by type to quickly pinpoint what’s causing performance bottlenecks. Each database engine uses its own naming conventions for wait events, but they all follow similar themes and are instrumental in diagnosing workload issues.
- Host Metrics – Monitor CPU utilization, memory usage, and disk I/O directly from the host’s operating system (OS), collected every 15 seconds. This gives you full-stack visibility from the OS level up through the database engine.
- Database Telemetry – Access a comprehensive view of your database’s operational data, including Metrics, Logs, Slow SQL Queries, and OS Processes, in one place.
How it works
Database Insights for self-managed databases uses the Amazon CloudWatch Agent installed on the same host as your database instance. The agent connects locally and collects telemetry from standard system views. In this post, we use a self-managed PostgreSQL instance as our example. For PostgreSQL, the agent collects from:
pg_stat_activity– Provides real-time active session data, sampled every 1 second to build the DB Load metric and wait event breakdown.pg_stat_statements– Supplies query-level statistics (calls, latency, rows, block reads) polled every 60 seconds for the Top SQL view.- OS-level collectors – Gather host metrics (CPU, memory, disk I/O) every 15 seconds.
- Database server logs – Collected from local log files to surface slow queries and operational events on the console.
The agent publishes the collected telemetry to CloudWatch, where Database Insights processes and visualizes it alongside your managed database fleet.
Finding your self-managed instance on the console
After the CloudWatch Agent is configured and running, your self-managed database instance appears in the Database Insights console within 5–10 minutes. Here’s how to locate it:
- Open the Amazon CloudWatch console.
- In the navigation pane, choose Infrastructure Monitoring, then choose Database Insights.
- In the Fleet View, your self-managed instance is displayed with a “Self-Managed” badge to distinguish it from Aurora and RDS instances.
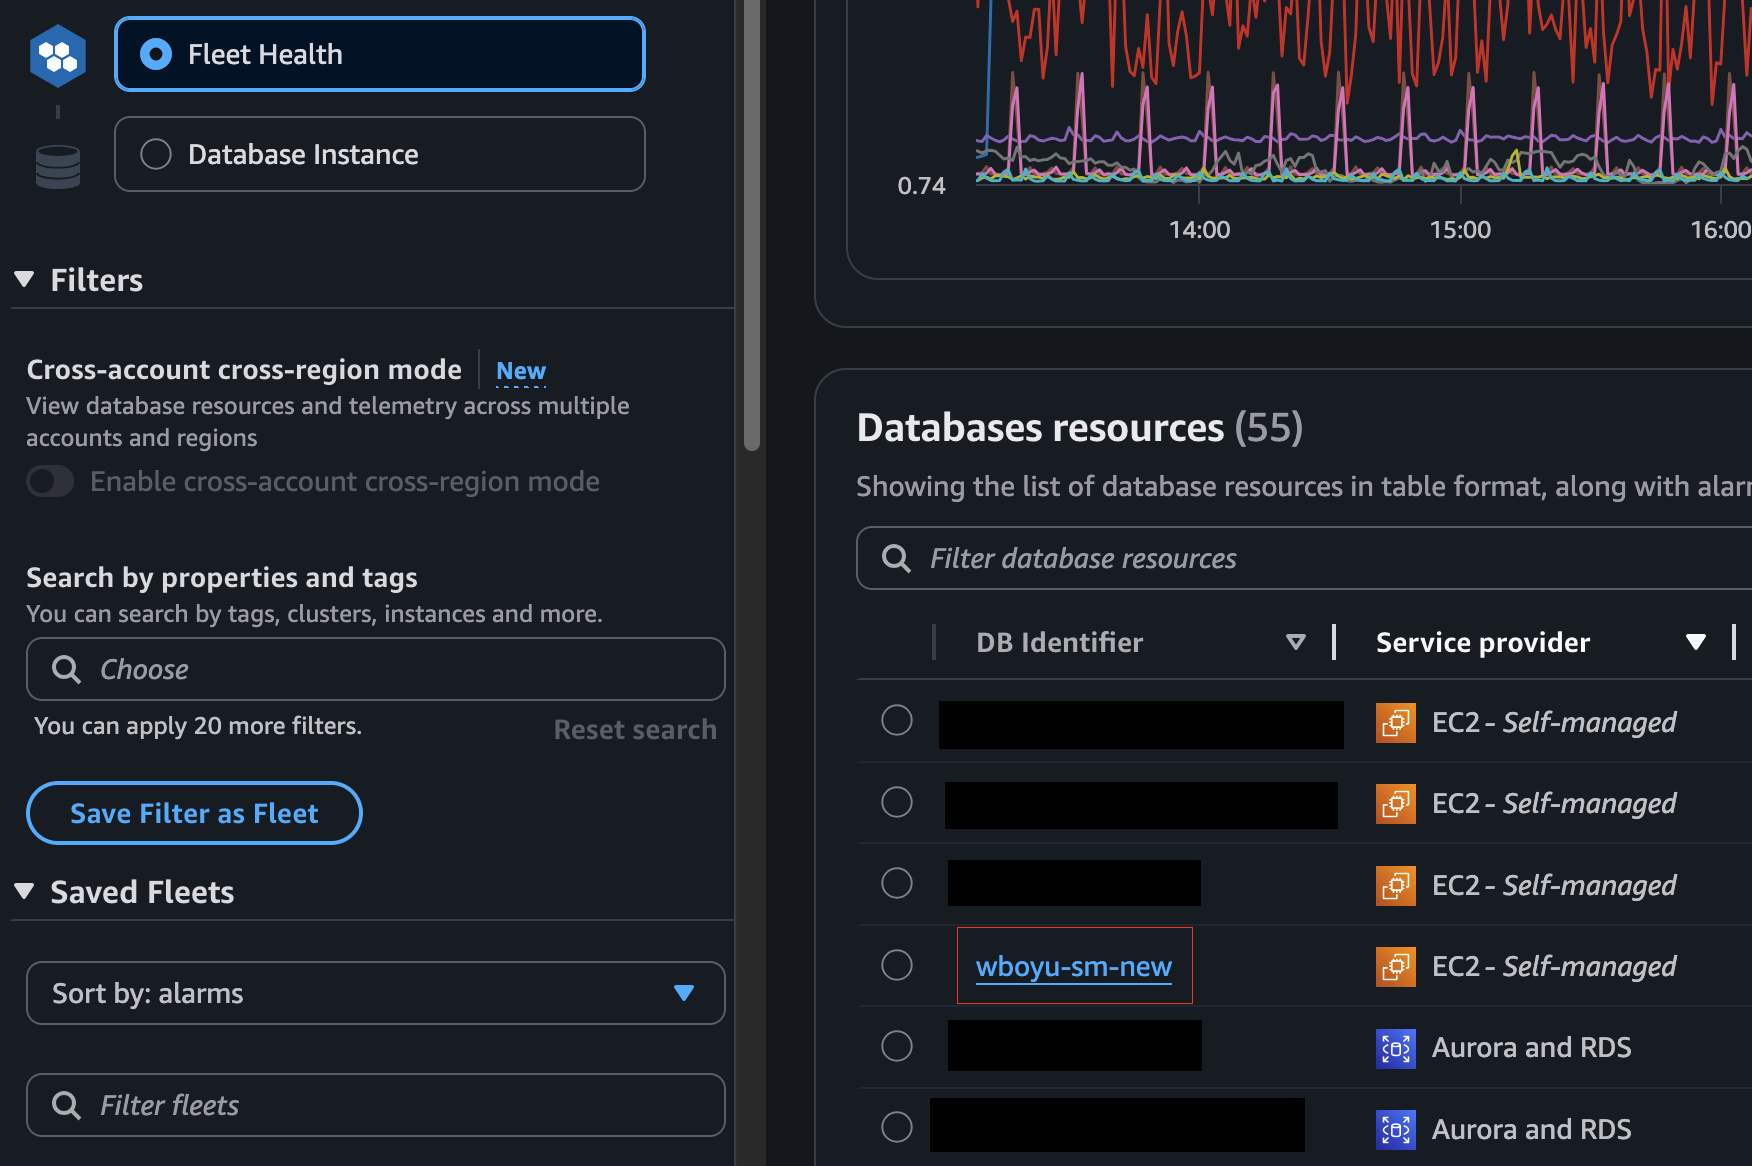
Figure 1: Self-managed instance shown in the Database Insights Fleet View
Choose the instance to open its detailed performance dashboard.
From the Fleet View, you get an at-a-glance health status for each instance, including the current DB Load metric. A non-zero DB Load confirms that telemetry is flowing from the agent to CloudWatch.
Exploring Database Insights features for self-managed instances
After you select your self-managed instance, the detailed dashboard presents the same tabs and views available for managed databases. Let’s walk through each one.
DB Load analysis
The DB Load graph is the centerpiece of the instance dashboard. It plots Average Active Sessions (AAS) over time, color-coded by wait event type. You can immediately identify whether your database is spending time on CPU, waiting for I/O, or blocked by locks. A dashed line marks the number of vCPUs on the host. When AAS rises above this line, your workload is exceeding the instance’s compute capacity. Because self-managed DB Load is sampled every 1 second, you get the resolution needed to catch brief spikes that coarser metrics would miss. The DB Load analysis experience is identical whether you’re viewing a self-managed instance, an Aurora cluster, or an RDS database. It works the same across all supported engines. Database Insights normalizes the underlying signals so you can use a single, consistent methodology to troubleshoot performance across your entire heterogeneous fleet.
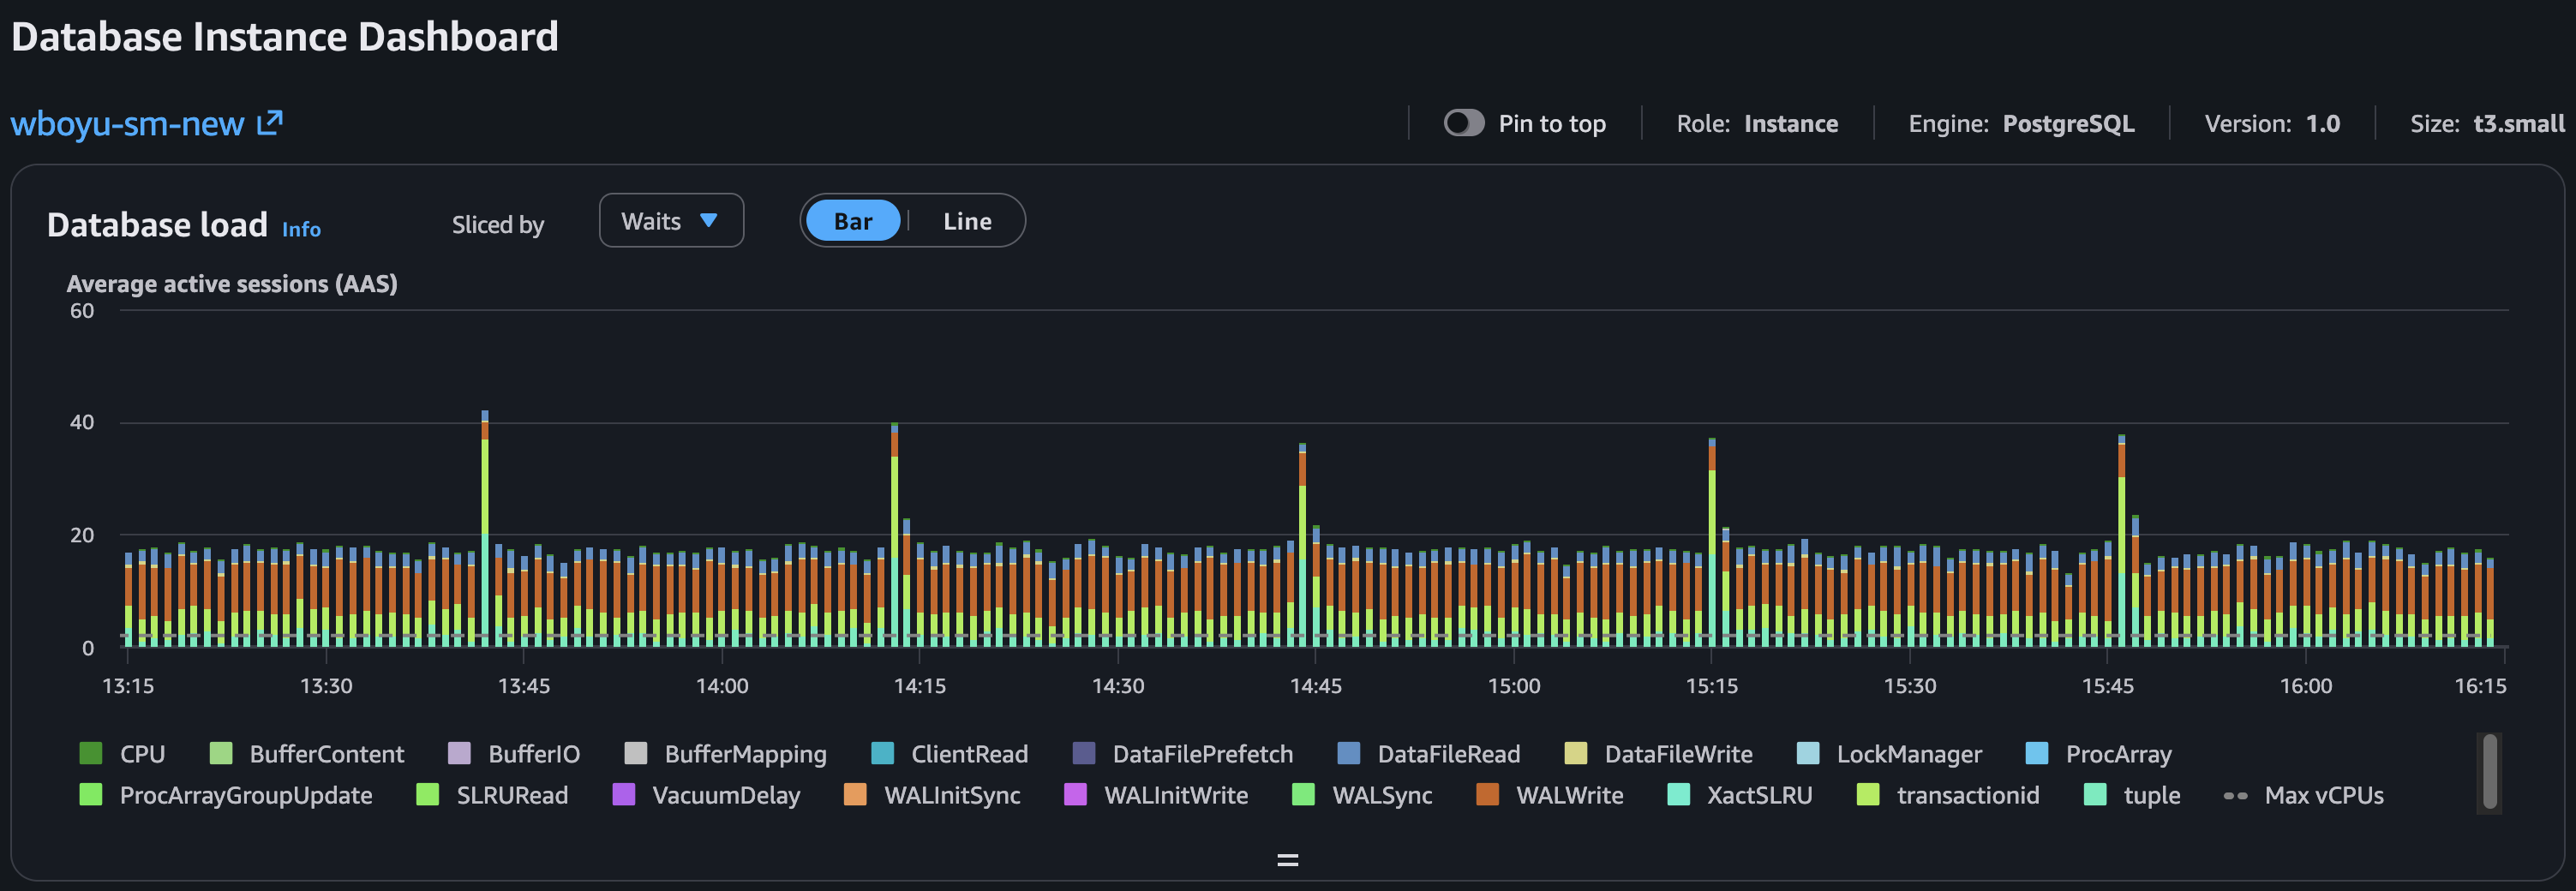
Figure 2: DB Load analysis showing active sessions by wait event type
Top SQL
The Top SQL tab ranks every captured query by its contribution to overall load. For each statement, it displays calls per second, average latency per call, rows returned, and storage block read time. This gives you immediate clarity on which queries consume the most resources. You can choose any query to view historical trends for its metrics over time, which helps you determine whether a performance change is sudden or gradual. These statistics come from database-engine-specific system views (such as pg_stat_statements for PostgreSQL), and you can customize which metric columns appear using the settings icon.
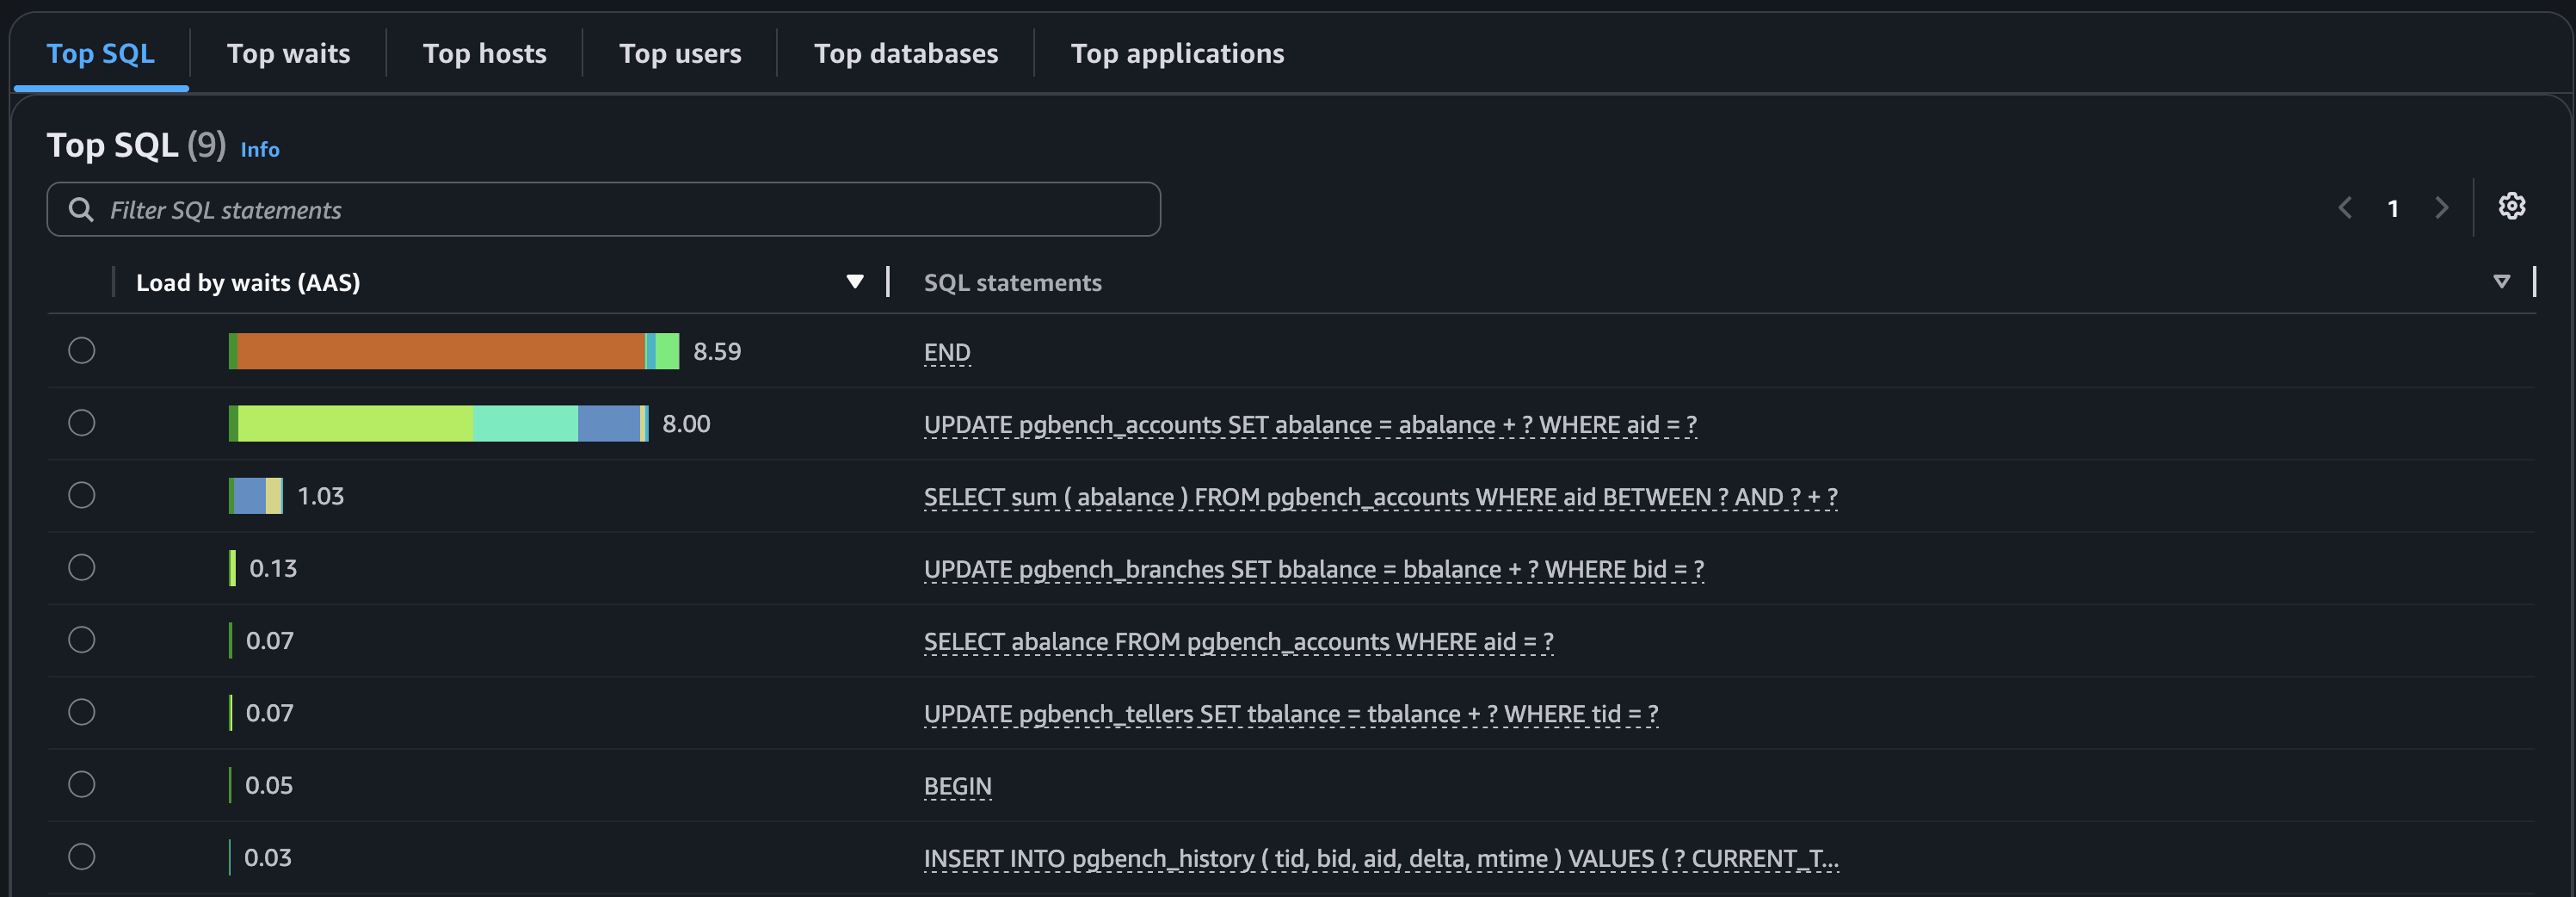
Figure 3: Top SQL tab ranking queries by their contribution to load
Wait Events
The Wait Events view provides a breakdown of what your database sessions are spending their time on. For PostgreSQL, common wait event categories include:
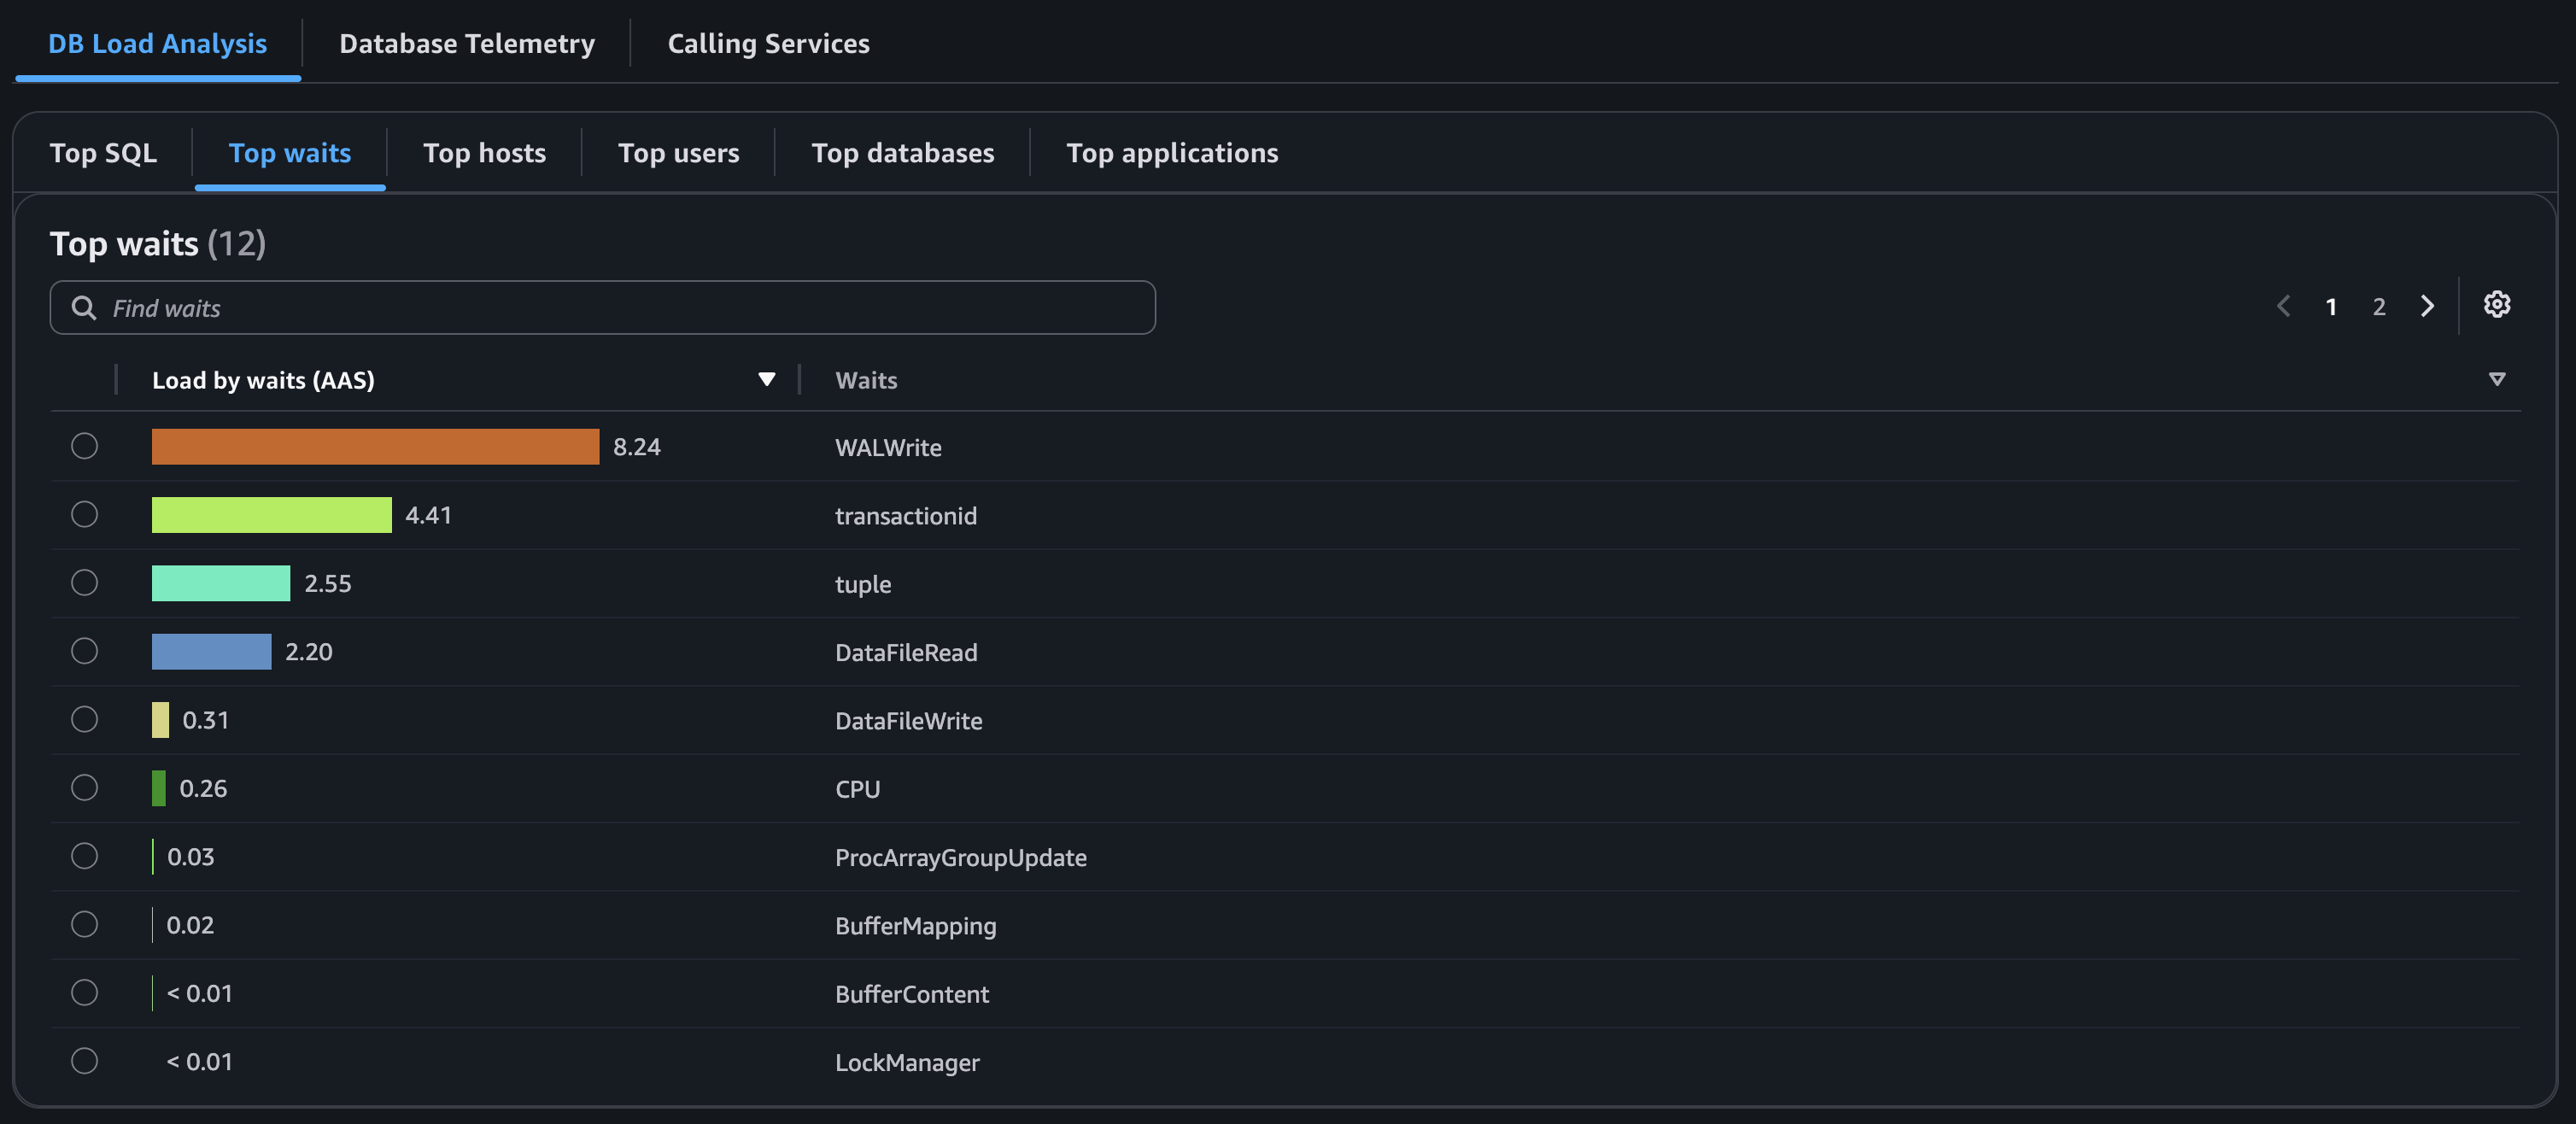
Figure 4: Wait events breakdown for a PostgreSQL instance
- CPU – Sessions actively executing on (or waiting for) CPU.
- IO – Sessions waiting for disk I/O operations (such as
IO:DataFileRead,IO:DataFilePreFetch). - Lock – Sessions waiting to acquire heavyweight locks.
- LWLock – Sessions waiting for lightweight internal locks.
Understanding wait events is key to diagnosing performance issues. For example, if a large portion of your DB Load is attributed to IO:DataFileRead, it might indicate missing indexes causing sequential scans, or insufficient memory for caching.
Database Telemetry
The Database Telemetry tab provides a comprehensive view of your database’s operational data. This is where you find host-level metrics (CPU, memory, disk I/O) alongside database-specific telemetry. The tab is organized into the following sub-sections:
- Metrics – Database-level and host-level CloudWatch metrics displayed as time-series graphs, helping you observe trends and correlate events with changes in database behavior.
- Logs – View and search your database server logs collected by the CloudWatch Agent, filtered by time period.
- Slow SQL Queries – Identify queries exceeding your configured slow query threshold without needing to SSH into the server.
- OS Processes – Monitor operating system processes running on the host, giving you visibility into resource consumption at the process level.
Pricing
Amazon CloudWatch Database Insights for self-managed databases is available at no additional cost beyond standard CloudWatch ingestion charges. Visit the Amazon CloudWatch pricing page for details.
Considerations
Self-managed instances do not appear in the Fleet View when cross-Region cross-account mode is enabled. Toggle off this setting at the top of the Database Insights console to view your self-managed instances.
Some advanced capabilities available for Aurora and RDS, such as Performance Analysis Reports and Lock Analysis, are not yet supported for self-managed instances.
Self-managed databases do not use the Standard mode and Advanced mode of Database Insights. Database Insights retains 15 months of the metrics collected for your self-managed databases. For more information, see the Database Insights for self-managed databases documentation.
Conclusion
Amazon CloudWatch Database Insights now supports self-managed databases, so you can unify observability across your Aurora, RDS, and self-managed instances in one console.
We encourage you to try Database Insights for your self-managed databases and experience the benefits of unified fleet-wide database observability. In this post, we demonstrated the feature using a self-managed PostgreSQL instance, but the same workflow applies to other available database engines.
To get started, install the CloudWatch Agent on your first self-managed database host, configure the agent to connect to your database engine, prepare your database by enabling the required system views, and look for your instance in the Fleet View within minutes. For a walkthrough of Database Insights troubleshooting capabilities, read our companion post Amazon CloudWatch Database Insights applied in real scenarios.