AWS Database Blog
Troubleshooting row lock contention in Amazon Aurora PostgreSQL: Part 1 – Understanding row lock contention in PostgreSQL
During a flash sale, thousands of customers rush to buy the same limited-stock items. Your database is healthy on CPU and I/O, yet order throughput collapses and requests start timing out. The cause is often row lock contention: many transactions competing to update the same rows. Amazon Aurora PostgreSQL-Compatible Edition uses a distributed storage architecture to enhance database performance and availability compared to standard PostgreSQL deployments, but row lock contention is a PostgreSQL engine behavior that occurs independent of the storage layer of Aurora.
PostgreSQL uses multi-version concurrency control (MVCC) to manage concurrent data access while maintaining ACID compliance. It implements different lock types at table and row levels to maintain data consistency during concurrent transactions.
Database workloads can experience lock contention when multiple sessions modify the same data simultaneously. While the locking mechanism of PostgreSQL handles most concurrent access effectively, row-level transaction ID locks can create performance bottlenecks when many transactions compete for the same rows. This contention occurs at the database level, independent of the Aurora PostgreSQL distributed storage architecture and read scaling capabilities. In this two-part series, we show you how to identify, monitor, and resolve row lock contention in Amazon Aurora PostgreSQL-compatible databases. In this post (Part 1) we cover the locking internals and basic monitoring techniques using system views and functions. Part 2 demonstrates how to use Amazon CloudWatch Database Insights for advanced lock analysis and presents architectural patterns to prevent contention in production workloads. Because row lock contention is a PostgreSQL engine behavior, everything in this post series applies equally to Amazon Relational Database Service (Amazon RDS) for PostgreSQL.
Prerequisites
To follow the techniques described in this post, you need:
- An Amazon Aurora PostgreSQL-Compatible Edition cluster.
- CloudWatch Database Insights Advanced mode enabled on your Aurora cluster.
- An EC2 instance with PostgreSQL client such as psql to connect to the Aurora cluster.
Although we demonstrate the concepts using an order placement workload, you can follow the same investigation approach and queries for any workload where you observe lock contention.
To reproduce the order-placement workload and the exact lock contention scenario shown in this post, clone the sample-aurora-rds-workload-simulation-script. It contains the schema, data generator, and workload simulation scripts referenced throughout this two-part series. See the repo’s PostgreSQL/README.md for full setup instructions to create an Aurora cluster or RDS instance with a connected Amazon Elastic Compute Cloud (Amazon EC2) client host using the provided AWS CloudFormation templates.
How locks work in PostgreSQL
PostgreSQL implements different types of locks to maintain data consistency. While row-level locks are most common during normal operations, the system also uses table-level locks for Data Definition Language (DDL) operations, advisory locks for application coordination, page-level locks for buffer pool access, and internal locks to protect shared memory structures.
The row lock implementation in PostgreSQL takes a unique approach. Instead of using shared memory, PostgreSQL stores lock information directly in the row’s internal system column (xmax). This design manages numerous row locks efficiently while using minimal memory compared to table-level locks stored in shared memory.
To lock a row, PostgreSQL first checks for existing locks on the target row. It then acquires a temporary tuple lock in shared memory to process the lock request. After writing the lock information to the row metadata, it releases the temporary tuple lock.
PostgreSQL provides several row lock modes with different restriction levels. FOR UPDATE serves as the most restrictive mode, while FOR NO KEY UPDATE permits more concurrent operations. The FOR SHARE and FOR KEY SHARE modes allow concurrent readers while blocking specific write operations.
Storing lock information directly on rows eliminates the need for lock escalation, improving concurrency and reducing deadlock risks. While this requires additional I/O during checkpoints, PostgreSQL can efficiently manage concurrent row locks while maintaining data consistency.
Example of row locks
Let’s look at an example of row lock. We will first create a table and populate it with some data:
In one session, we start a transaction and update one row, but don’t commit it yet:
In this session we can check the current transaction id:
In another session, trying to update the same row would hang waiting for a row lock:
In the next section, we will see how row lock contention affects database performance in a real-world scenario.
Understanding row lock contention in a workload
In this section, we examine a real-world scenario where an application’s performance deteriorated because of row-level lock contention.
Schema
The example application uses the item_inventory table to hold the catalog of available products and their counter, and every order goes to the orders table. You can find the full DDL for this schema, including item_inventory, orders, order_items, users, and address, in pgsql-db-setup.sql in the accompanying repo. Create the schema and seed it with data using the repo’s scripts:
For this post, we populate item_inventory with 10 million rows, and 10,000 rows in users and address. The preceding data generator uses smaller scale values by default so you can follow along quickly. See the repo README for scaling guidance.
The repo also includes several workload simulation scripts under workload-scripts/: an average-load script, a contentious (“flash-sale”) load script, a sporadic-load script, and a striped-inventory variant of the contentious script. We will use these throughout this two-part series to reproduce specific lock contention patterns, starting with the average-load baseline in the next section. Later in Part 2, we will show how a combination of schema changes (splitting hot rows across multiple “striped” rows) and workload optimization (using SKIP LOCKED with retry instead of blocking waits) resolves the contention these scripts simulate.
Every order has delivery-related details and can have multiple items. The database has 10 million rows in the item_inventory table, and when a customer places an order, the application reduces the item_count for the respective row in the inventory and inserts a row in the order_items table.
Workload simulation: average load
With the schema created and seeded with data (previous section), simulate the baseline, non-contentious order-placement workload:
This script spreads writes across the full inventory pool, placing orders with five items in each order. We use this script to reproduce the “normal transaction rate” baseline with 128 concurrent threads (simulating 128 concurrent orders) shown in the following Database Insights screenshots.
Transaction pattern and usual workload
The following screenshots from CloudWatch Database Insights show the baseline workload on an Aurora PostgreSQL writer instance (db.r8g.4xlarge). Under this average-load configuration (128 concurrent sessions), the database sustains close to 10,900 transactions per second. The Database Load chart shows IO:XactSync, LWLock:BufferContent, and CPU as the dominant wait events, which are normal for a write-intensive workload with no lock contention.
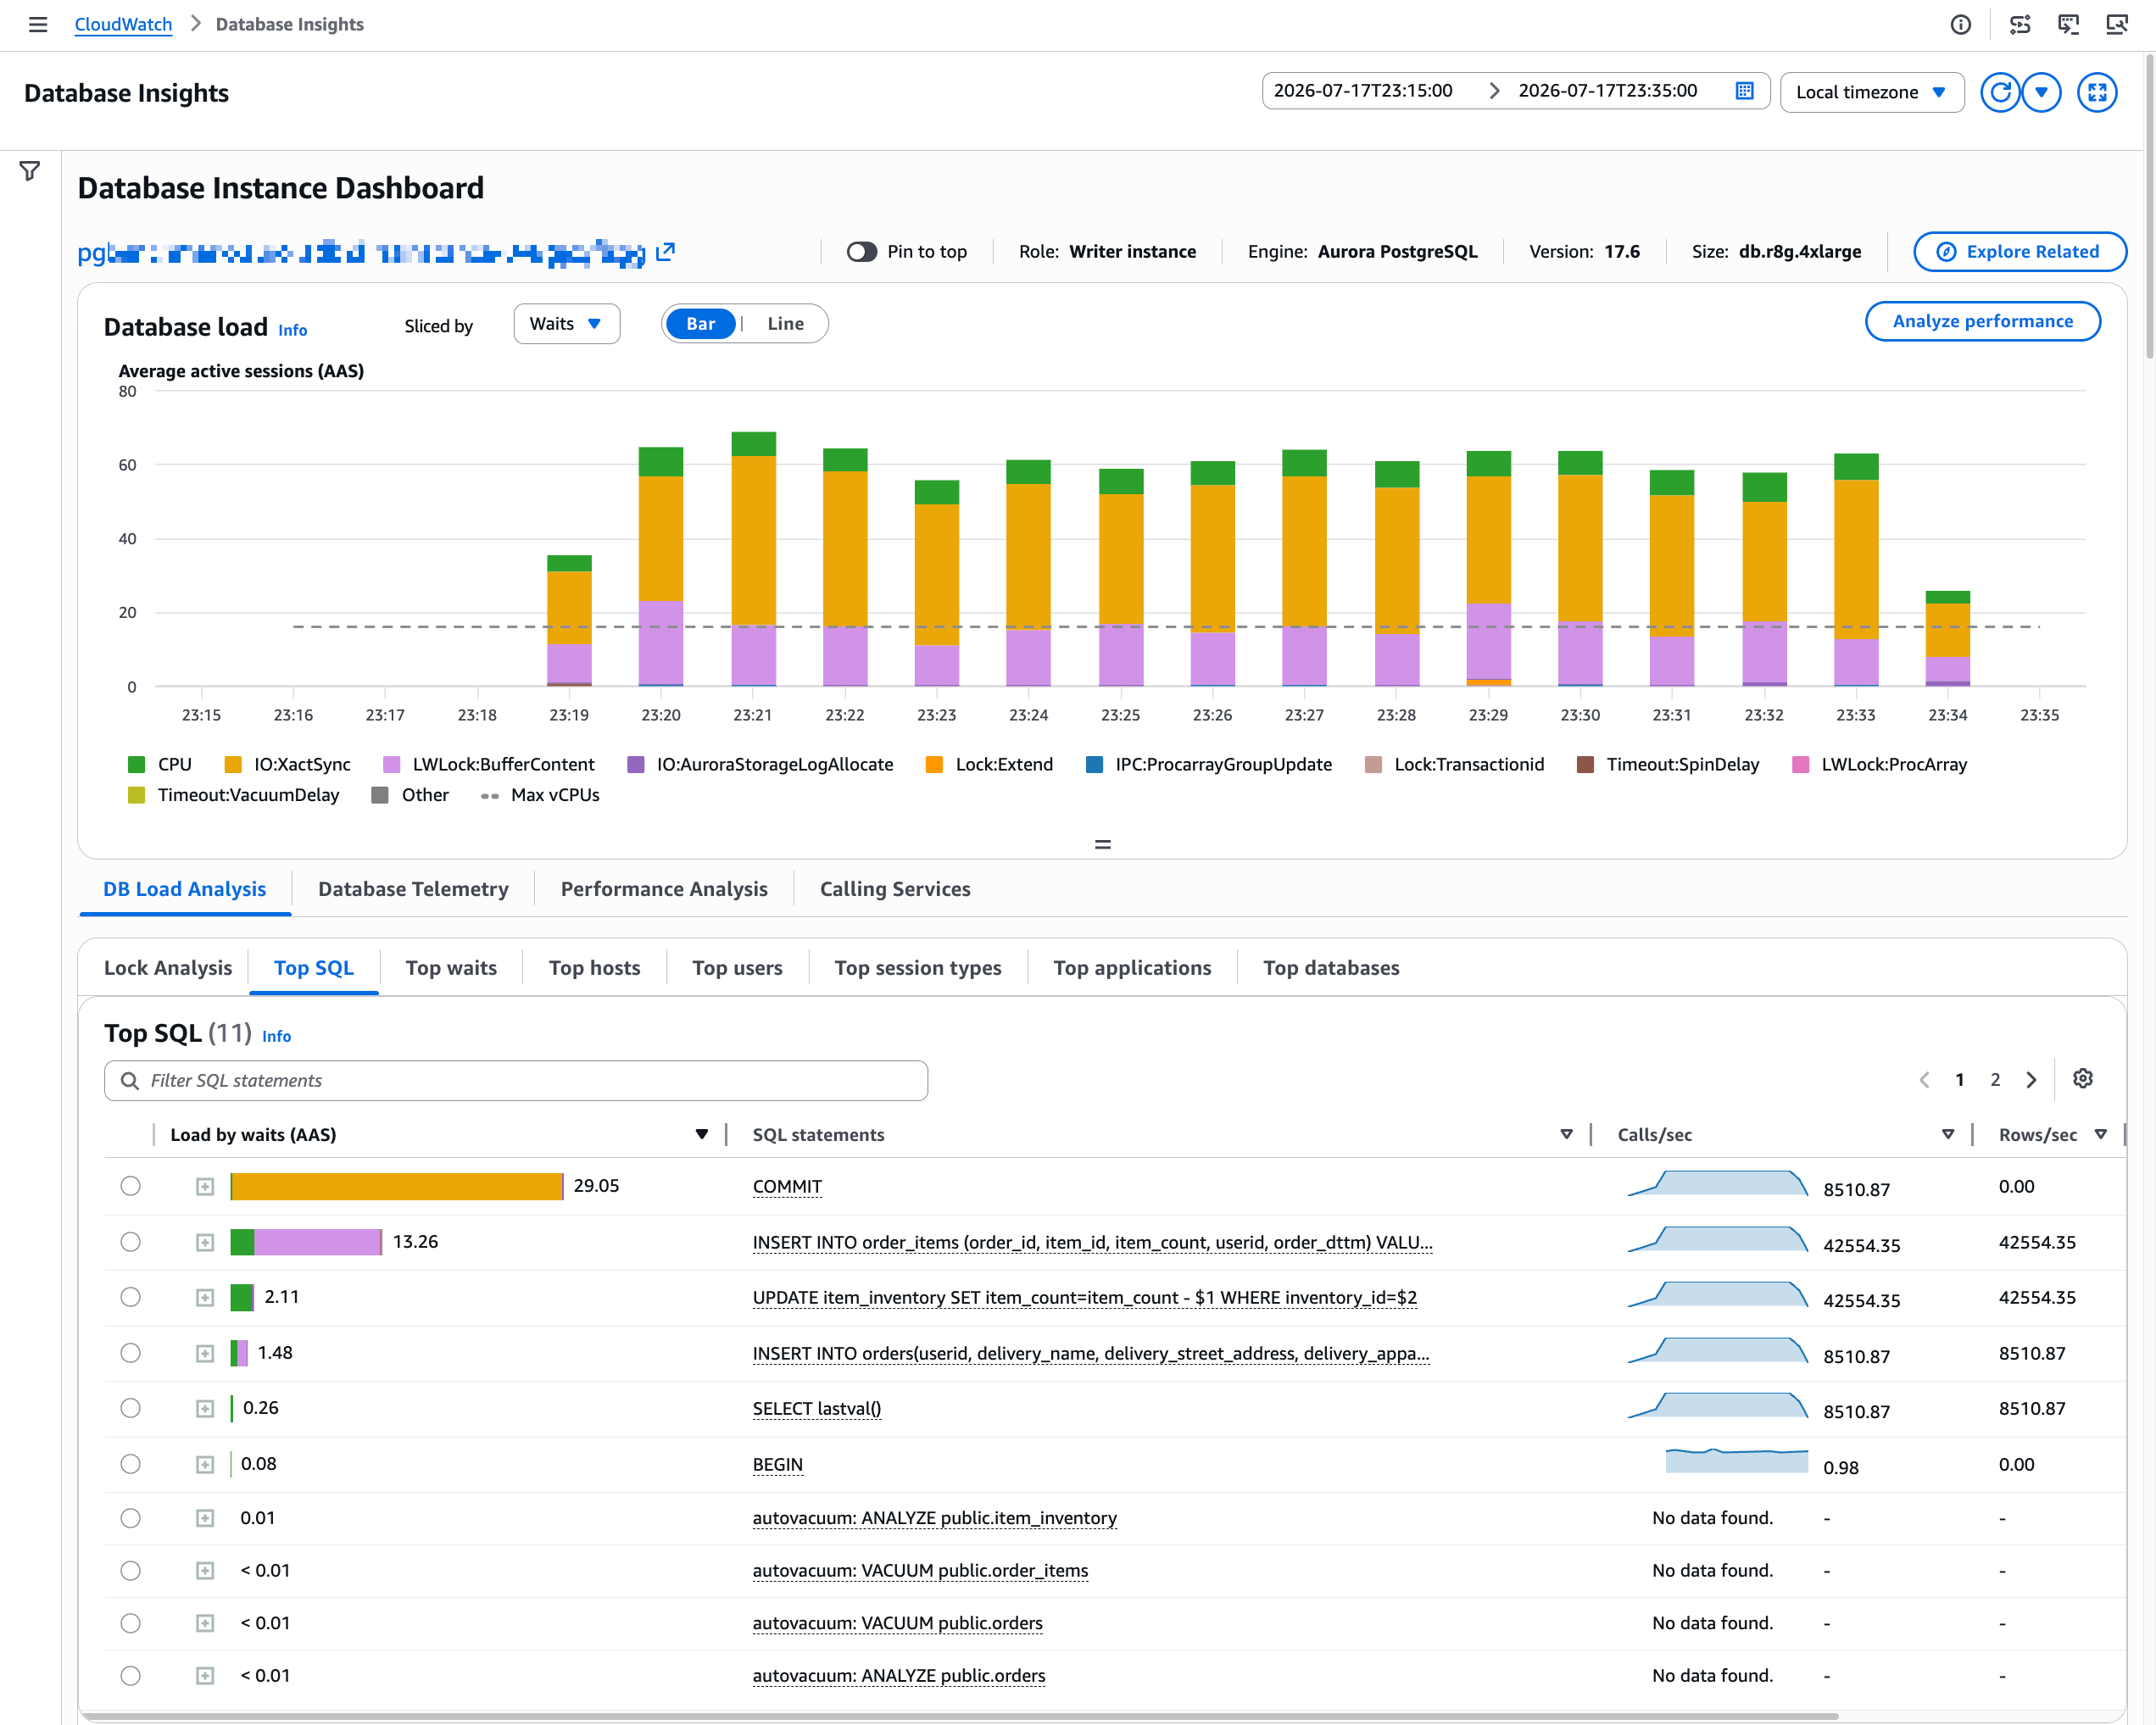
Figure 1: Wait events and top SQL showing sessions are mostly waiting on IO:XactSync, LWLock:BufferContent, and CPU
Note: If you simulate the same workload, you might see slightly different wait events, depending on content of buffer cache when you run the test, pre-existing record count in orders and order_items table, engine, engine version, and time grain selected on DB Load chart.
The following screenshot shows CloudWatch metrics for transactions committed per second (db.Transactions.xact_commit) on the Aurora PostgreSQL writer instance (db.r8g.4xlarge). We ran a sysbench workload to place orders through 128 concurrent sessions. For our workload, this translates to the number of orders successfully placed every second:
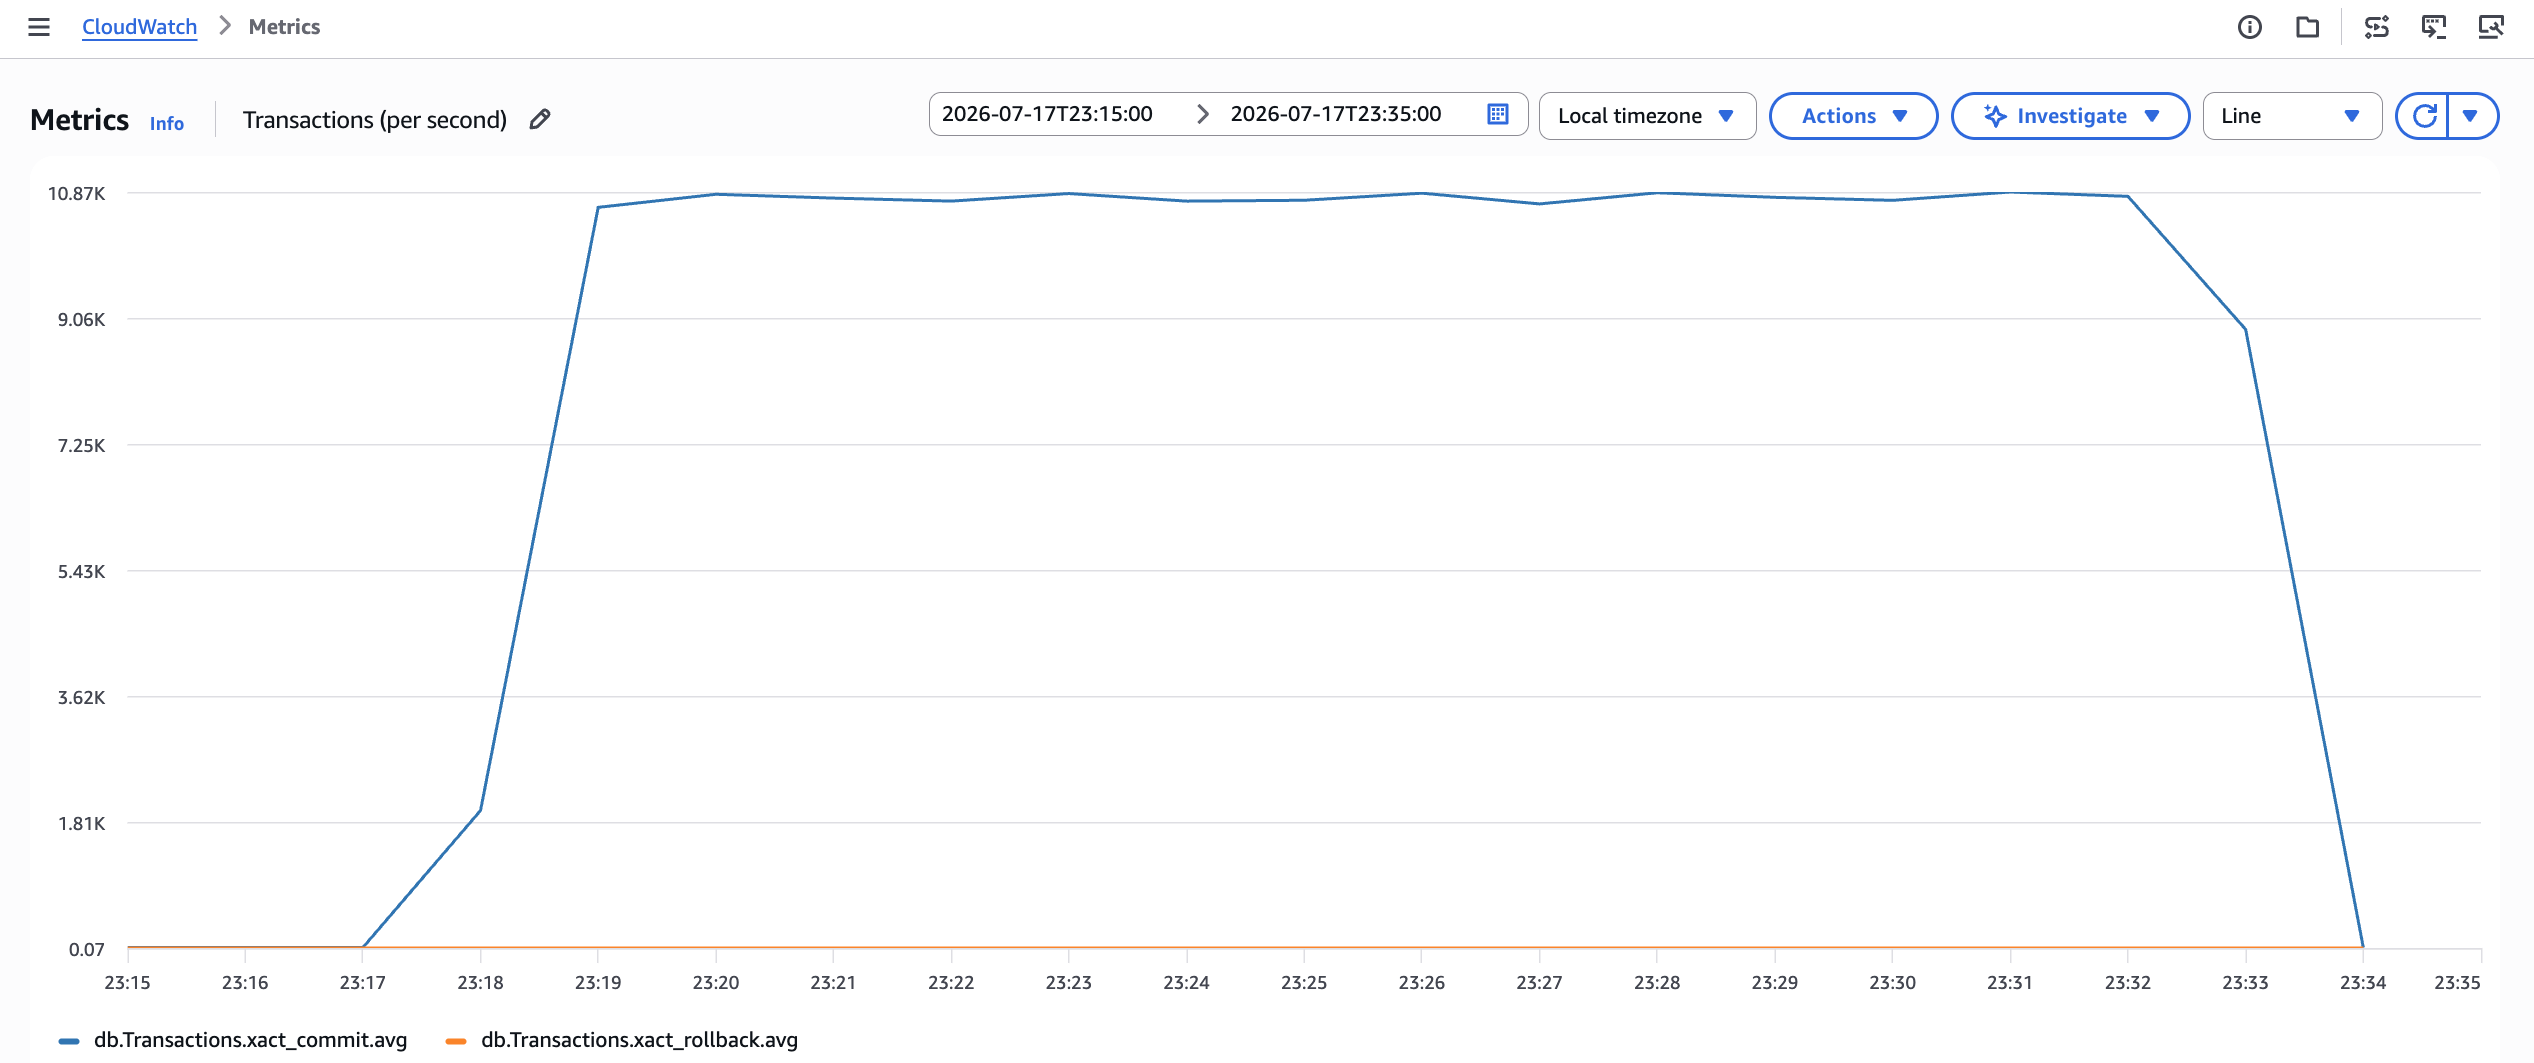
Figure 2: During normal workload Aurora PostgreSQL is able to scale and meet required throughput of ~10,900 transactions per second
Simulating a flash-sale surge
Now simulate a flash-sale-like surge: concentrate writes on a small pool of inventory rows instead of spreading them across the full catalog, so you can compare the resulting throughput and lock wait events against the preceding average-load run.
With the workload running, open Database Insights and review throughput and lock wait events as concurrent requests pile up on the same 25 popular inventory rows.
Throughput degradation during lock contention
Under average load (128 concurrent sessions, each placing orders with five items spread across the full inventory), the database sustained close to 10,900 transactions per second. We then simulated a flash-sale surge: 512 concurrent sessions each ordering a single item from only 25 popular inventory rows. Throughput dropped to approximately 4,900 transactions per second, a 55 percent reduction that causes application timeouts and degrades user experience. The following Database Insights screenshot shows lock wait events appearing as the dominant load component during this contention.
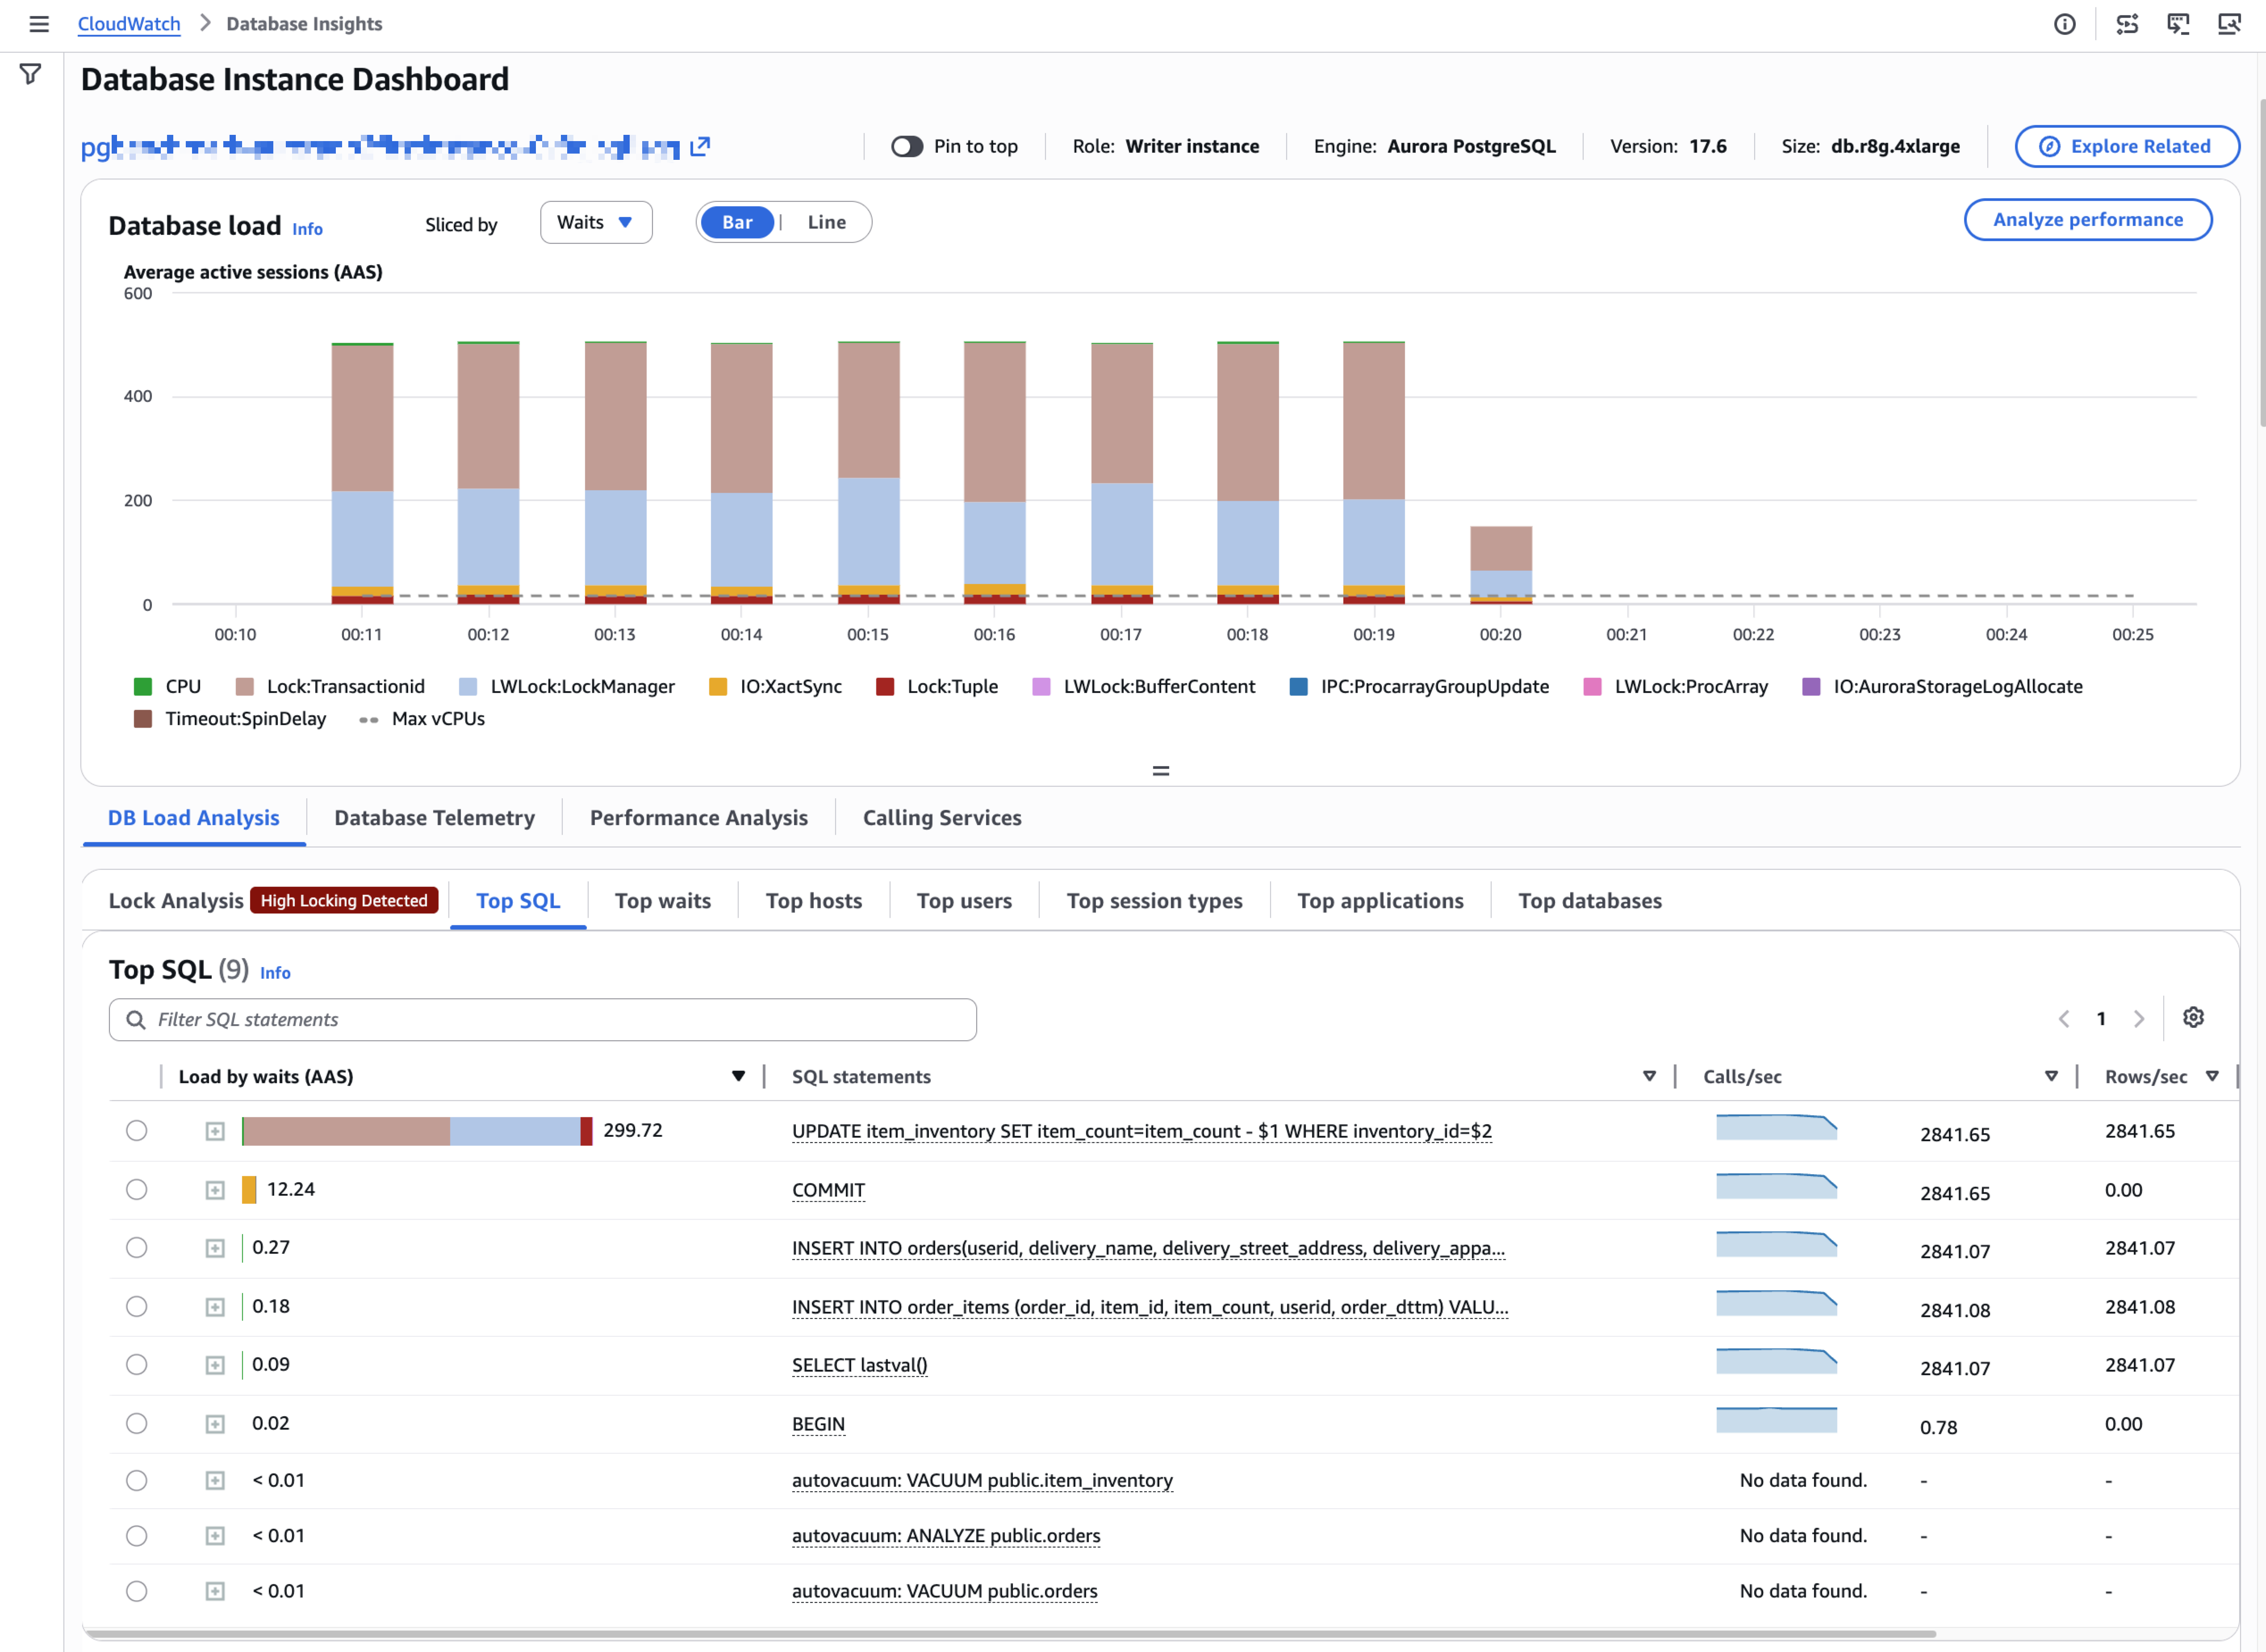
Figure 3: Row lock contention is prominent when multiple users are placing orders for the same item in the catalog
Because of lock contention, each order now takes longer to be committed, and we can see that the transaction throughput has dropped by 55 percent, to about 45 percent of the usual baseline:
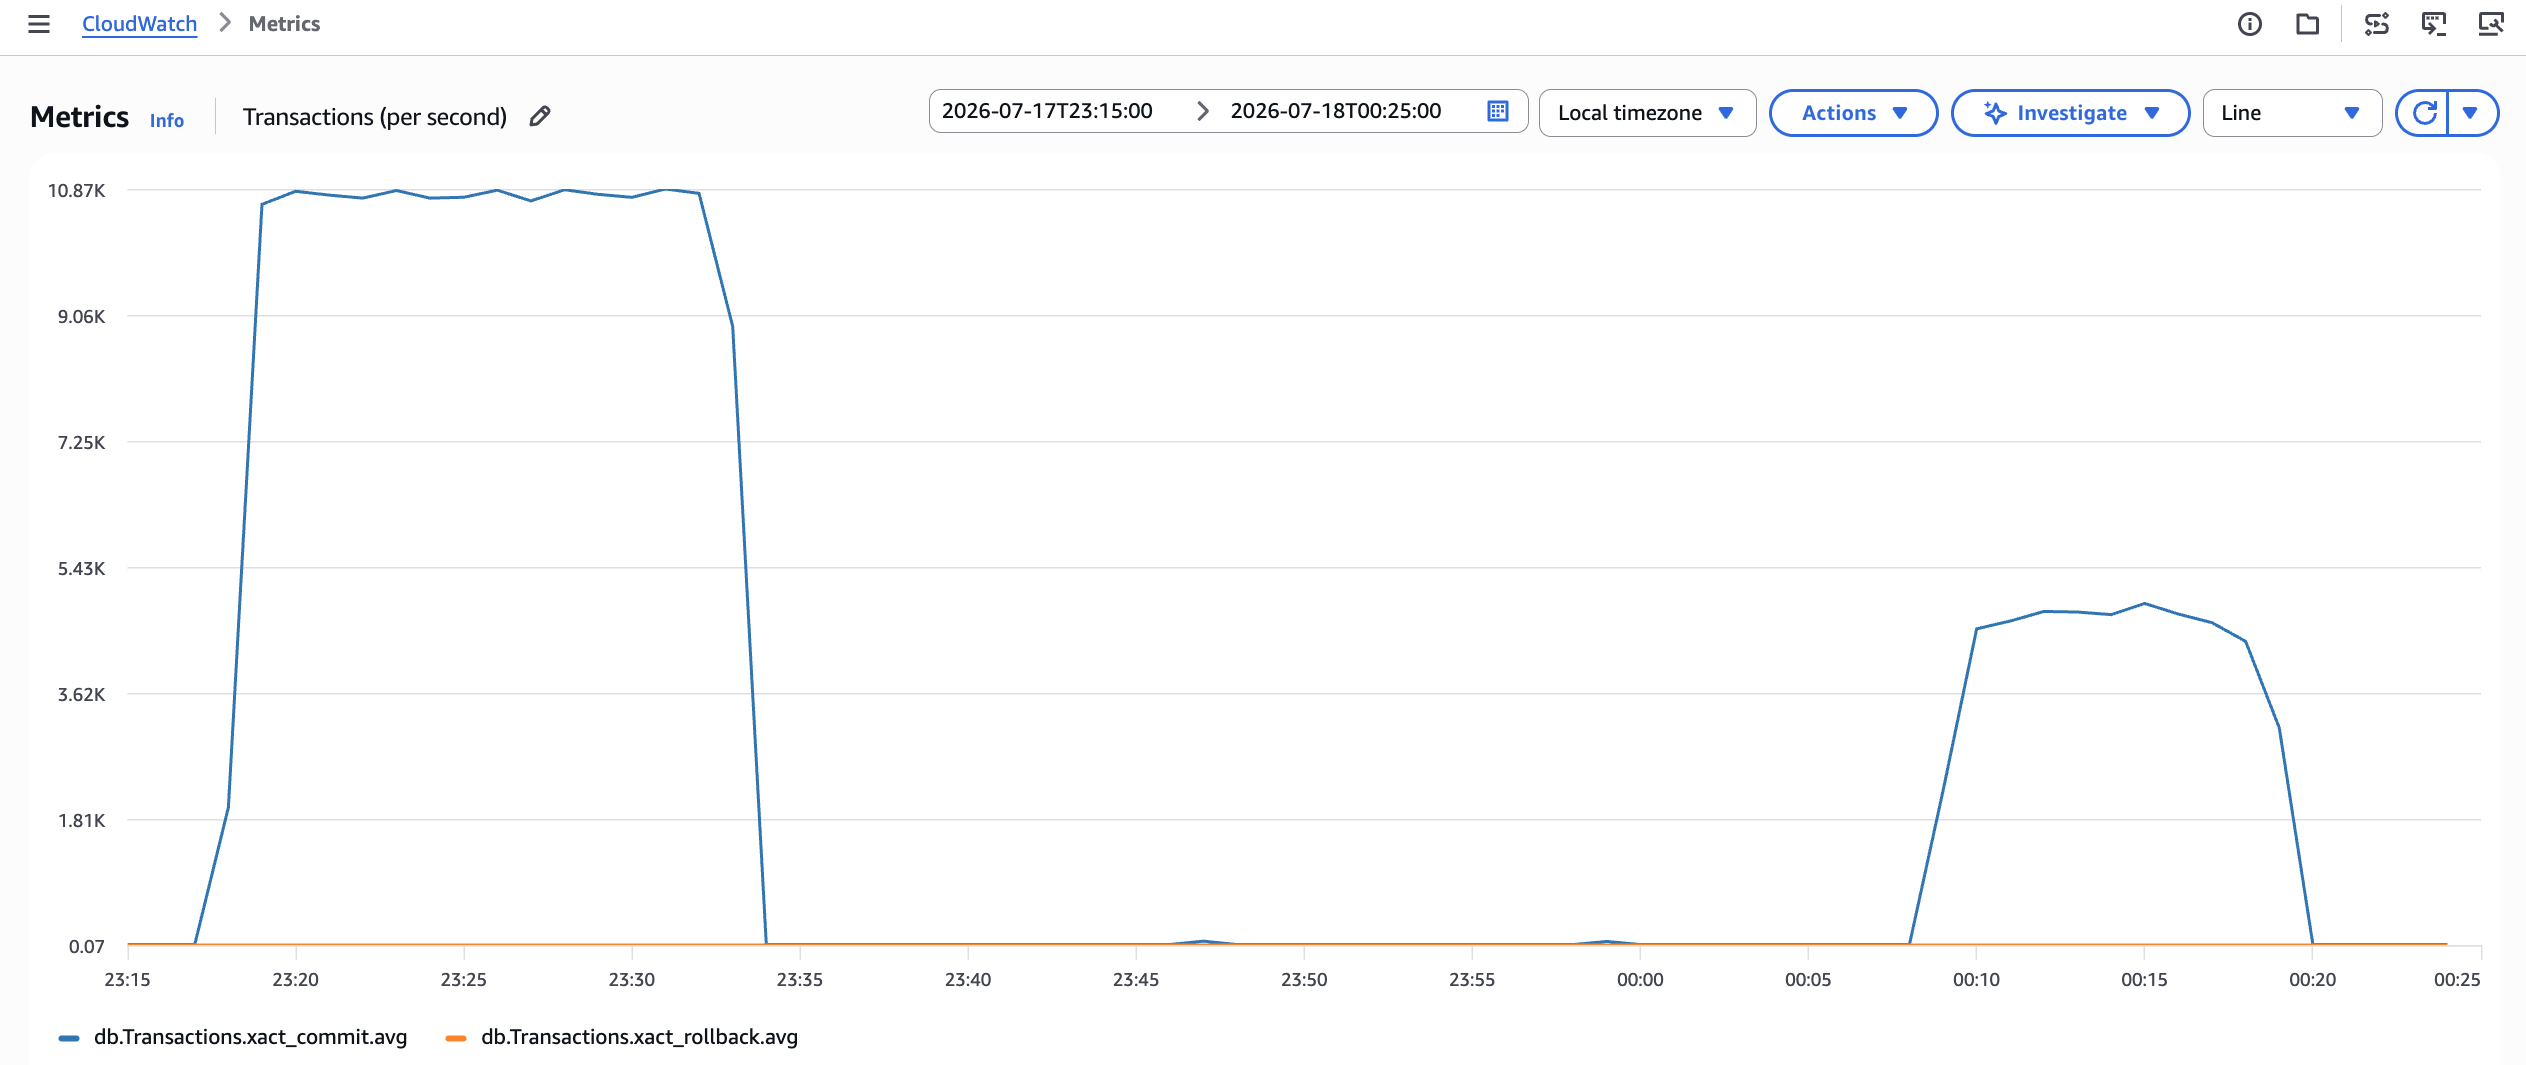
Figure 4: As each session is now waiting for lock, overall throughput drops
The following screenshot from the Database Insights dashboard shows that Lock:TransactionId, LWLock:LockManager, and Lock:Tuple wait events dominated the workload, causing 95 percent of database load. This indicates concurrent transactions waiting for row-level locks held by other sessions:
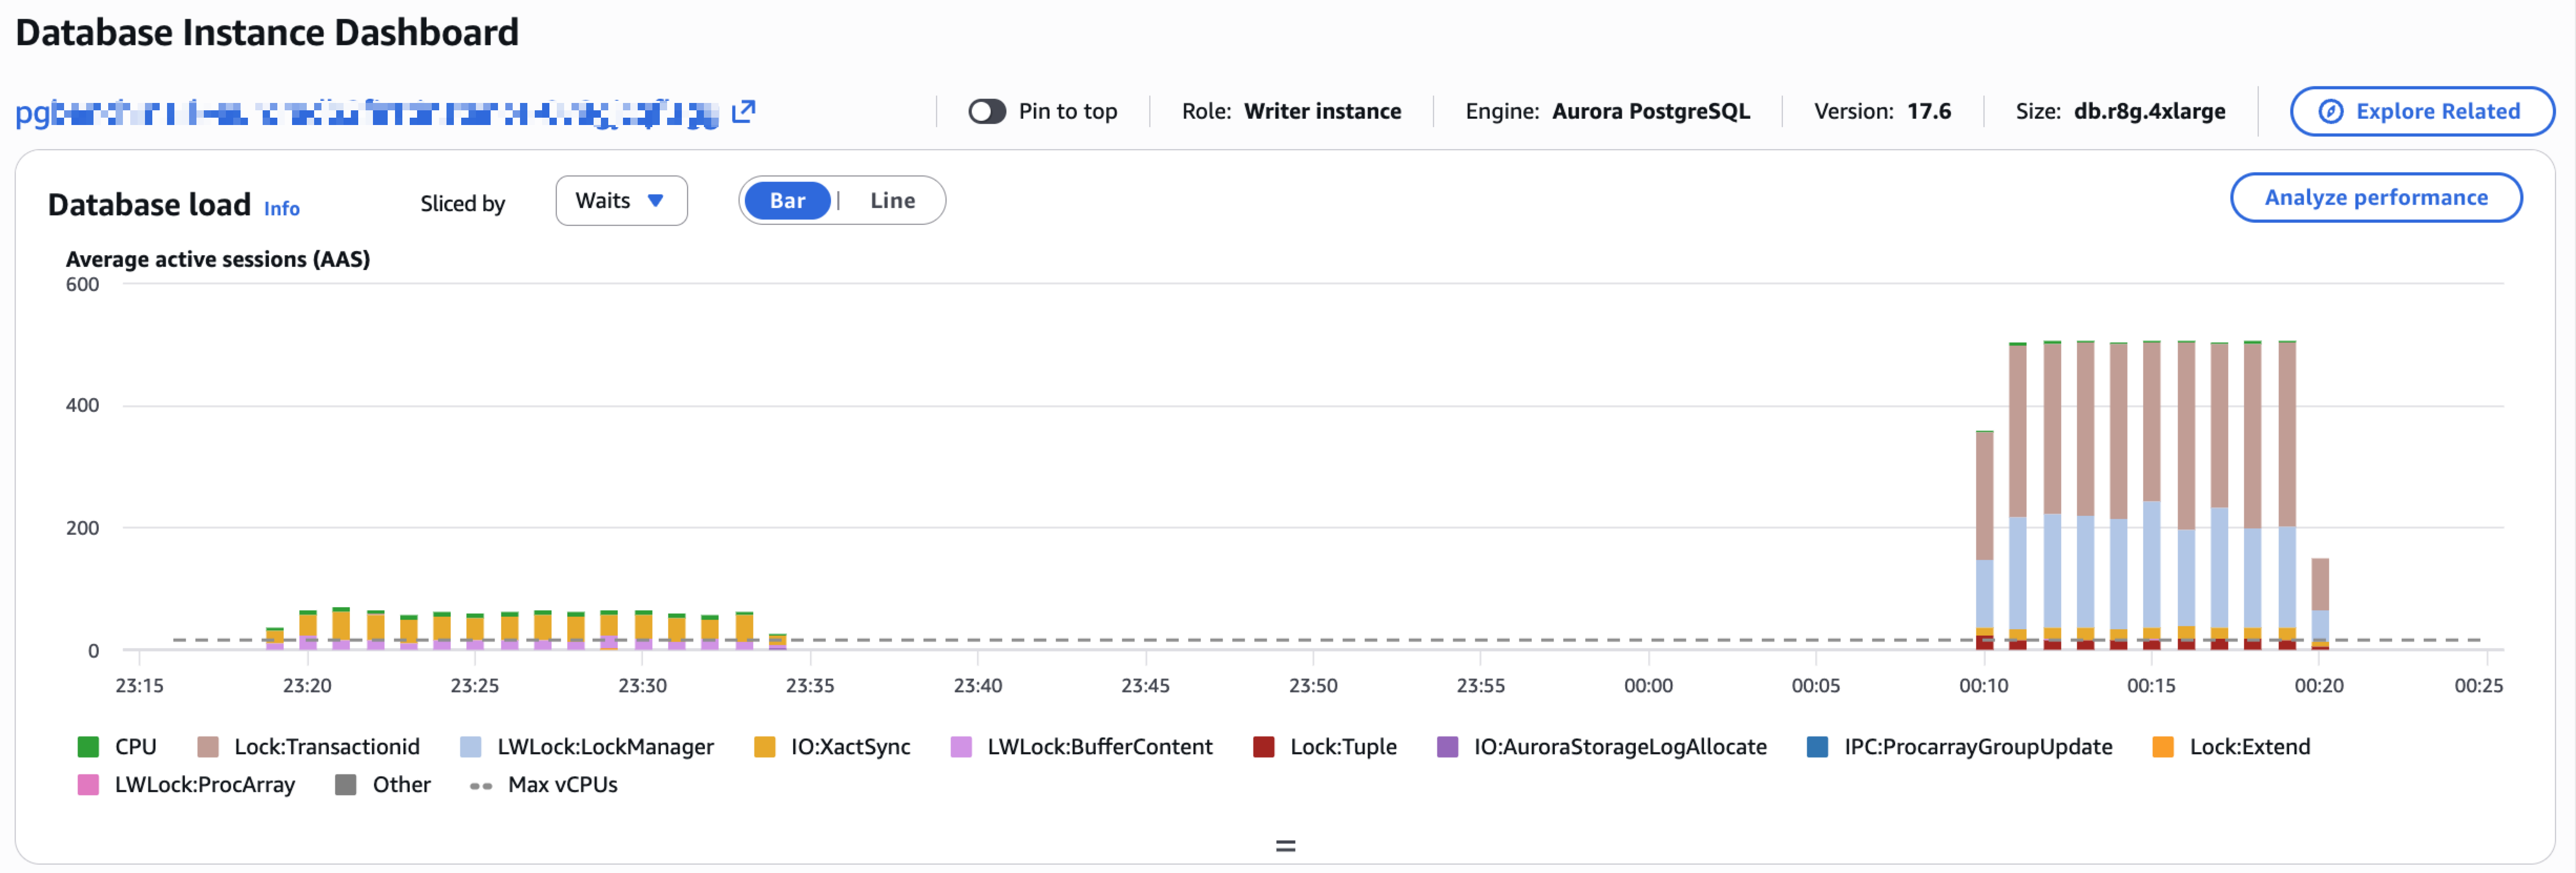
Figure 5: A comparison of DB Load chart for contentious workload and typical workload
The test workload revealed a common lock contention pattern that occurs in production systems. While performance remained stable under normal conditions, it degraded during simulated flash sales when many users competed for limited inventory. This pattern appears in several business scenarios:
- Limited voucher or discount codes available for redemptions.
- Inventory management during high-demand sales.
- Tracking access to a popular feature with concurrent users.
- Tracking page views or blog views for a popular article.
- Financial transaction processing with internal/contra account balances.
Row-level locking maintains data consistency but can create performance bottlenecks during high concurrency in high-contention scenarios. The following sections explain how to identify these issues using PostgreSQL monitoring tools and CloudWatch Database Insights and implement solutions to reduce lock contention.
Monitoring locks
PostgreSQL and CloudWatch offer several ways to detect and analyze lock contention. The following sections cover system views and functions, the pgrowlocks extension, and the log_lock_waits parameter.
Monitoring locks using system views and functions
PostgreSQL provides system views and functions to identify blocking sessions. The pg_stat_activity view combined with the pg_blocking_pids() function shows lock relationships between sessions. The following query returns the blocking process ID (pid) and details of the blocked process:
For this example, we observe that the waiting session (pid 2053) is trying to acquire the Lock:transactionid lock and is blocked by another session (pid 1943). We can find more information about locks in the pg_locks system view using the current transaction ID (output of the txid_current function) from the previous output (3194633):
The backend process 1943 holds the transactionid lock (granted = true), while process 2053 waits to acquire it (granted = false). The pg_locks view shows only the transactionid lock in shared memory, not the individual row locks stored in data pages.
Examining row locks using the pgrowlocks extension
The pgrowlocks extension shows individual row locks.
Note: pgrowlocks performs a full table scan and may impact database performance. You can use the pgrowlocks extension in a test environment while analyzing row lock contention, but avoid using it in production environments.
Logging using the log_lock_waits parameter
The log_lock_waits parameter logs lock wait events that exceed deadlock_timeout (default 1 second) in the database log. The following is an example log excerpt when lock wait logging is enabled:
PostgreSQL will also record when a waiting session is able to acquire the lock:
Cleanup
If you plan to follow Part 2 of this series, keep the resources you created here. Part 2 reuses the same schema and workload, so you can go straight to the conclusion.
If you’re not continuing to Part 2, clean up the resources that you created so they stop contributing to your AWS bill. Retaining a database cluster, EC2 instance, or Advanced mode Database Insights beyond what you need for this post will continue to incur charges.
- If you used the CloudFormation template from the sample-aurora-rds-workload-simulation-script repo (
setup-rds-pgsql-cfn.ymlorsetup-aurora-pgsql-cfn.yml), you can clean up by deleting the stack, which removes the EC2 client host, database instance or cluster, and other resources the template created, in one step. - If you created a new EC2 instance outside of CloudFormation to run the workload scripts, it will continue to incur cost while running. Check the instance’s Amazon Elastic Block Store (Amazon EBS) volume persistence settings to understand whether its volumes are deleted automatically on termination, then terminate the instance. If any volumes are retained, delete them separately.
- If you created a new Aurora cluster to simulate the workload in this post, delete each DB instance in the cluster first, then delete the cluster itself.
- If you enabled CloudWatch Database Insights Advanced mode on an existing cluster for this post, Advanced mode and its retention period continue to incur charges until you turn it off. You can switch back to Standard mode if you no longer need it. However, for production workloads, we recommend keeping Advanced mode enabled.
Conclusion
PostgreSQL provides system views like pg_stat_activity and pg_locks to identify blocking sessions, and the pgrowlocks extension shows individual row locks. The log_lock_waits parameter logs lock wait events exceeding the deadlock_timeout threshold. However, these traditional monitoring approaches have limitations. Logs capture lock contention reactively, meaning the actual contention period may have passed by the time you review them. Querying pg_stat_activity and pg_locks requires constant monitoring to catch lock contention as it occurs, making it difficult to identify patterns or analyze historical trends. The pgrowlocks extension performs full table scans and should be avoided in production environments because of its performance impact.
In Part 2 of this series, we will demonstrate how CloudWatch Database Insights provides comprehensive visibility into lock contention through unified monitoring of database metrics, logs, and lock analysis. Database Insights captures detailed blocking relationships and supports historical analysis without the overhead of manual queries or the reactive nature of log-based monitoring. We will also explore architectural patterns and configuration changes to prevent and resolve lock contention in production workloads.
Acknowledgements
Special thanks to Deepak Lingesan, Amol Bhatnagar, and Josna Pereira for their contributions to this post.