AWS Database Blog
Resolve Amazon Aurora PostgreSQL lock contention with Database Insights: Part 2
In Part 1 of this series, we covered PostgreSQL’s locking internals, demonstrated how row-level lock contention degrades throughput, and introduced basic monitoring techniques using system views (pg_stat_activity, pg_locks), the pgrowlocks extension, and the log_lock_waits parameter. These traditional methods have limitations, though: logs capture contention reactively after it occurs, querying system views requires constant monitoring to catch issues in real time, and the pgrowlocks extension performs full table scans that can impact production performance. In this post, we demonstrate how Amazon CloudWatch Database Insights provides comprehensive visibility into lock contention through unified monitoring and historical analysis. We show you how to use the Lock Analysis features, including the Lock Tree visualization that reveals blocking relationships between sessions. We then present practical solutions to resolve and prevent lock contention, including immediate fixes, configuration changes, and architectural patterns such as optimistic concurrency control, asynchronous processing, and row splitting.
Prerequisites
In this post, we will use the same schema and workload that we used in Part 1: the pgsql-db-setup.sql schema and the simulate_avg_load.sh / simulate_contentious_load.sh scripts from the sample-aurora-rds-workload-simulation-script repo. If you followed along in Part 1, you already have this environment set up.
To use the techniques described in this post, you need:
- An Amazon Aurora PostgreSQL-Compatible Edition cluster.
- CloudWatch Database Insights Advanced mode enabled on your Aurora cluster.
- An EC2 instance with PostgreSQL client such as psql to connect to the Aurora cluster.
Although we demonstrate the concepts using an order placement workload, you can follow the same investigation approach and queries for any workload where you observe lock contention.
To reproduce the order-placement workload and the exact lock contention scenario shown in this post, clone the sample-aurora-rds-workload-simulation-script repository. It contains the schema, data generator, and workload simulation scripts referenced throughout this two-part series. See the repo’s PostgreSQL/README.md for full setup instructions to create an Aurora cluster or RDS instance with a connected Amazon Elastic Compute Cloud (Amazon EC2) client host using the provided AWS CloudFormation templates.
Identifying lock contention using Database Insights
When CloudWatch Database Insights detects lock contention, it automatically queries pg_stat_activity and pg_locks views, and calls the pg_blocking_pids() function to capture detailed information about blocking and blocked sessions. To use Lock Analysis with Amazon Aurora PostgreSQL-compatible and Amazon Relational Database Service (Amazon RDS) for PostgreSQL databases, you need to enable Advanced mode in Database Insights.
Using the Database Insights Lock Analysis feature
With Database Insights for Aurora PostgreSQL-compatible and RDS PostgreSQL databases, you can analyze lock contention through multiple dimensions in the Database Load chart.
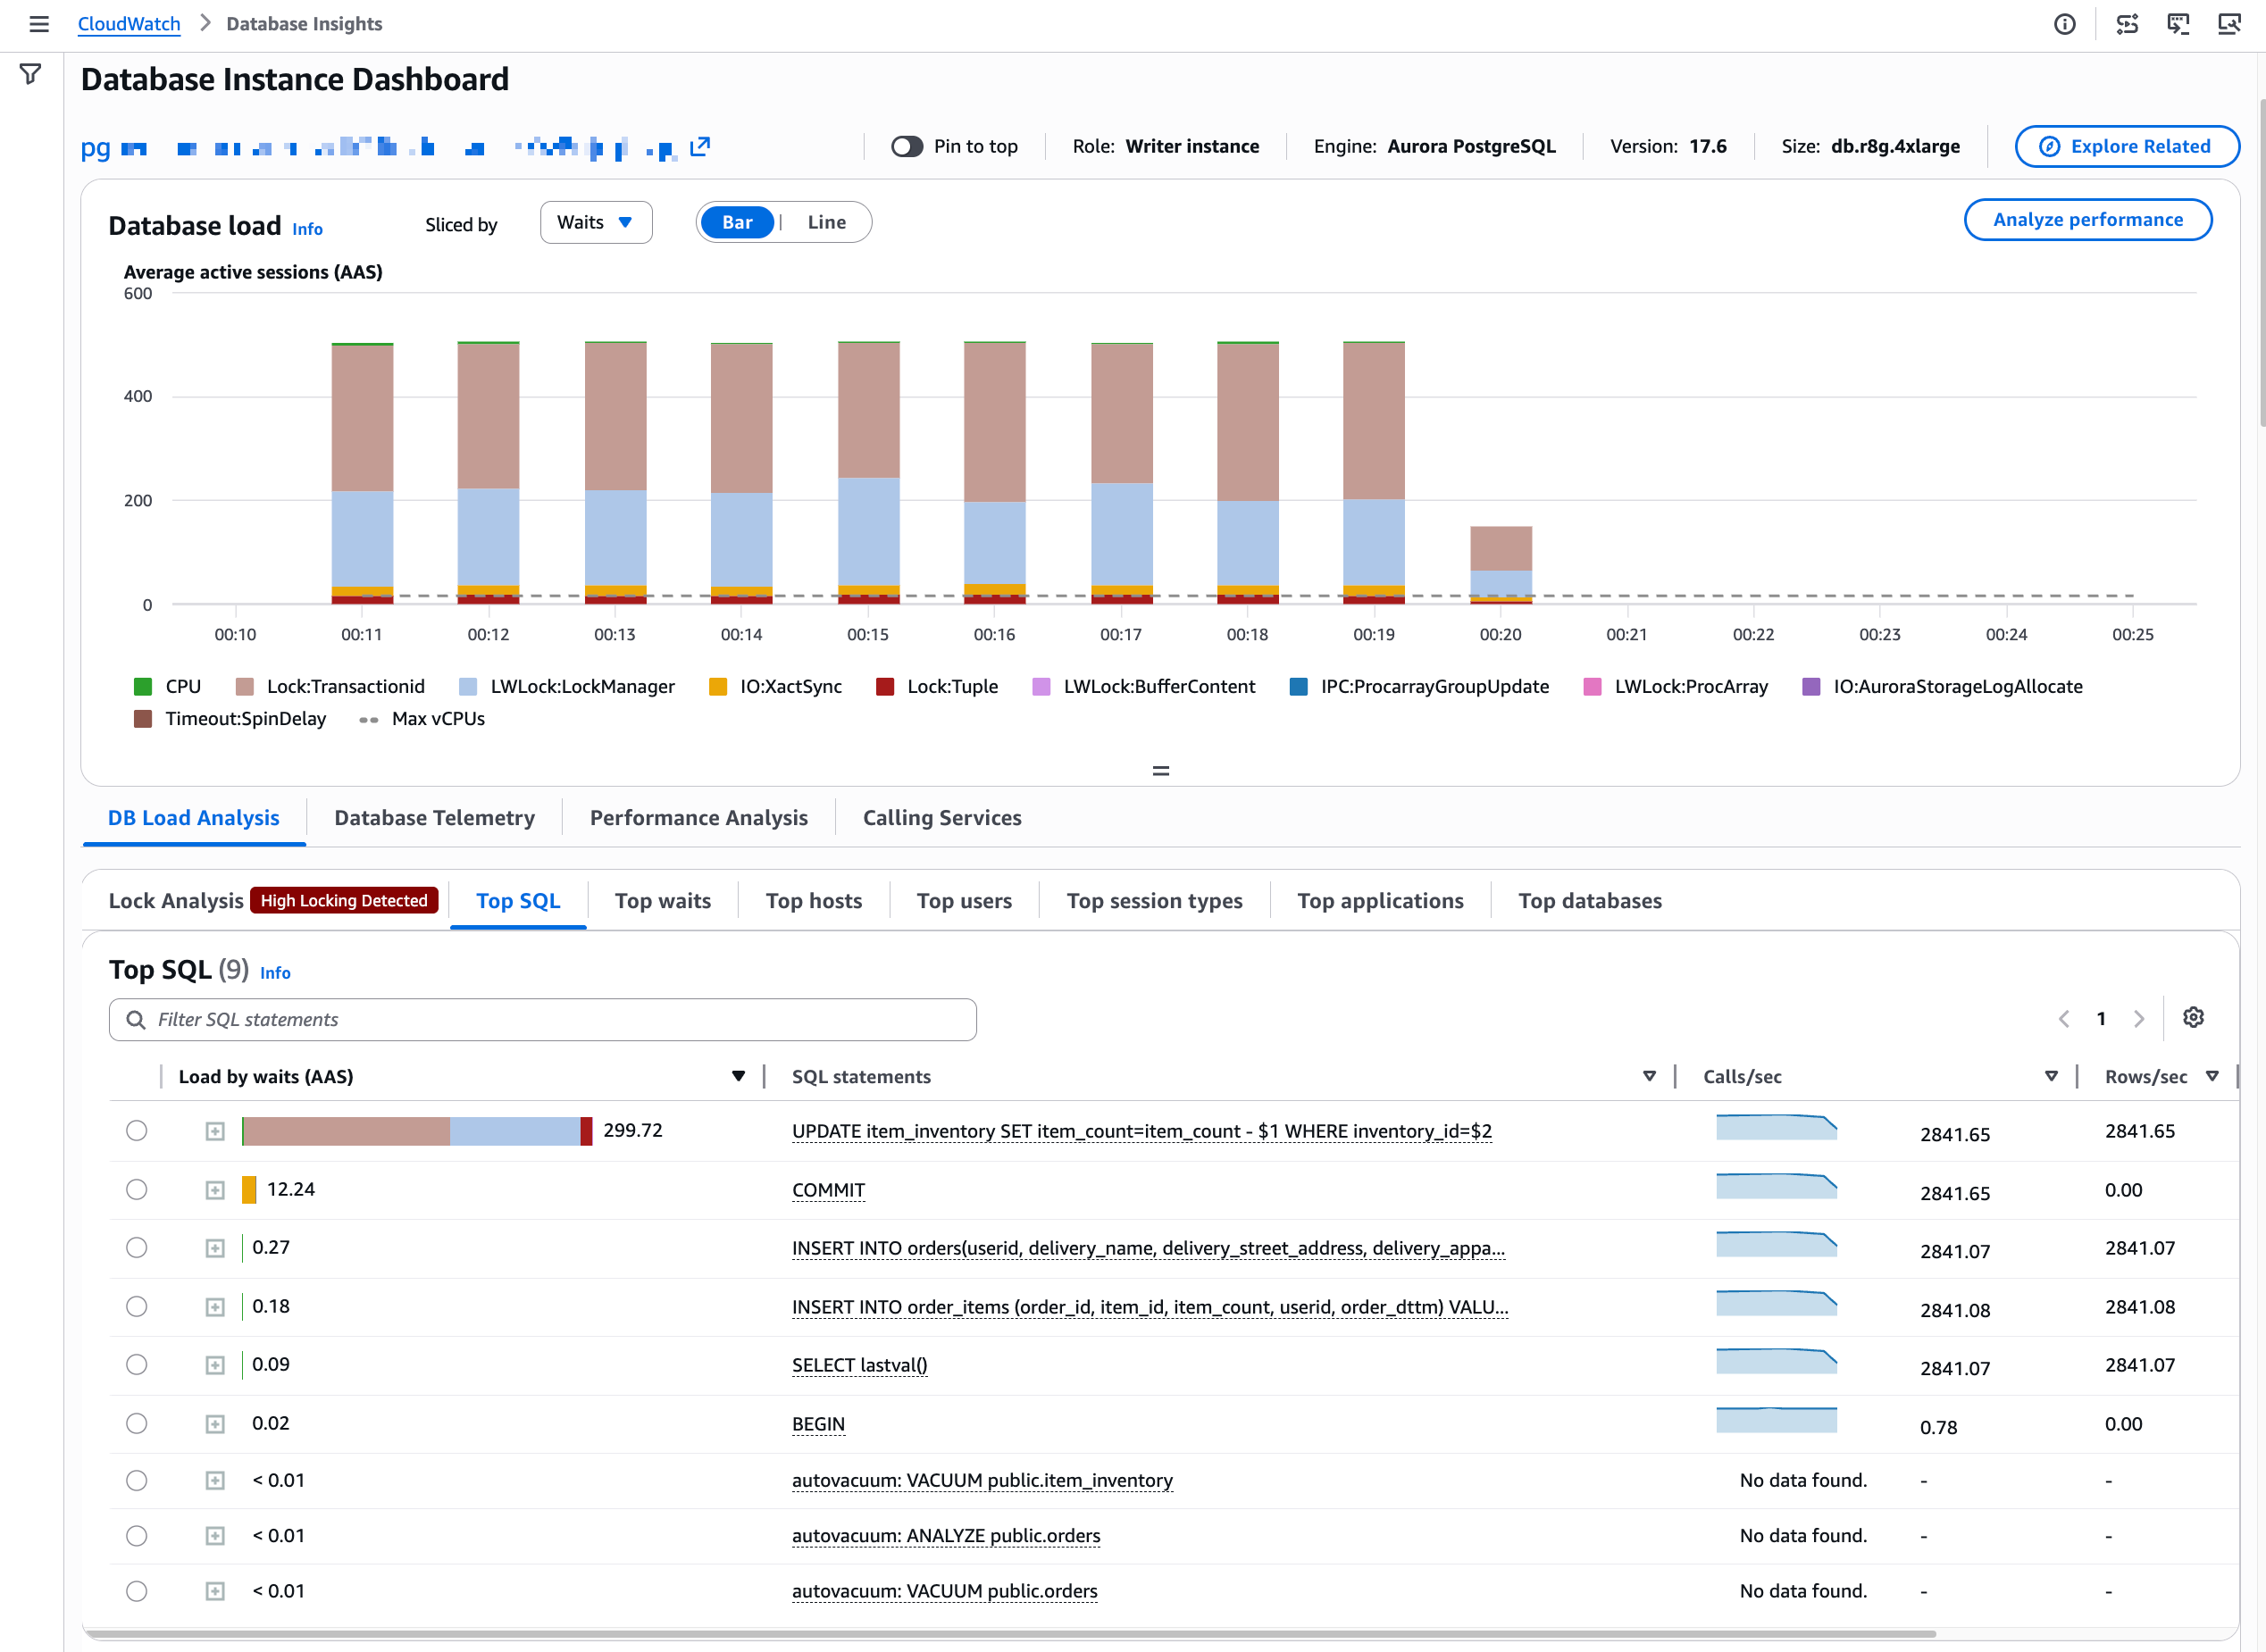
Figure 1: Database Load chart during lock contention
You can use the Sliced by menu to view load by Blocking SQL. This visualization helps identify persistent blockers and their impact on database load.
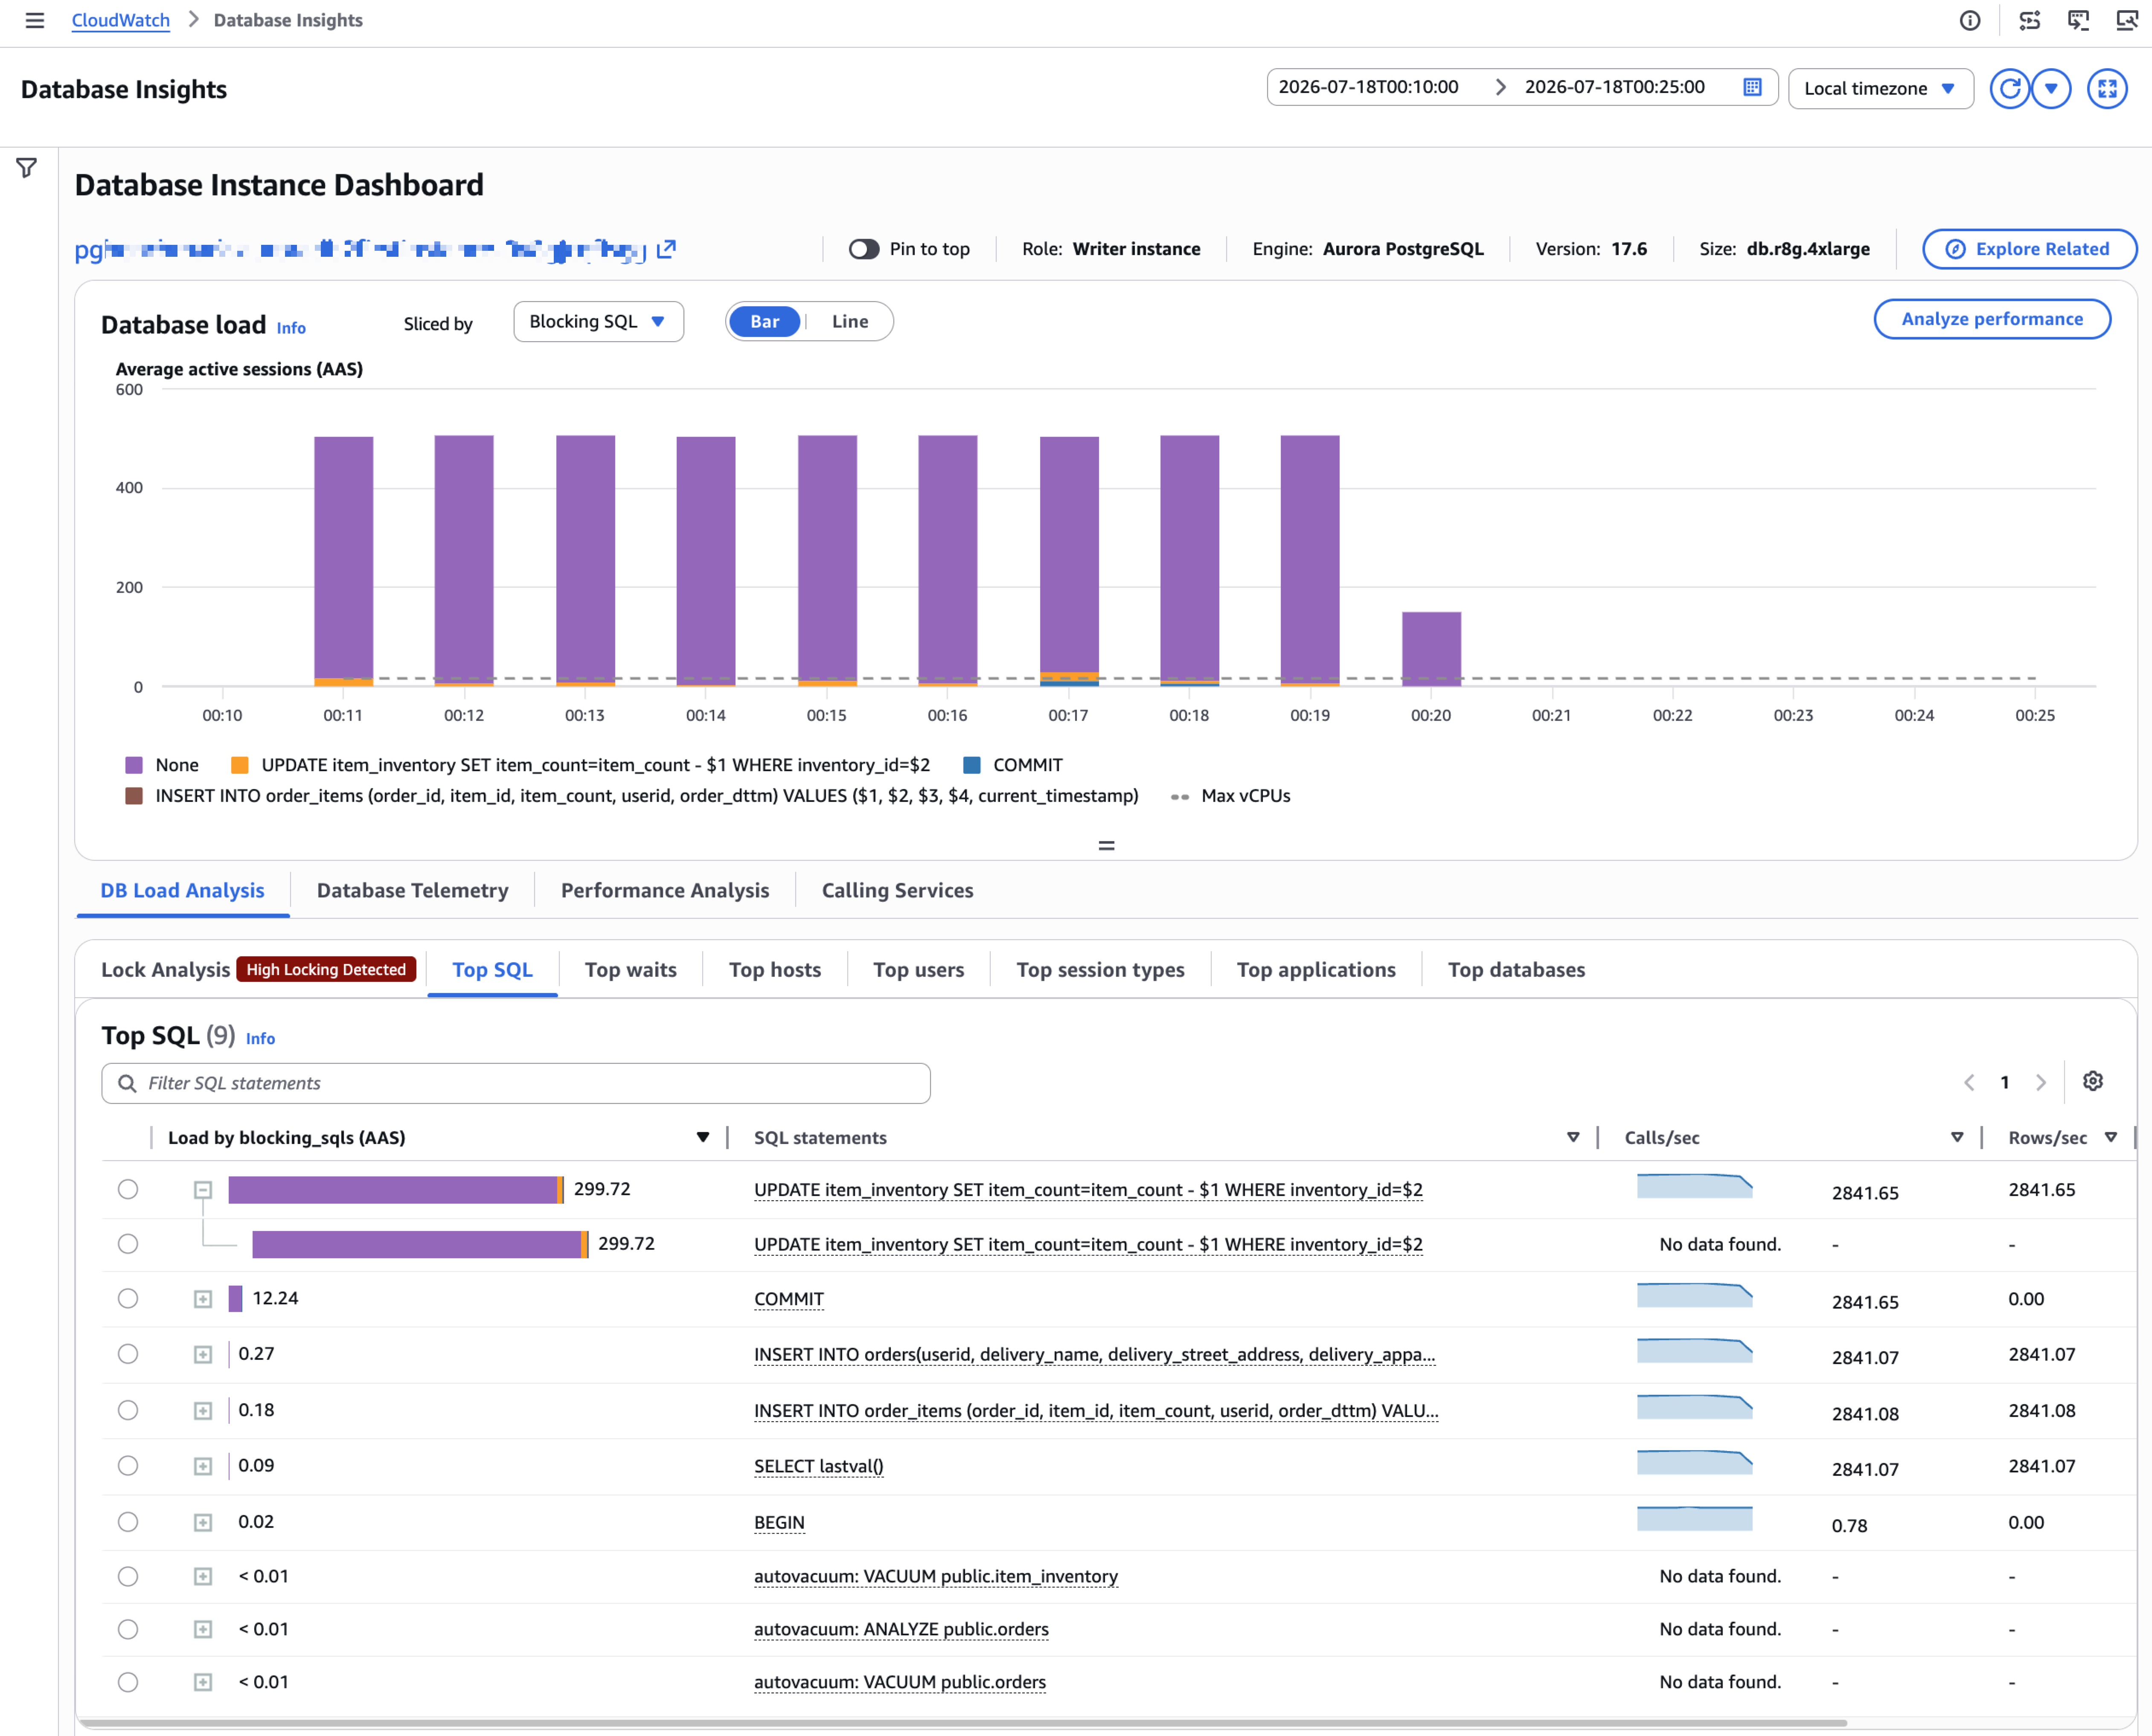
Figure 2: Database Load sliced by blocking SQLs
The Top SQL tab correlates blocking SQLs with their impact on database load. The Load by blocking_sqls column displays a color-coded visualization showing:
- Contribution of each blocking SQL to overall database load.
- Relationships between blocking and blocked queries.For example, the query
UPDATE item_inventory SET item_count=item_count - ? where inventory_id=?is blocked by other update statements targeting the same inventory rows.
Database Insights analyzes lock contention through multiple dimensions:
- SQL statements.
- User sessions.
- Database objects (transactions, tables, and rows)
Using the Lock Tree to analyze lock contention
The Lock Tree visualization in Database Insights’ Lock Analysis tab shows blocking relationships between database sessions. This hierarchical view reveals lock request dependencies and session interactions.
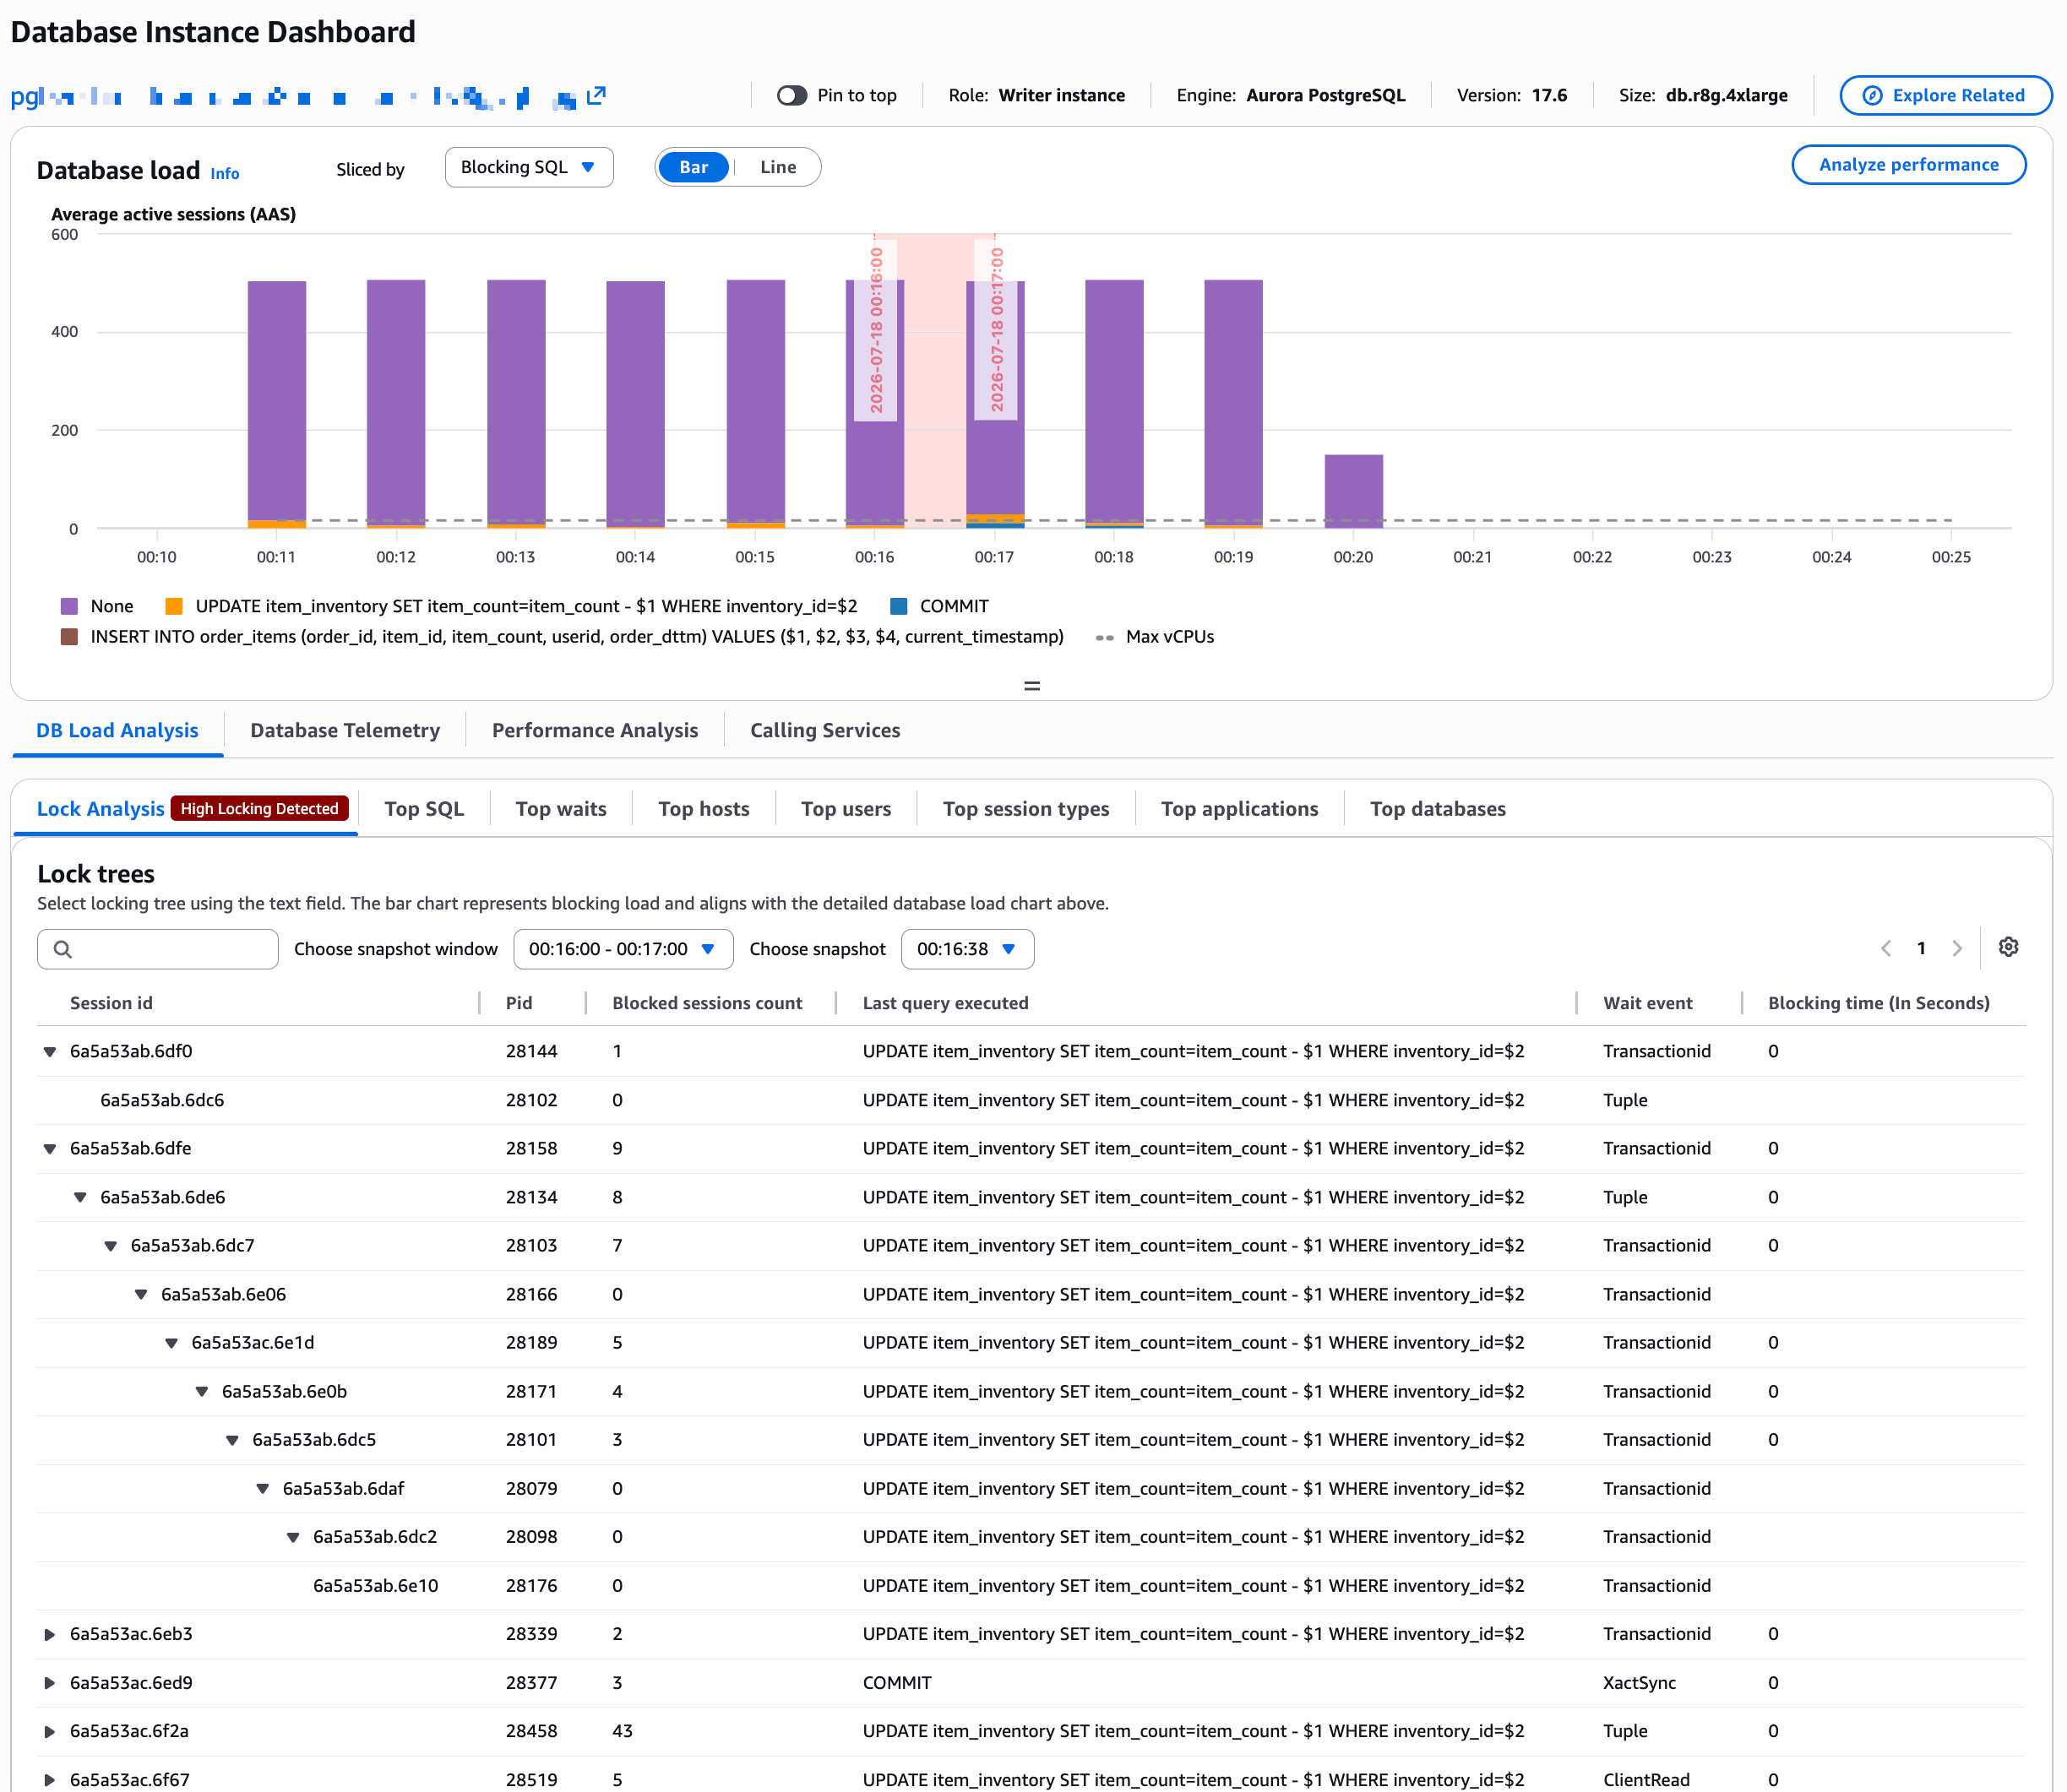
Figure 3: Lock Tree in CloudWatch Database Insights
The Lock Tree displays key information about blocking relationships:
- Number of blocked sessions per blocking session.
- Last SQL statement executed in blocked and blocking sessions.
- Multi-level blocking chains where sessions both wait for and block others.
Default Lock Tree columns include:
- Session ID.
- Process ID.
- Blocked Session Count.
- Last Query Executed.
- Wait Event.
- Blocking Time.
Database Insights provides additional lock-related columns that you can enable for detailed analysis:
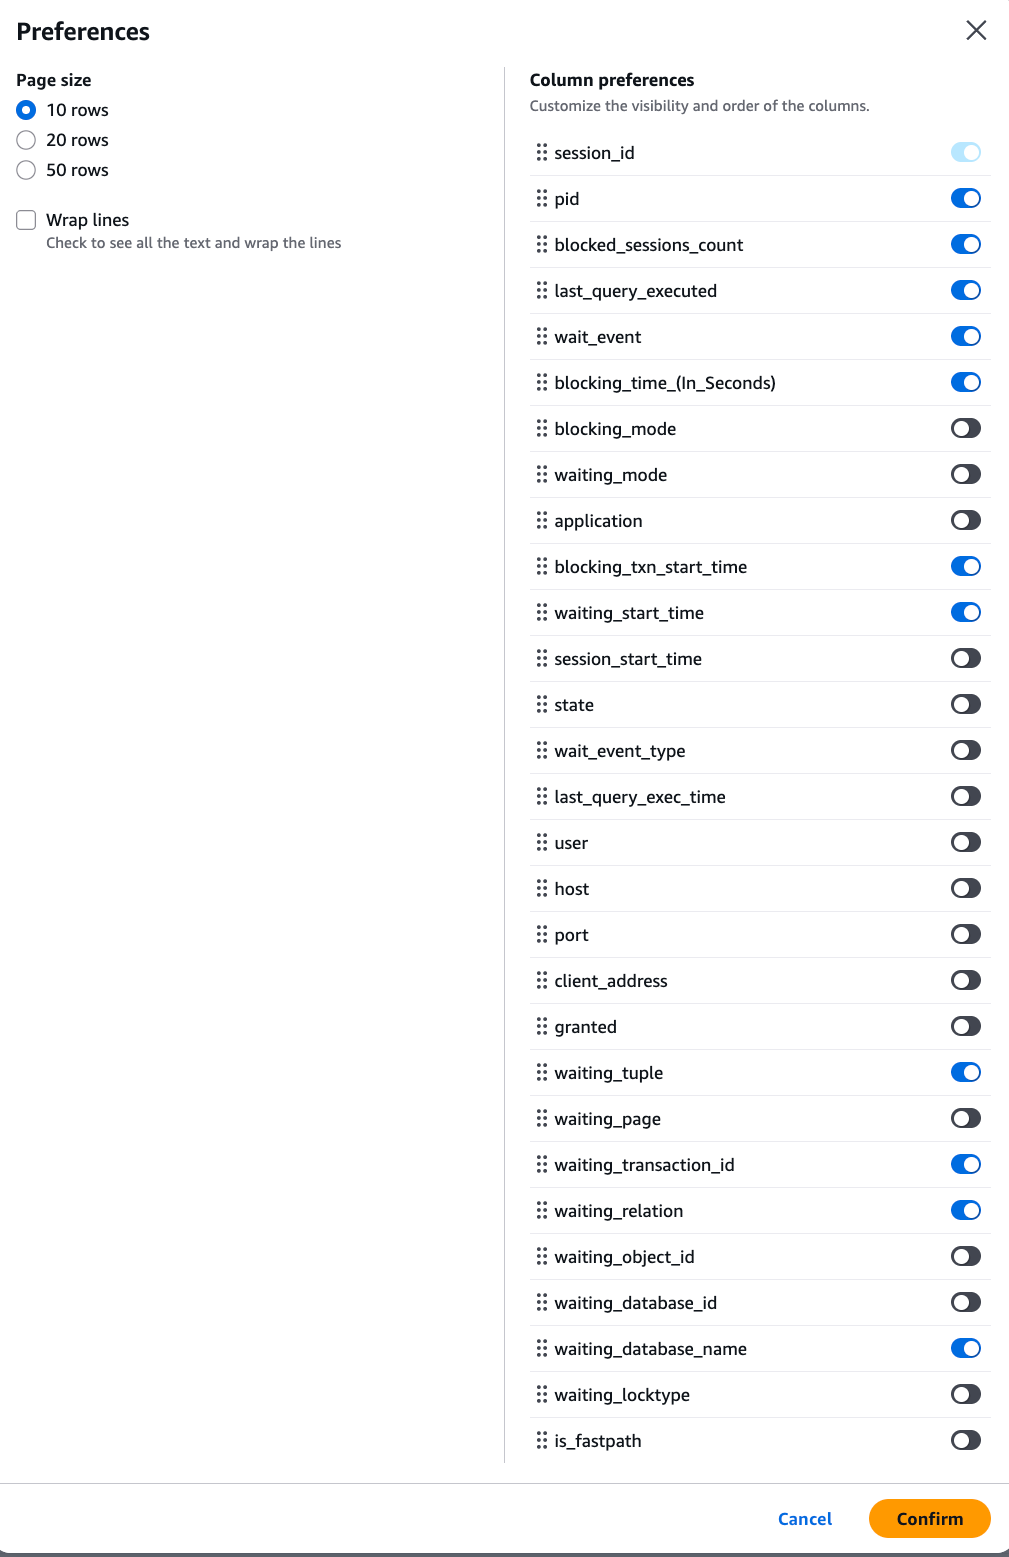
Figure 4: Additional lock related columns that can be enabled for CloudWatch Lock Tree
Enabling additional columns can be helpful in identifying the object or specific row that is under contention:
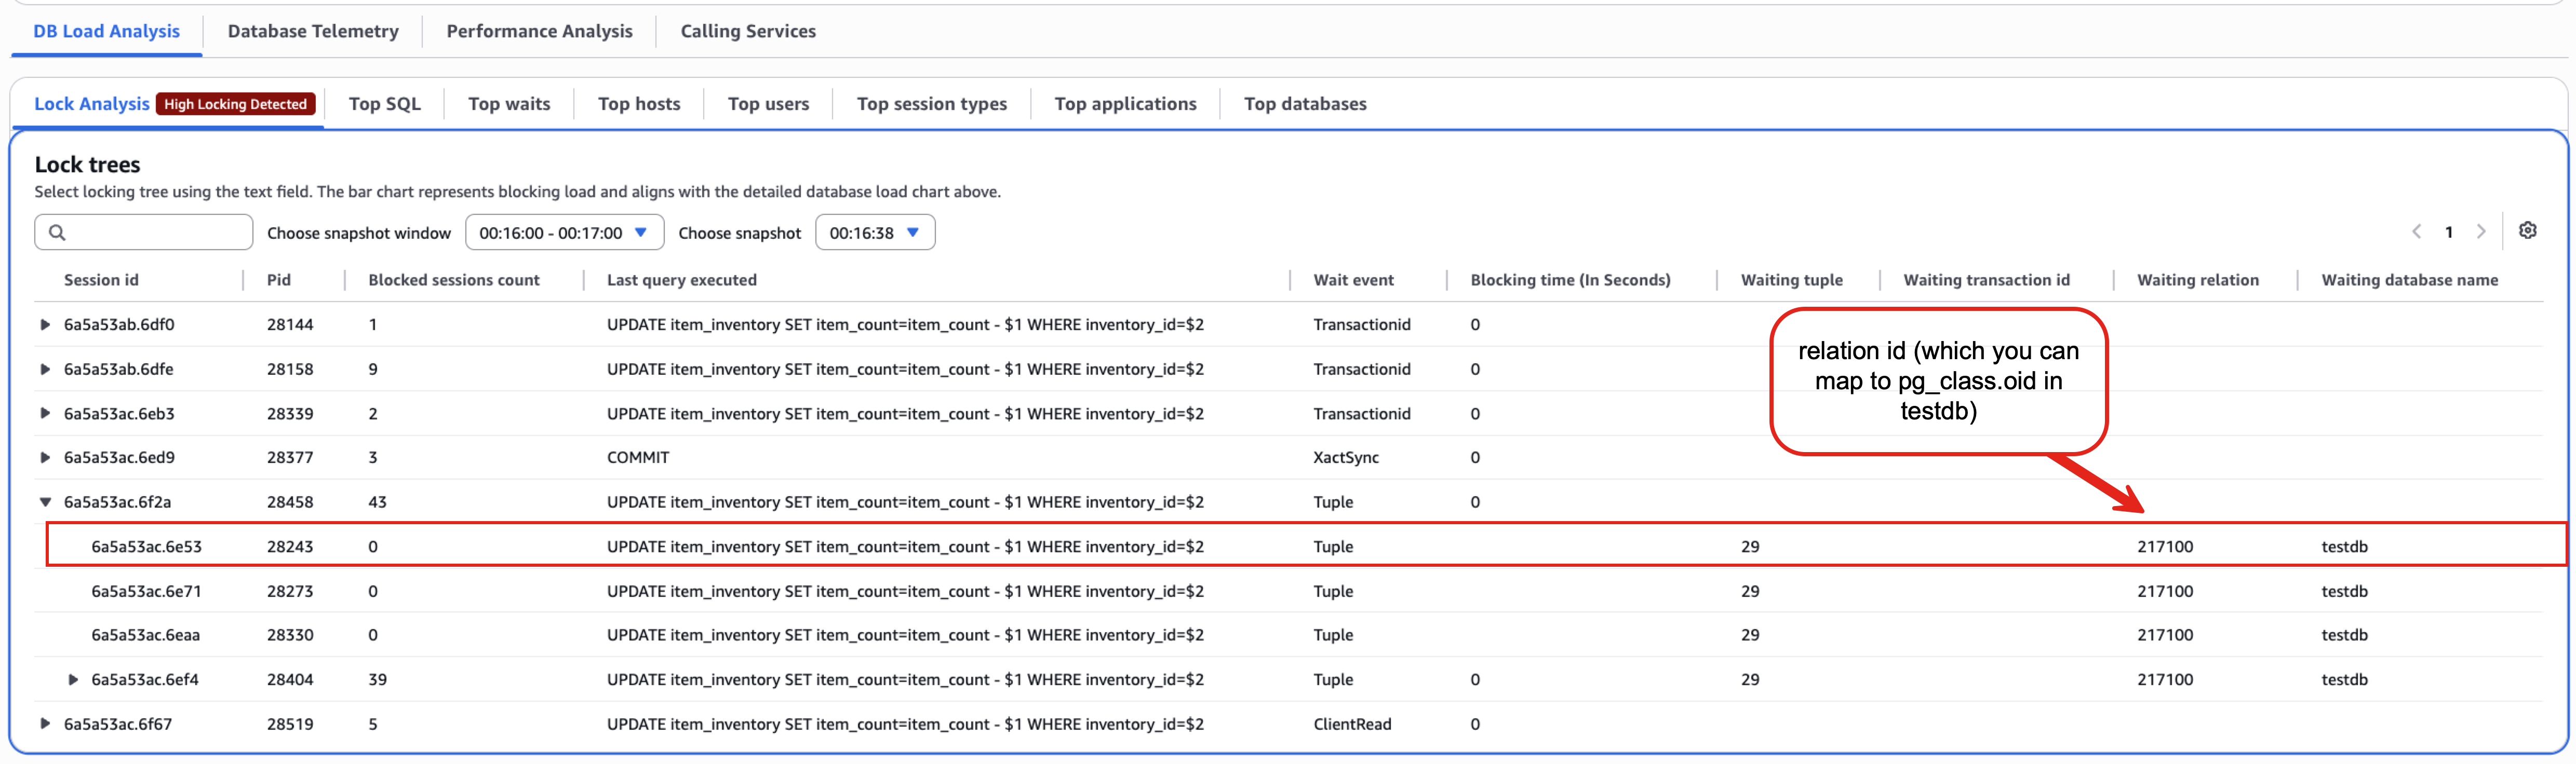
Figure 5: Identifying resources under lock contention using Lock tree in CloudWatch Database Insights
The Lock Tree displays sessions grouped by blocking session ID, showing you the last query that the session executed and the resource that it’s currently waiting on (wait event). In this example, we can see that multiple sessions trying to update item_inventory are blocked by a lock on the same tuple (29) / transactionid (217100). The pid corresponds to the process ID of the PostgreSQL backend process on the Aurora PostgreSQL instance.
Resolving lock contention
Lock contention resolution requires a systematic approach addressing both immediate issues and root causes. The following sections describe three strategies:
- Immediate fixes for rapid recovery.
- Configuration changes for system resilience.
- Architectural patterns for contention prevention.
Immediate resolution – Query termination
Lock contention can occur from uncommitted transactions or long-running updates blocking concurrent operations. PostgreSQL provides two administrative functions to resolve blocking sessions:
pg_cancel_backend() cancels the query that a session is currently executing while maintaining the session. For example, to cancel the query in one of the blocked sessions (with pid 28243), we can use:
pg_terminate_backend() ends the entire database session. For example, to terminate the blocking connection (with pid 28458), we can use:
Both functions require rds_superuser privileges and use the process ID from pg_stat_activity.pid, which is also available in the Lock Tree view in Database Insights’ Lock Analysis tab.
Best practice: Start with pg_cancel_backend() to allow graceful query termination. Use pg_terminate_backend() only when query cancellation fails or immediate session termination is necessary.
Intermediate resolution – Timeout parameters
PostgreSQL provides timeout parameters to automatically manage problematic transactions. By configuring these timeout parameters, you implement automated protection against lock contention and eliminate your need for manual intervention.
- idle_in_transaction_session_timeout: This parameter terminates sessions that remain idle within an open transaction after a specified duration. Aurora PostgreSQL sets this parameter to 86,400,000 ms (24 hours) by default in current versions (verify the default for your specific engine version in the parameter group documentation), helping prevent resource locks and supporting efficient VACUUM operations.
- statement_timeout: This parameter controls the maximum execution time for individual SQL statements, preventing long-running queries from monopolizing system resources. It applies separately to each statement in multi-statement transactions.
- transaction_timeout (PostgreSQL 17+): This parameter sets an overall time limit for complete transactions, covering both explicit and implicit transactions. It provides comprehensive protection against extended lock contention from long-running transactions.
- lock_timeout: This parameter defines how long a session waits to acquire a lock before failing. It prevents sessions from indefinitely waiting for locks, reducing resource consumption and deadlock risks.
You can configure these parameters through DB Parameter Group for Amazon RDS, DB Cluster Parameter Group for Amazon Aurora, or you can configure them at the user level by using ALTER USER. Set timeout values based on your workload’s baseline execution and transaction timing patterns.
Long-term resolution – Application design changes
Application architecture changes provide long-term solutions to lock contention. These design patterns modify how applications access and update contested database resources.
Query optimization to reduce lock contention
Long-running updates increase lock duration and contention probability. To minimize lock duration:
- Analyze execution plans to identify missing indexes, inefficient WHERE clauses, and full table scans.
- Optimize concurrent operations by creating indexes on frequently used WHERE clause columns.
- Optimize batch operations by breaking large updates into smaller batches, and limit rows locked in each transaction.
- Use smaller batch sizes to reduce lock duration while maintaining data consistency within each transaction.
Asynchronous processing with queues
Asynchronous processing decouples contentious operations from critical user-facing workflows:
- Requests enter a queue for immediate user response.
- Background processes batch and execute database updates.
- Your application should implement error handling and user notification for failed operations.
This pattern can help minimize lock contention, though you should implement error handling and user notification for failed operations.
Minimize lock duration in transactions
Holding database locks during non-database operations creates unnecessary contention. The following example shows a common problematic pattern where locks are held during user interaction and API calls:
This code (FOR UPDATE) acquires a ROW SHARE LOCK at the start, which prevents concurrent sessions from accessing the row during user input and payment processing.
A better approach separates user interactions and API calls from the database transaction:
Optimistic concurrency control
Optimistic concurrency control suits transactions requiring immediate consistency. This pattern:
- Uses a version column to track row changes.
- Replaces
SELECT FOR UPDATElocks with a plainSELECT. - Verifies the version number in the
UPDATEto skip the update if the row was modified. - Rolls back if the update didn’t affect any rows.
- Requires retry logic with exponential backoff to handle rollbacks caused by conflicts.
Common ORMs like Hibernate and Entity Framework provide built-in support for this pattern.
Convert updates to inserts
Using INSERT instead of UPDATE transforms contention patterns entirely. For example, instead of updating page view counters, insert individual visit records for each visitor. This pattern supports concurrent access to the same content while maintaining accurate counts through aggregation queries. The pattern works particularly well for metrics collection, audit trails, and event logging.
Split row pattern for high-contention data
Row splitting distributes lock contention across multiple records for frequently accessed items. To apply this pattern to the example covered in this post, we will require schema changes: a modified inventory table with an item selector column, and a metadata table tracking row counts.
The repo implements this pattern as two additional tables, kept separate from item_inventory so you can compare before/after behavior on the same dataset, rather than altering the original table in place:
item_inventory_striped: the inventory table split into multiple rows per item, using anitem_stripe_idcolumn (equivalent to the item_selector column described earlier).item_inventory_striping_config: tracks how many stripes each item was split into (equivalent to the popular_items metadata table described earlier).
See pgsql-db-setup.sql in the repo if you want to see this alongside the rest of the schema.
To handle the split rows, modify your application logic as follows. First, check if an item uses row splitting:
Regular items use a single row with stripe ID 1:
Popular items use random row selection to distribute updates:
The random row selection pattern can help reduce lock contention, though actual results depend on your schema, concurrency patterns, and workload characteristics and it might not remove contention entirely. PostgreSQL offers two additional mechanisms to avoid long lock waits during concurrent updates, and the right choice depends on how you plan to handle the case where your target row is locked:
- NOWAIT: if the target row is locked, the statement raises an error immediately (
SQLSTATE 55P03, “lock not available”) instead of waiting. Your application must catch this error and decide whether to retry (typically against a different candidate row) or give up. This fits scenarios with a single specific target row and no interchangeable alternative, for example, updating one specific version-tracked row, as shown later in this section. - SKIP LOCKED: if a candidate row is locked, it’s silently excluded from the result. The query still succeeds, returning fewer (or zero) rows. There’s no error to catch. Your application instead checks the number of rows affected or returned and retries if it’s zero. This fits scenarios with multiple interchangeable candidate rows, such as the striped inventory rows introduced earlier.
NOWAIT and SKIP LOCKED are mutually exclusive modifiers on the same locking clause (FOR UPDATE NOWAIT or FOR UPDATE SKIP LOCKED, not both). You should choose one or the other based on whether your query has a single target row or several candidates to fall back on.
The repo’s place_order_optimized_and_reduced_contention.lua workload script puts the SKIP LOCKED approach into practice: it selects one unlocked stripe row per item with FOR UPDATE SKIP LOCKED, and retries (bounded) whenever the update affects zero rows because every stripe for that item was locked. You can reproduce it against your own environment:
- Stripe your existing inventory data. This populates
item_inventory_stripedanditem_inventory_striping_configas new tables (without modifyingitem_inventoryin place), so you can still run the original contentious-load workload againstitem_inventoryfor comparison. To simplify the demonstration, this script stripes every row initem_inventorywith the same default stripe count. In practice, you’d typically stripe only the specific hot/popular items that need it and copy the rest over unchanged: - Re-run the flash-sale simulation, this time against the striped inventory:
- In Database Insights, compare the
CommitThroughputmetric and the lock wait events for this run against the contentious run from Part 1.
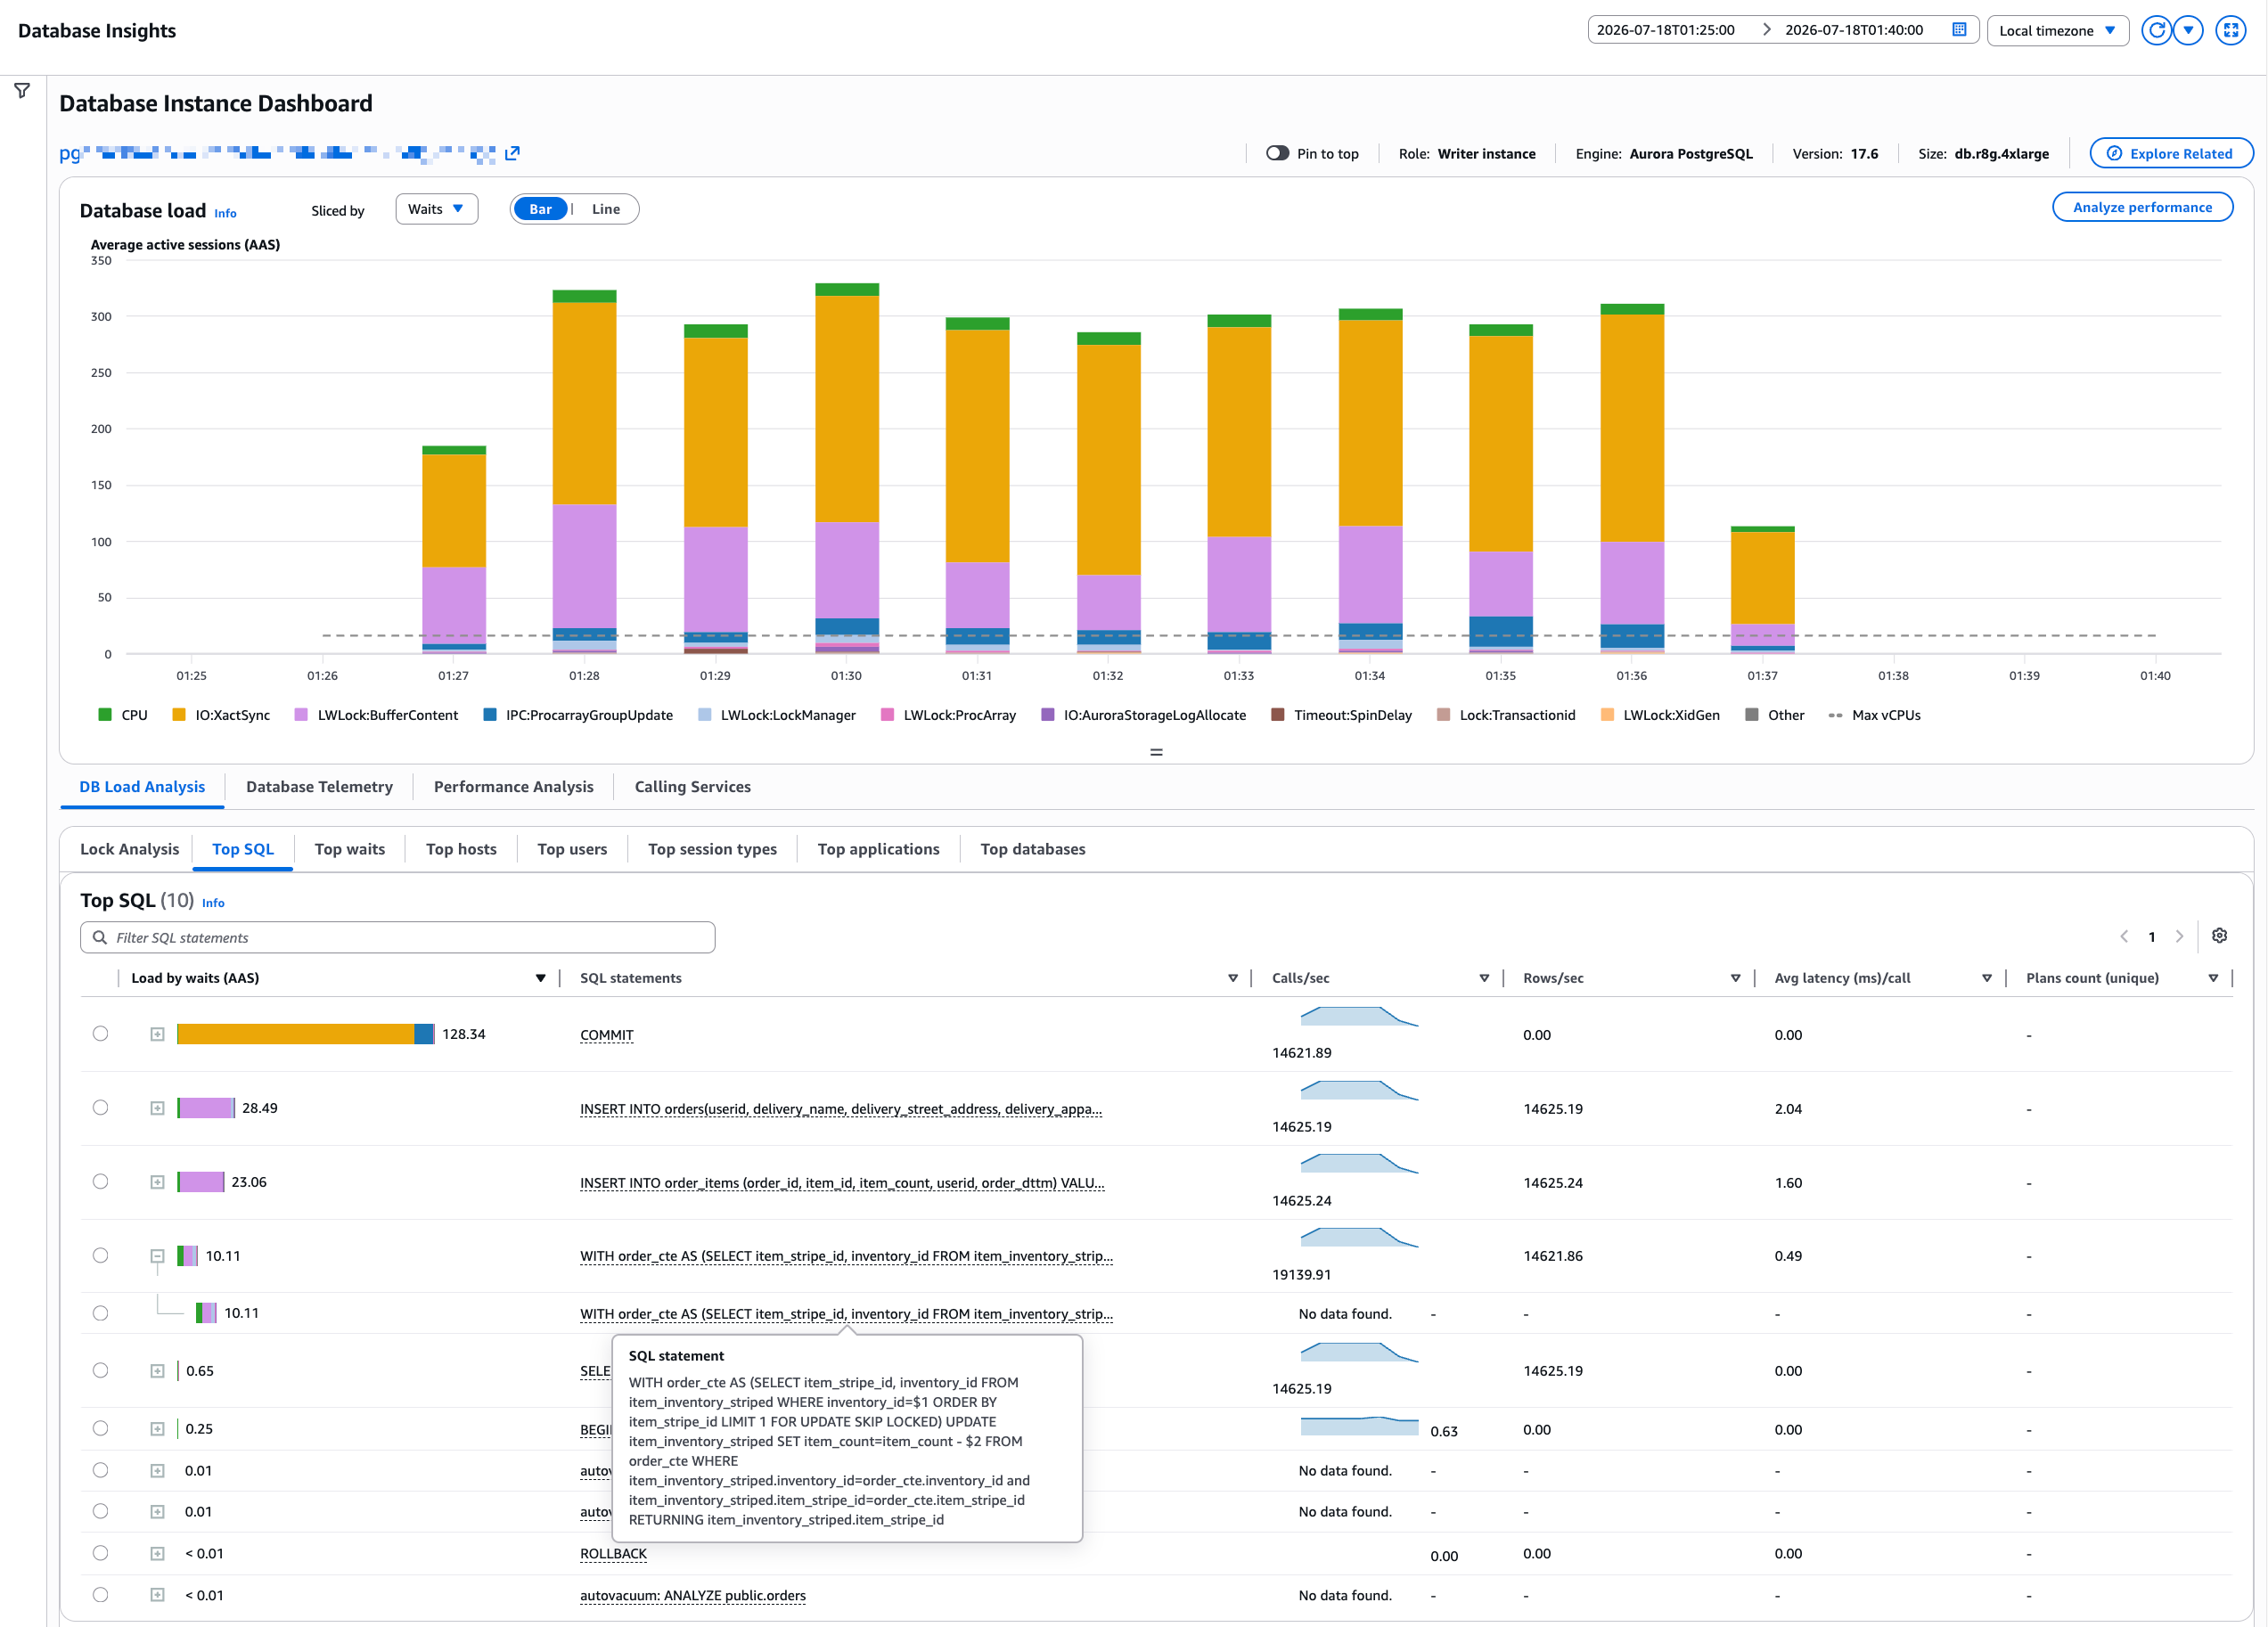
Figure 6: Database Insights Database Load Chart for the contentious workload with striped inventory
Spreading writes across multiple stripe rows per item means concurrent updates for the same item usually land on different rows instead of serializing on one, which helps minimize lock wait:
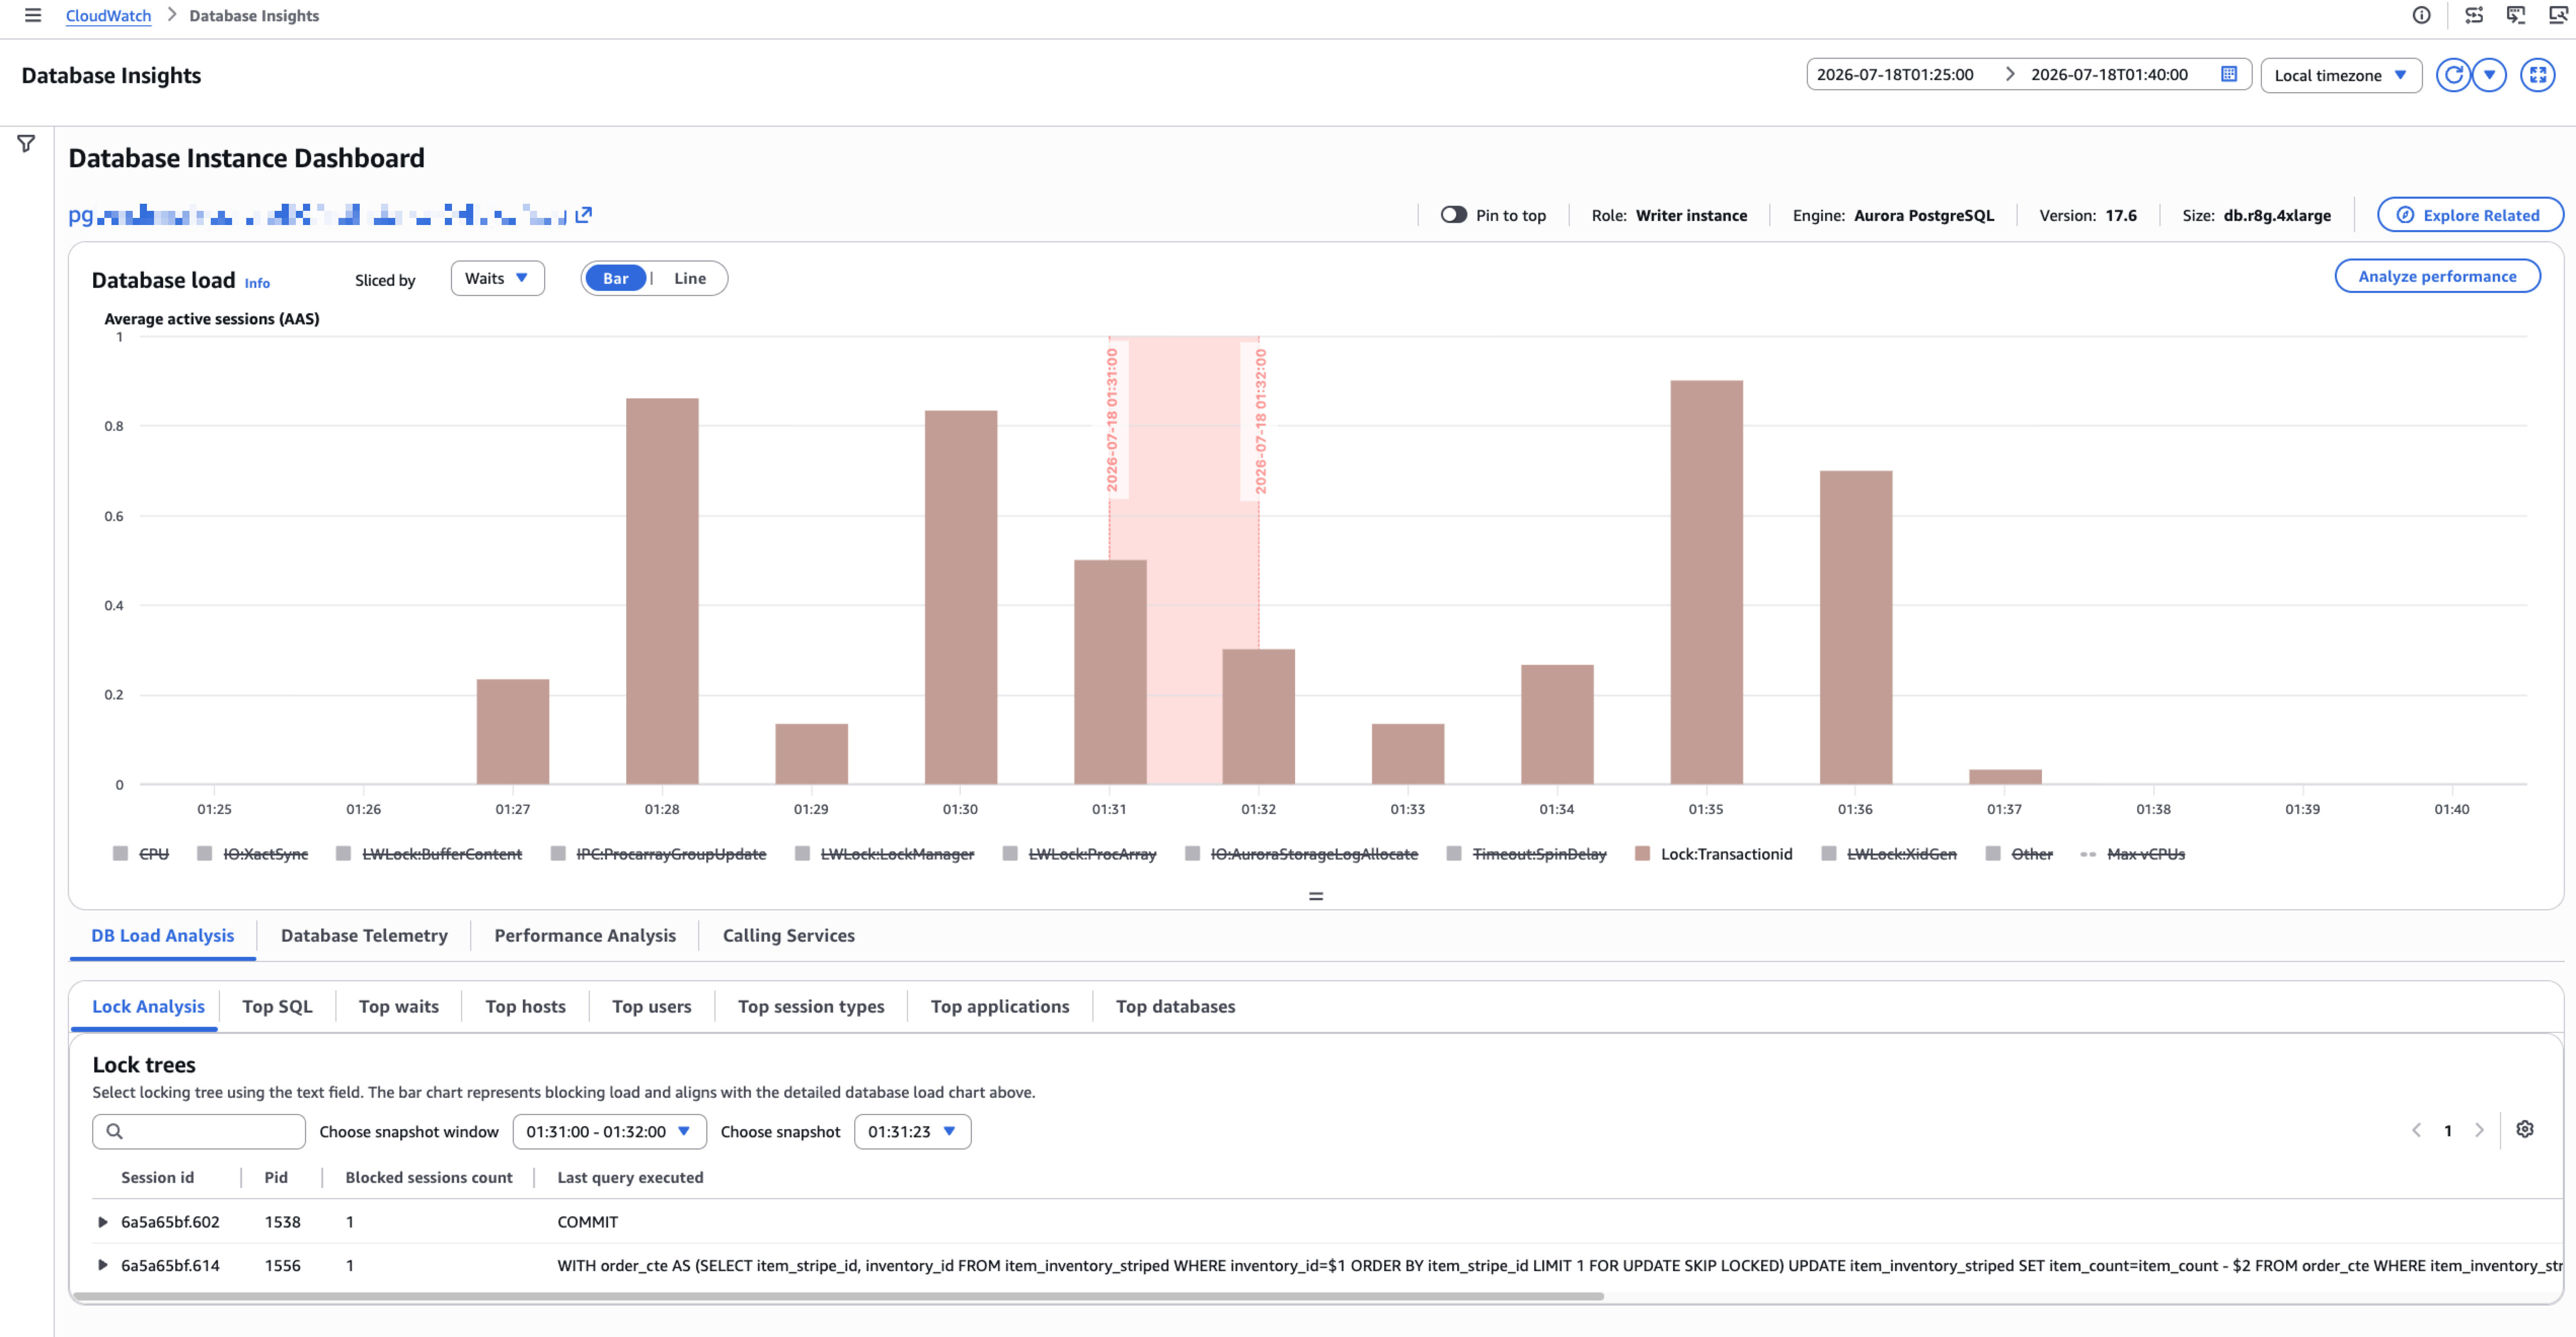
Figure 7: Lock-analysis chart showing reduced Lock:transactionid wait events for the striped run
By reducing lock wait time, the database handles significantly higher throughput. With inventory striped, the same flash-sale pattern (512 concurrent sessions targeting 25 popular items) now sustains more than 21,000 orders per second, up from approximately 4,900 under contention. For context, Part 1’s approximately 10,900 TPS baseline used only 128 sessions spread across the full inventory, so the striped result represents a significant improvement after accounting for the higher concurrency.
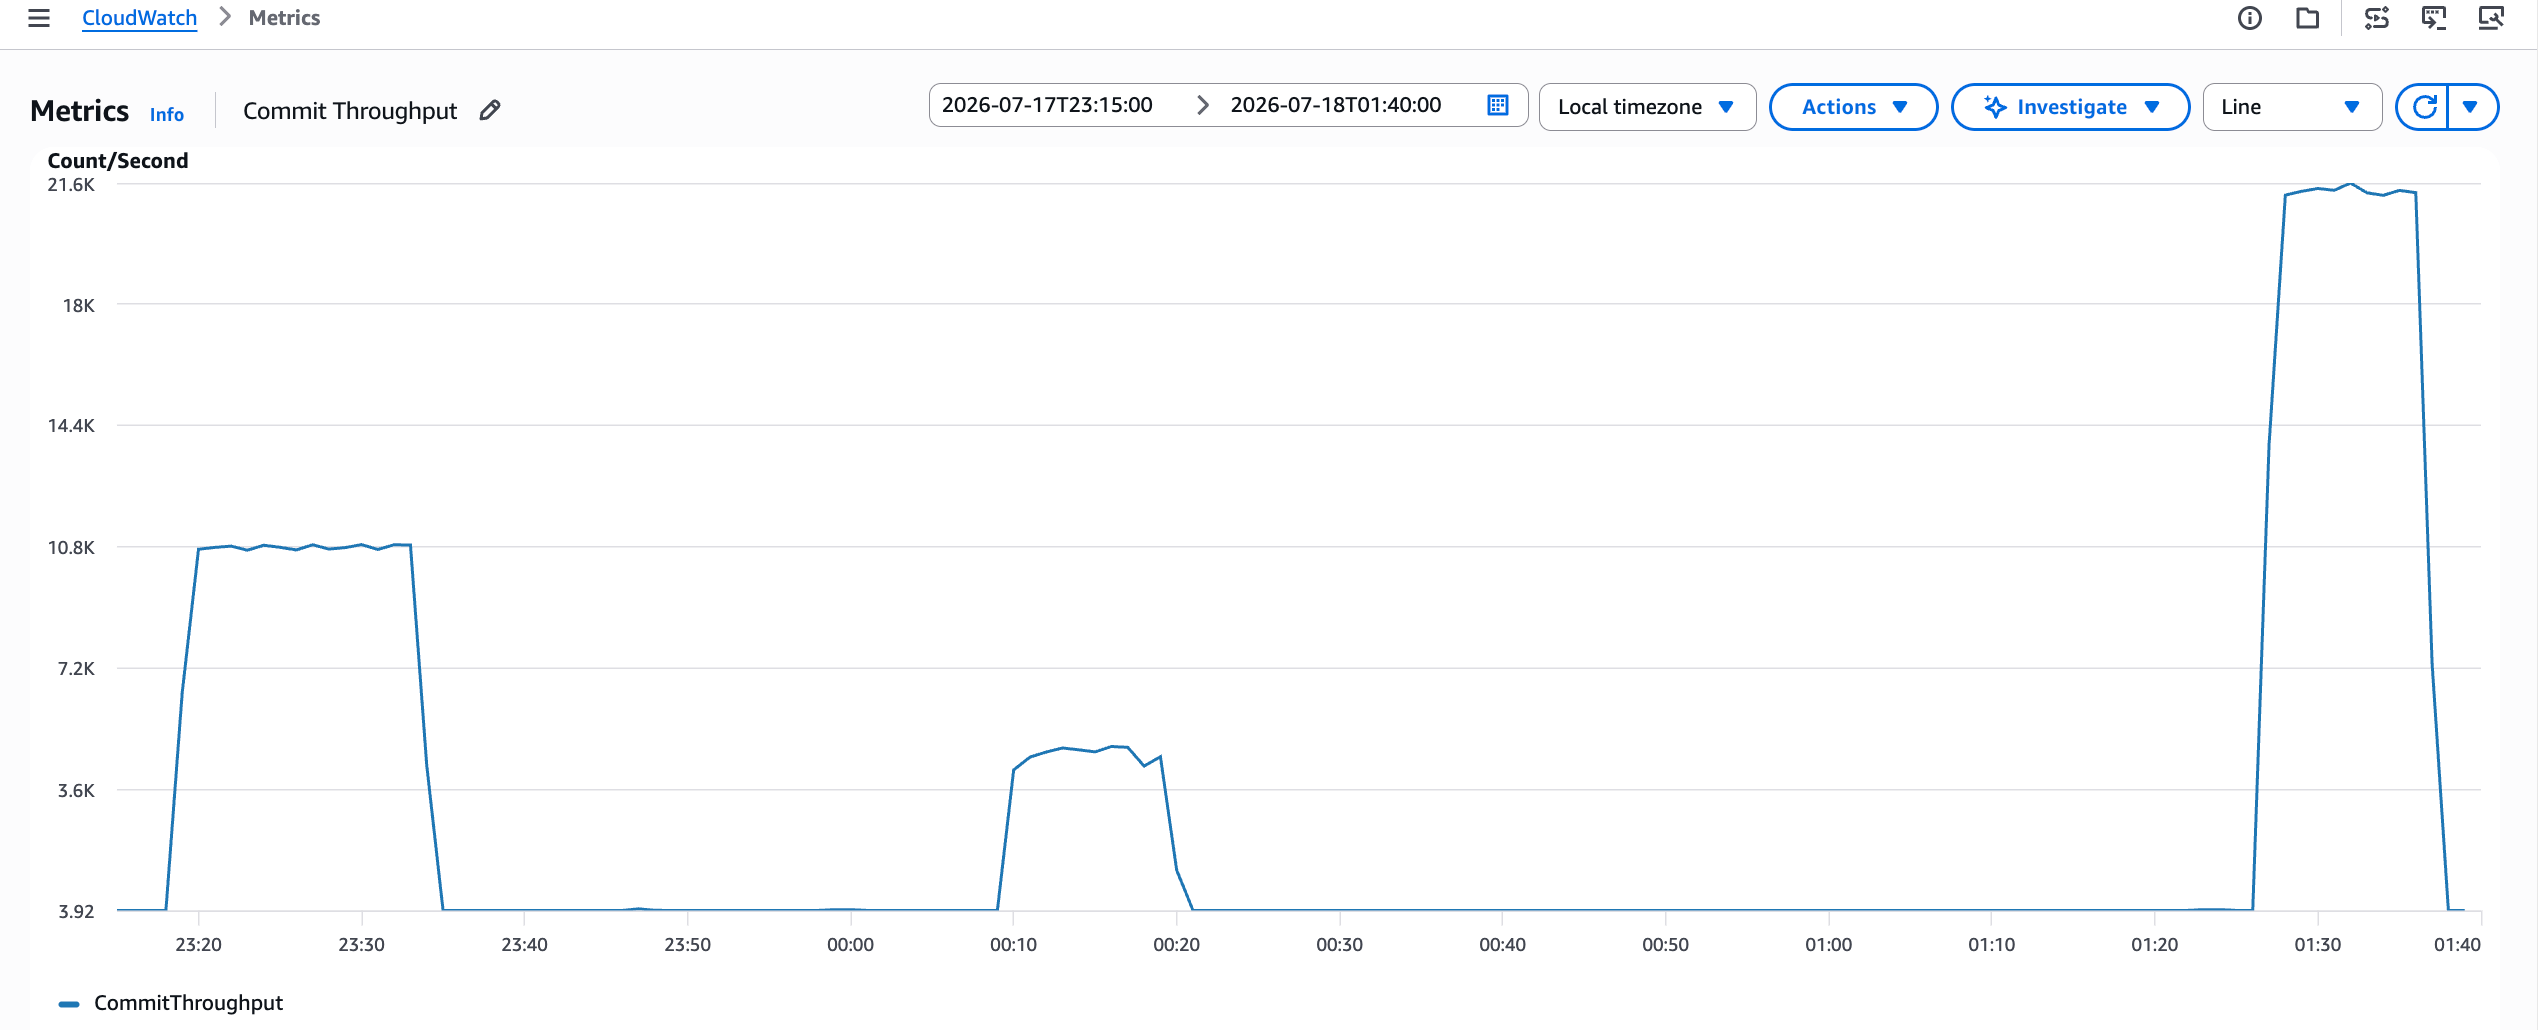
Figure 8: CommitThroughput chart showing throughput exceeding 21,000 TPS at 512 concurrent requests against the striped inventory
- The script prints a retry/failure summary after each run: total retries, total failures after max retries, and total items processed. Some retries will occur as expected. They show
SKIP LOCKEDdoing its job. In this particular run, about 0.024% of orders failed:
The retry count (3,944,045, or approximately 31 percent of items processed) is expected behavior: SKIP LOCKED causes a statement to silently skip a locked stripe row and retry on the next available one, so a high retry rate simply means contention is being distributed rather than blocked on.
A high failure count means an update attempt exhausted every stripe row for that item without finding one unlocked. Increasing the stripe count (the -n option in copy_item_inventory_to_striped.sh) for those items gives concurrent updates more rows to land on and should reduce failures on a re-run.
Real applications are different. They typically read data first (check price, availability, or eligibility) and then act on it. This is where the “Minimize Lock Duration” pattern from earlier becomes critical. When developers don’t follow this pattern, they naturally reach for SELECT ... FOR UPDATE to protect the read, then hold that lock across business logic or an external API call, recreating the long-lock-duration problem. Since RDS read replicas and Aurora reader instances serve only read-only transactions, SELECT ... FOR UPDATE queries must execute on the writer inside the same transaction as the subsequent update. This forces all product-browsing and availability-check traffic onto the writer, eliminating read-scaling benefits that Aurora readers and RDS read replicas provide.
Optimistic concurrency control avoids acquiring that early lock entirely: read the row (and its version) with a plain SELECT, without locking. Because no lock is taken, this read can be served by an Aurora reader instance (or RDS read replica) over a separate connection, offloading read traffic from the writer and improving read scalability. Perform your business logic outside any transaction and only open a transaction on the writer at update time to verify the version hasn’t changed. Combining this with striping and NOWAIT gives you three benefits together:
- Read scalability, because product browsing and availability checks go to readers rather than the writer.
- Minimal lock duration, because the write transaction is brief and targets a random stripe row.
- Graceful retry on collision, because
NOWAITfails immediately on a locked row rather than waiting, and the application retries on the next available stripe without requiring strong consistency between the earlier read and the write.
The approach is:
- Selecting a random row without locking.
- Performing business logic outside the transaction.
- Using version number and
NOWAITduring update. - Implementing retry logic for failed updates.
Note: this optimistic concurrency + NOWAIT pattern is not implemented in the accompanying repo. The repo’s workload instead demonstrates the SKIP LOCKED approach you ran previously, which fits its multiple-interchangeable-stripe-rows design. The pseudocode above illustrates the alternative approach for cases where you’re updating a single specific row (once you’ve already picked it via its version) rather than choosing among several equivalent candidates.
Considerations and limitations
When implementing these patterns, consider the following trade-offs. Asynchronous processing requires managing failures and notifying users when resources become unavailable. Optimistic concurrency control requires retry logic with exponential backoff, which adds application complexity. Random row selection helps minimize but does not eliminate lock contention, and applications must handle cases where a selected row has insufficient count. Row splitting introduces schema changes (the item_stripe_id column and item_inventory_striping_config metadata table) and requires aggregation queries to compute total inventory across split rows. The operational cost of maintaining the item_inventory_striping_config table and deciding when to split or merge rows should be factored into your implementation plan. When simulating this pattern with the accompanying repo’s simulate_contentious_load_with_striped_inventory.sh, watch the retry/failure summary it prints after each run. A high failure count (update attempts that never found an unlocked stripe row even after repeated retries) is a signal to increase the number of stripes for that item.
Cleanup
If you completed Part 1 and Part 2 back-to-back, or if you’re not planning any further experimentation with the schema and workload scripts used in this series, clean up the resources you created so they stop contributing to your AWS bill. Retaining a database cluster, EC2 instance, or Advanced mode Database Insights beyond what you need for this post will continue to incur charges.
- If you used the CloudFormation template from the sample-aurora-rds-workload-simulation-script (
setup-rds-pgsql-cfn.ymlorsetup-aurora-pgsql-cfn.yml), you can clean up by deleting the stack, which removes the EC2 client host, database instance or cluster, and other resources the template created, in one step. - If you created a new EC2 instance outside of CloudFormation to run the workload scripts, it will continue to incur cost while running. Check the instance’s Amazon Elastic Block Store (Amazon EBS) volume persistence settings to understand whether its volumes are deleted automatically on termination, then terminate the instance. If any volumes are retained, delete them separately.
- If you created a new Aurora cluster to simulate the workload in this series, delete each DB instance in the cluster first, then delete the cluster itself.
- If you enabled CloudWatch Database Insights Advanced mode on an existing cluster to follow along with the Lock Analysis features in this post, Advanced mode and its retention period continue to incur charges until you turn it off. You can switch back to Standard mode if you no longer need it. However, for production workloads, we recommend keeping Advanced mode enabled.
Conclusion
In this post series, you learned how the MVCC model of PostgreSQL effectively handles concurrent transactions, but when multiple sessions compete to modify the same rows, lock contention can degrade throughput and increase API response latency.
In Part 1, we explored the locking internals and demonstrated how row lock contention caused a 55 perccent throughput reduction in our order-placement workload. In this post, we showed how CloudWatch Database Insights and its Lock Tree visualization give you continuous visibility into blocking relationships without the overhead of manual queries. We then addressed the contention through a progression of fixes, from immediate session termination through timeout guardrails to architectural changes.
The striped inventory pattern, combined with SKIP LOCKED and bounded retry logic, restored throughput from approximately 4,900 TPS under contention to more than 21,000 TPS. This demonstrates that row lock contention is fundamentally a workload and schema design challenge. Resolving it requires targeted changes to how the application acquires and holds locks, not additional compute capacity.
Row lock contention is one of several concurrency challenges in PostgreSQL. If your workload exhibits lightweight lock (LWLock) contention, the techniques differ. See Improve PostgreSQL performance: diagnose and mitigate lock manager contention. MultiXact contention follows yet another pattern. See MultiXacts in PostgreSQL: usage, side effects, and monitoring for diagnosis and remediation. If you’re new to PostgreSQL performance troubleshooting more broadly, Initial troubleshooting for common PostgreSQL performance issues provides a practical starting point.
To get visibility into your own workload and catch contention before it affects users, enable Advanced mode in Database Insights. Use the Lock Tree to identify problematic patterns, validate your optimizations, and build confidence that your changes are delivering the throughput you expect.
Acknowledgements
Special thanks to Deepak Lingesan, Amol Bhatnagar, and Josna Pereira for their contributions to this post.