AWS Database Blog
Using CloudWatch Database Insights to troubleshoot query performance from calling services
Teams operating databases behind microservice architectures face a recurring troubleshooting challenge. When a database starts showing high CPU utilization and increased query latency, the service causing the problem is rarely obvious. It might be a poorly optimized query, a sudden traffic spike from one of dozens of calling services, a connection pool misconfiguration, or a combination of all three. The information needed to isolate the problem is scattered across application teams, networking dashboards, and database monitoring tools that were never designed to correlate with each other. A database engineer responding to a production alert must reach out to multiple teams, manually stitch together metrics from disparate sources, and form hypotheses without a unified view of which services are actually driving load. This process routinely turns a 15-minute fix into a multi-hour incident. As application architectures grow in complexity and the number of services calling a single database multiplies, the need for unified, application-aware database observability has become critical.
In this post, you learn how to use the calling services feature in Amazon CloudWatch Database Insights to quickly identify which applications are calling your databases and view their performance metrics, helping you pinpoint root causes and contact the right team in minutes rather than hours.
Amazon CloudWatch Database Insights is a database monitoring solution that provides a comprehensive view of your Amazon Aurora and Amazon Relational Database Service (Amazon RDS) database fleet. It collects and correlates database performance metrics, operating system metrics, OS process-level details, and query-level telemetry in a single unified experience within the CloudWatch console. Database Insights supports Amazon Aurora (MySQL and PostgreSQL-compatible editions) and Amazon RDS for PostgreSQL, MySQL, MariaDB, Oracle, and SQL Server engines. By surfacing database load, wait events, top SQL queries, and OS processes together, Database Insights helps you detect and respond to performance issues without switching between multiple monitoring tools.
Sample architecture overview
CloudWatch Application Signals collects metrics and traces from your applications running on Amazon Elastic Compute Cloud (Amazon EC2), Amazon Elastic Container Service (Amazon ECS), Amazon Elastic Kubernetes Service (Amazon EKS), and AWS Lambda. When integrated with Database Insights, you can view the complete request path from your application services through to your Amazon Aurora and Amazon RDS databases. For each calling service and operation, you can view performance data and understand application-to-service dependencies. This removes the guesswork. Identifying which of multiple services is overloading a shared database traditionally required slow, manual cross-team coordination, and that’s exactly the problem we solve in this post. You can immediately identify which service is experiencing latency and contact only the relevant team to resolve the issue, saving valuable time during incident response.
We use the integration between CloudWatch Database Insights and CloudWatch Application Signals to identify which applications and services are calling your databases. The following diagram shows the sample architecture for this walkthrough.
The sample architecture represents a retail application with three AWS Lambda functions that interact with Amazon Aurora PostgreSQL databases. Each Lambda function serves a specific business purpose: handling retail transactions in production, supporting development testing, and generating business reports. These functions are instrumented with OpenTelemetry through CloudWatch Application Signals to collect traces and metrics, which Database Insights then correlates with database performance data. CloudWatch alarms provide proactive monitoring for database performance metrics. For a real-world example, see Amazon CloudWatch Database Insights applied in real scenarios.
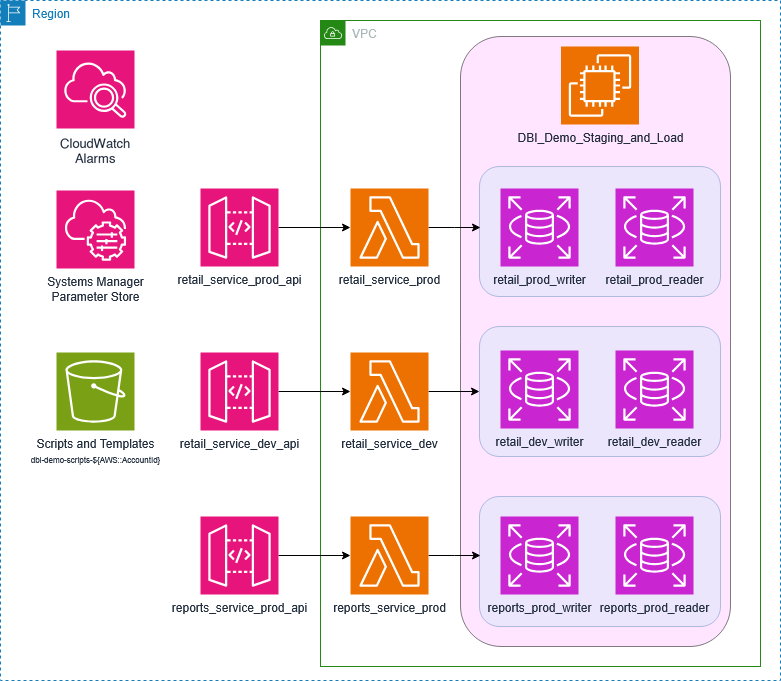
Figure 1 — Retail application architecture
Prerequisites
To implement the calling services feature in CloudWatch Database Insights, you need the following prerequisites:
- An AWS account with the least privilege to manage Amazon RDS, CloudWatch, and Application Signals.
- An Amazon Aurora or Amazon RDS database instance with Database Insights Advanced mode enabled.
- An application calling your database with Application Signals enabled (such as Lambda functions, ECS tasks, EKS pods, or EC2 instances)
Now that you understand the architecture, you configure the three components that make calling services work: Database Insights collects your database telemetry, Application Signals collects your application telemetry, and Transaction Search links them together through distributed traces. After all three are enabled, you have a single console view that connects application behavior directly to database impact. This is the unified picture that’s difficult to achieve when these signals live in separate tools.
Steps to enable calling services
To use the calling services feature in CloudWatch Database Insights, you need to complete the following steps.
Step 1: Enable Advanced mode of CloudWatch Database Insights
To use CloudWatch Database Insights, you must first enable it. To do this, turn on the Advanced Mode of CloudWatch Database Insights for your RDS DB instances or Aurora DB clusters. Note that there is a cost associated with enabling this feature. Review the CloudWatch pricing page for more details. You can also enable this using the AWS Command Line Interface (AWS CLI) and the RDS API. See the Database Insights documentation for instructions.
- Open the Amazon RDS console.
- In the navigation pane, choose Databases.
- Select your database instance or cluster.
- Choose Modify.
- In the Monitoring section, enable Database Insights and select Advanced mode.
- Choose Continue, then choose Apply immediately.
- Choose Modify DB instance.
Step 2: Enable Application Signals
Enable CloudWatch Application Signals on the application services that call your database. Application Signals automatically instruments your applications with OpenTelemetry to collect traces and metrics.
For our sample architecture, we enable Application Signals on our AWS Lambda functions. For your own architecture, you can enable Application Signals on Amazon EKS, Amazon ECS, Amazon EC2, or AWS Lambda. Follow the instructions on how to enable Application Signals on different architectures in the Application Signals documentation.
You can initiate this by navigating to the CloudWatch console, choosing Application Signals, Services, then Enable Application Signals, and following the guided enablement process for your chosen platform. Note that there is a cost associated with Application Signals. Review the CloudWatch pricing page for details.
Step 3: Enable Transaction Search
Next, we enable Transaction Search, which provides an interactive analytics experience that you can use to get complete visibility of your application transaction spans. Spans are the fundamental units of operation in a distributed trace and represent specific actions or tasks in an application or system. Transaction Search uses AWS X-Ray, a service that collects data about requests your application serves and provides tools to view, filter, and gain insights into that data to identify issues and opportunities for optimization.
Step 4: Verify the configuration
After Application Signals is enabled and your application is generating traffic to your database, allow a few minutes for data to appear in the CloudWatch console. You can verify the configuration is working by navigating to CloudWatch → Application Signals → Services and confirming your services appear in the list.
Walkthrough: Tracing a performance issue from database to root cause
It’s 11:35 AM on a Tuesday. Two CloudWatch alarms fire simultaneously on the retail-prod-writer-instance: DBI-RetailProd-Writer-Connections (DatabaseConnections > 80, a threshold based on the average number of connections under normal traffic) and DBI-RetailProd-Writer-DBLoad (DBLoadRelativeToNumVCPUs > 1). The Database Insights console shows that DB load has spiked to 8,722% of capacity. DB load is measured in Average Active Sessions (AAS), which represents how many sessions are concurrently active on the database. The wait events are saturated by CPU, Client:ClientWrite, IO:AuroraGDRiskyQueryLogWrite, and IO:DataFileRead. Database connections have surged to 364, well past the alarm threshold of 80. Something is heavily constraining this database. But what?
The problem: A database under siege with no obvious culprit
Three different services call retail-prod-writer-instance: production retail transactions, development testing, and business reporting. Any one of them (or all three) might be responsible. Historically, answering “which service is causing this?” meant messaging the application team, waiting for them to pull their metrics, and correlating timestamps manually. That’s 30–45 minutes before you even form a hypothesis.
Instead, open the CloudWatch console, navigate to Database Insights, and select the retail-prod-writer-instance from the Fleet view. The instance is running Aurora PostgreSQL 16.11 on a db.t3.medium, and the dashboard immediately shows 2 of 3 alarms in breach. The DB Load alarm shows DBLoadRelativeToNumVCPUs peaked at 165.16, far beyond the threshold of 1.
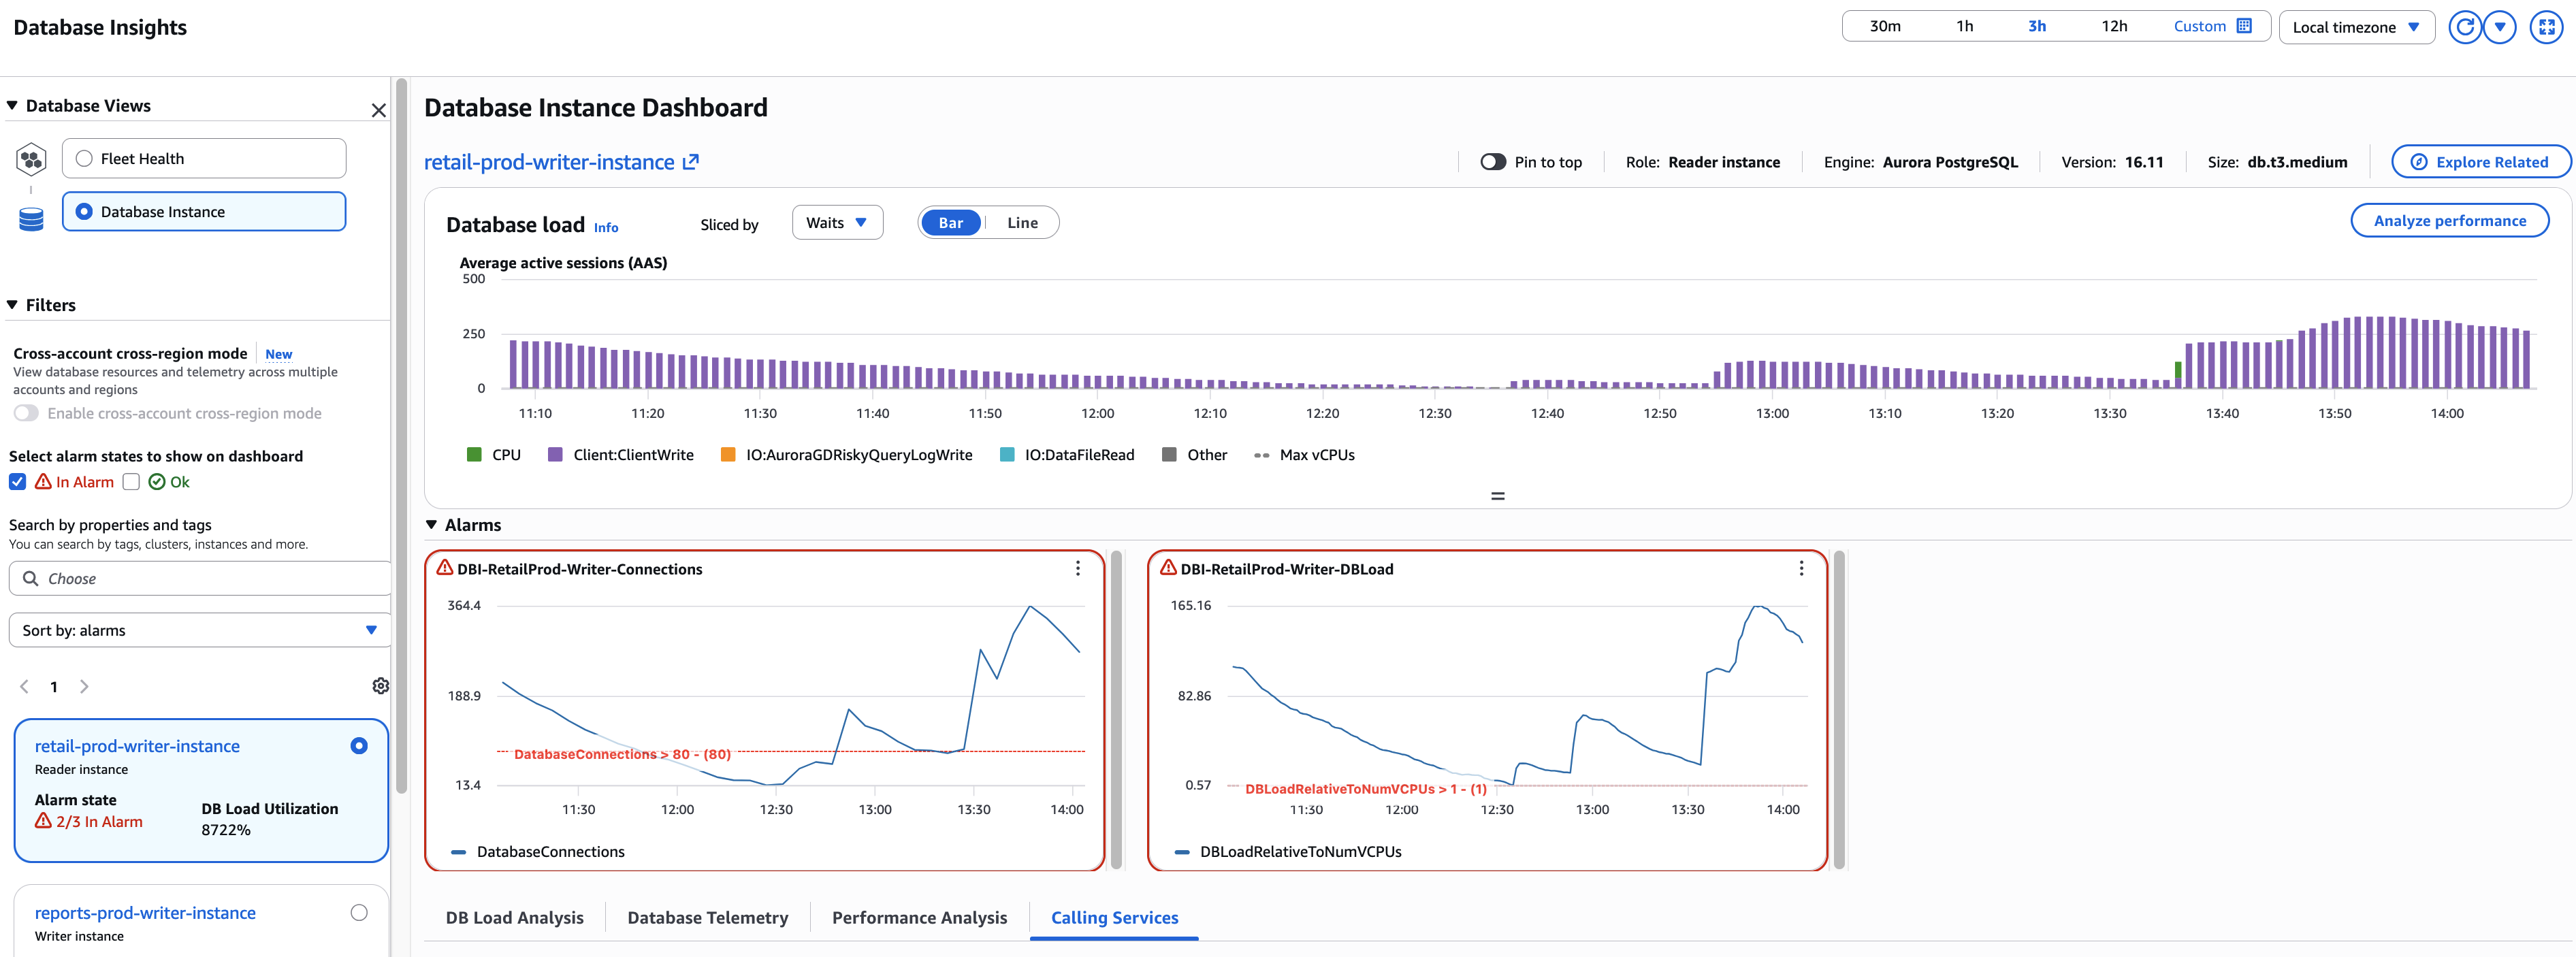
Figure 2 — Database Insights instance view showing the retail-prod-writer-instance with high DB load and 2 of 3 alarms in breach
The first clue: Calling services tab identifies the source
Choose the Calling Services tab at the bottom of the Database Instance view. Within seconds, the answer is clear.
retail_service_prod is showing 99 requests with 41 faults (5xx) at a 41.4% fault rate. Availability has dropped to 58.6%. The other services are quiet. You’ve identified your culprit.
Choose the retail_service_prod hyperlink to drill deeper. This navigates you into the Application Signals console for that specific service.
Note: You’re now viewing the problem from the application’s perspective rather than the database’s. This cross-domain pivot is what makes calling services powerful.
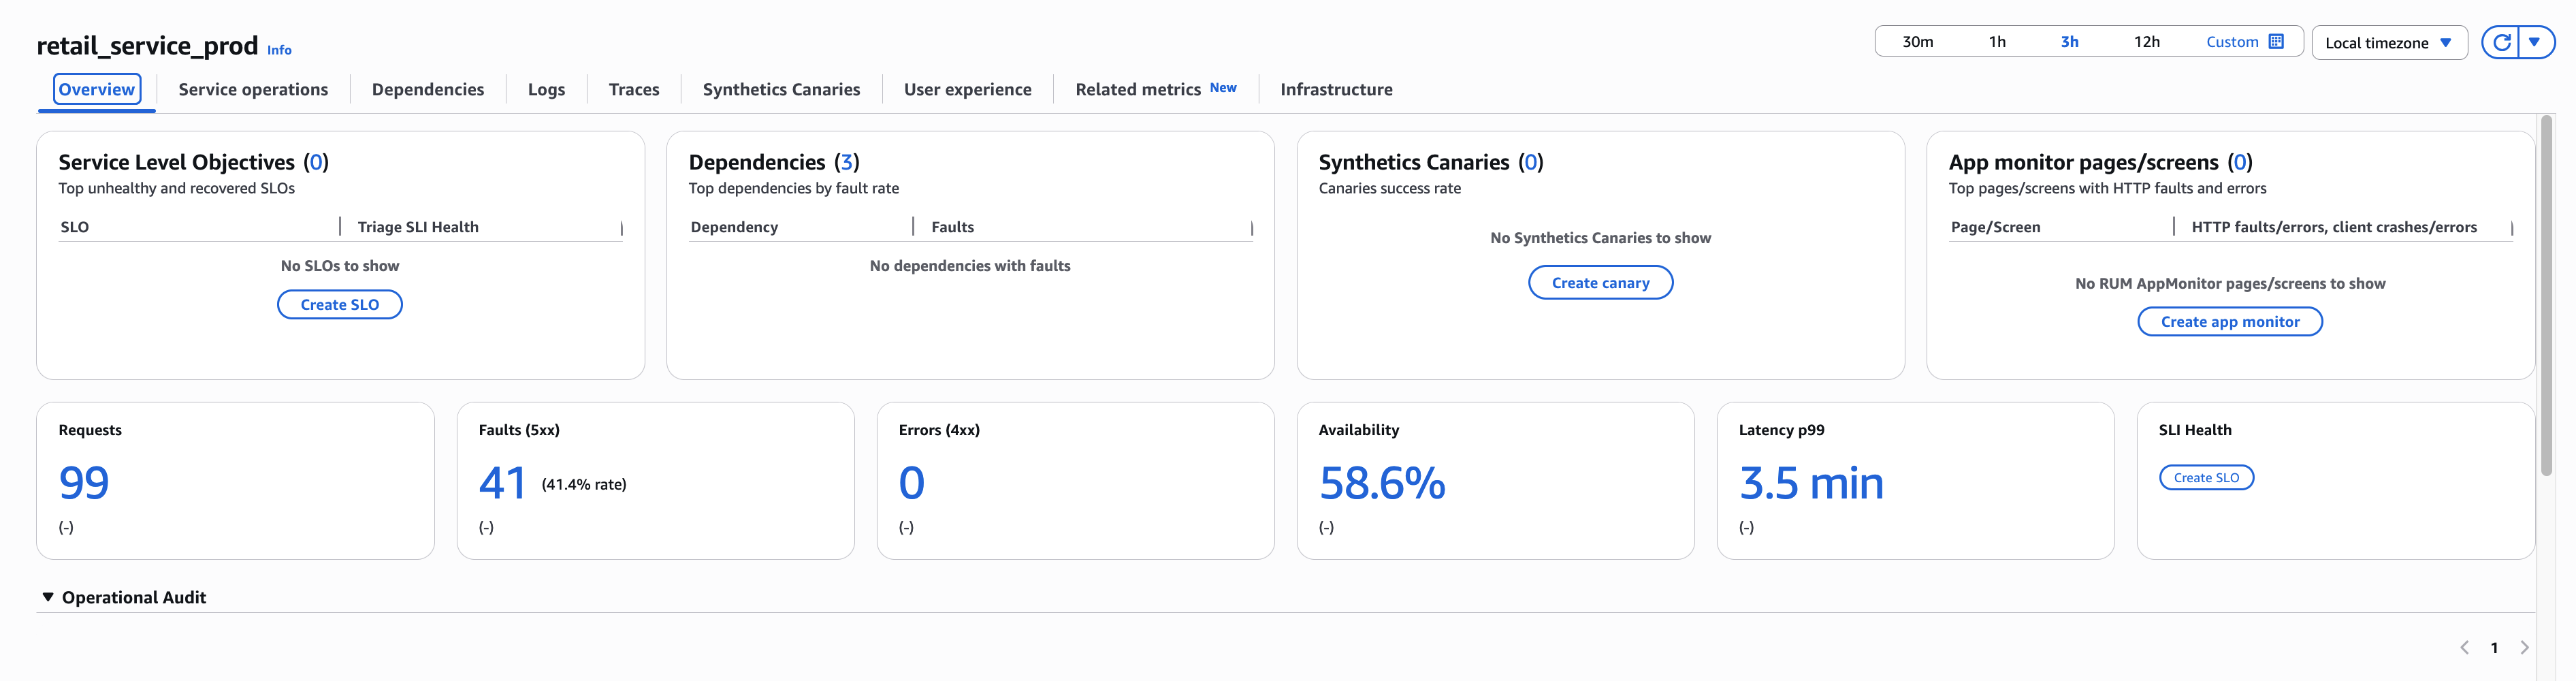
Figure 3 — Application Signals overview for retail_service_prod showing requests, faults, availability, and latency
Going deeper: Which operation is responsible?
The Application Signals service page for retail_service_prod opens. Navigate to the Service Operations tab. The metrics graphs immediately tell a story:
- Requests and Availability: request volume spiked, availability fluctuated significantly.
- Latency: p99 latency climbed to approximately 5 minutes (299.7K ms at the
Invocationlevel) - Faults and Errors: faults peaked at ~9 per interval, correlating directly with the request spike.
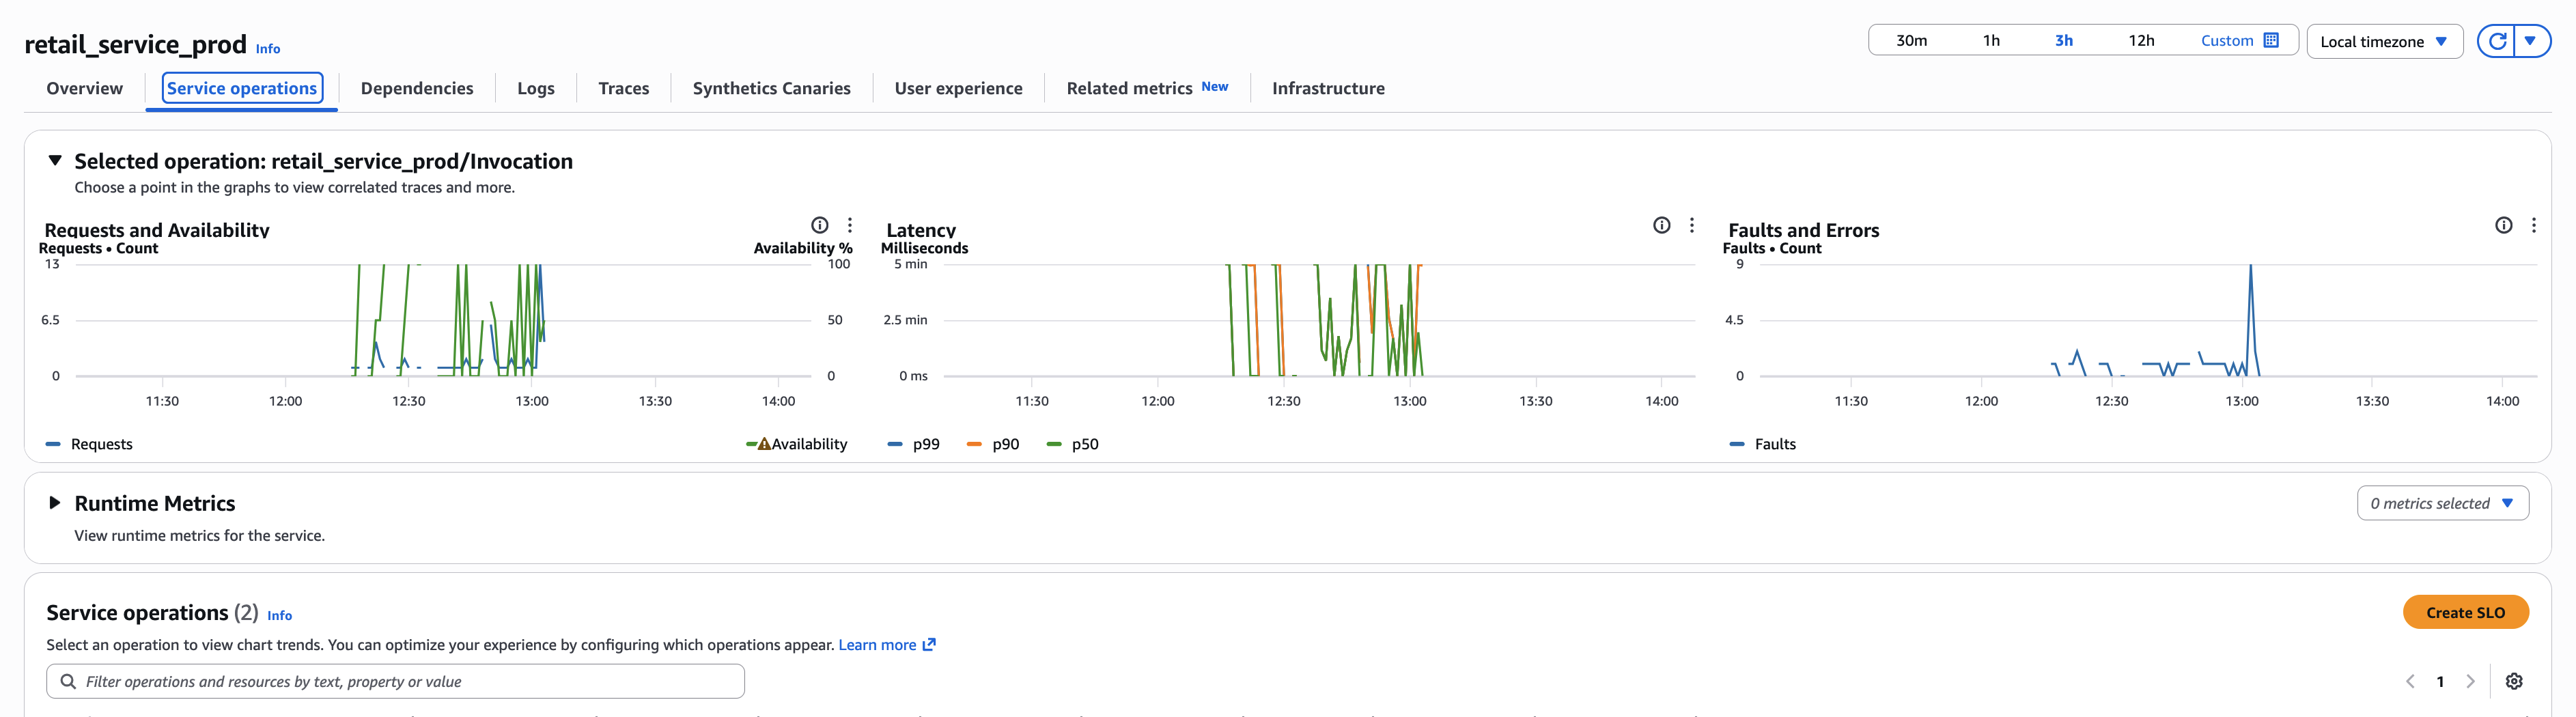
Figure 4 — Service operations graphs showing request volume, latency, and fault rate for retail_service_prod/Invocation
Below the graphs, the Service operations table reveals something important:
Two operations appear: Invocation and FunctionHandler. The Invocation operation shows a 58.6% fault rate (41 faults out of 70 requests) with p99 latency at 299.7K ms. But that’s misleading. Invocation represents Lambda’s platform-level dispatch (throttles, timeouts, cold starts). The actual application logic lives in FunctionHandler, which shows 0% faults, 0% errors, and 100% availability for the 29 requests that made it through, with a much healthier p99 of 344.6 ms.

Figure 5 — Service operations table comparing Invocation and FunctionHandler metrics
This tells you the application code itself isn’t failing. Lambda is throttling under the request volume. The problem is upstream: why are so many requests suddenly reaching this function?
Choose FunctionHandler to examine what the successful requests are actually doing.
Diving deeper
Choose a time range during the incident. Data points populate across the metric graphs. Requests peaked at ~7, availability held at 100% for FunctionHandler, and p99 latency reached 348 ms. Choose a data point on the Requests and Availability graph at 2026-05-21 12:57:00 UTC. A panel slides open showing Correlated traces (1).
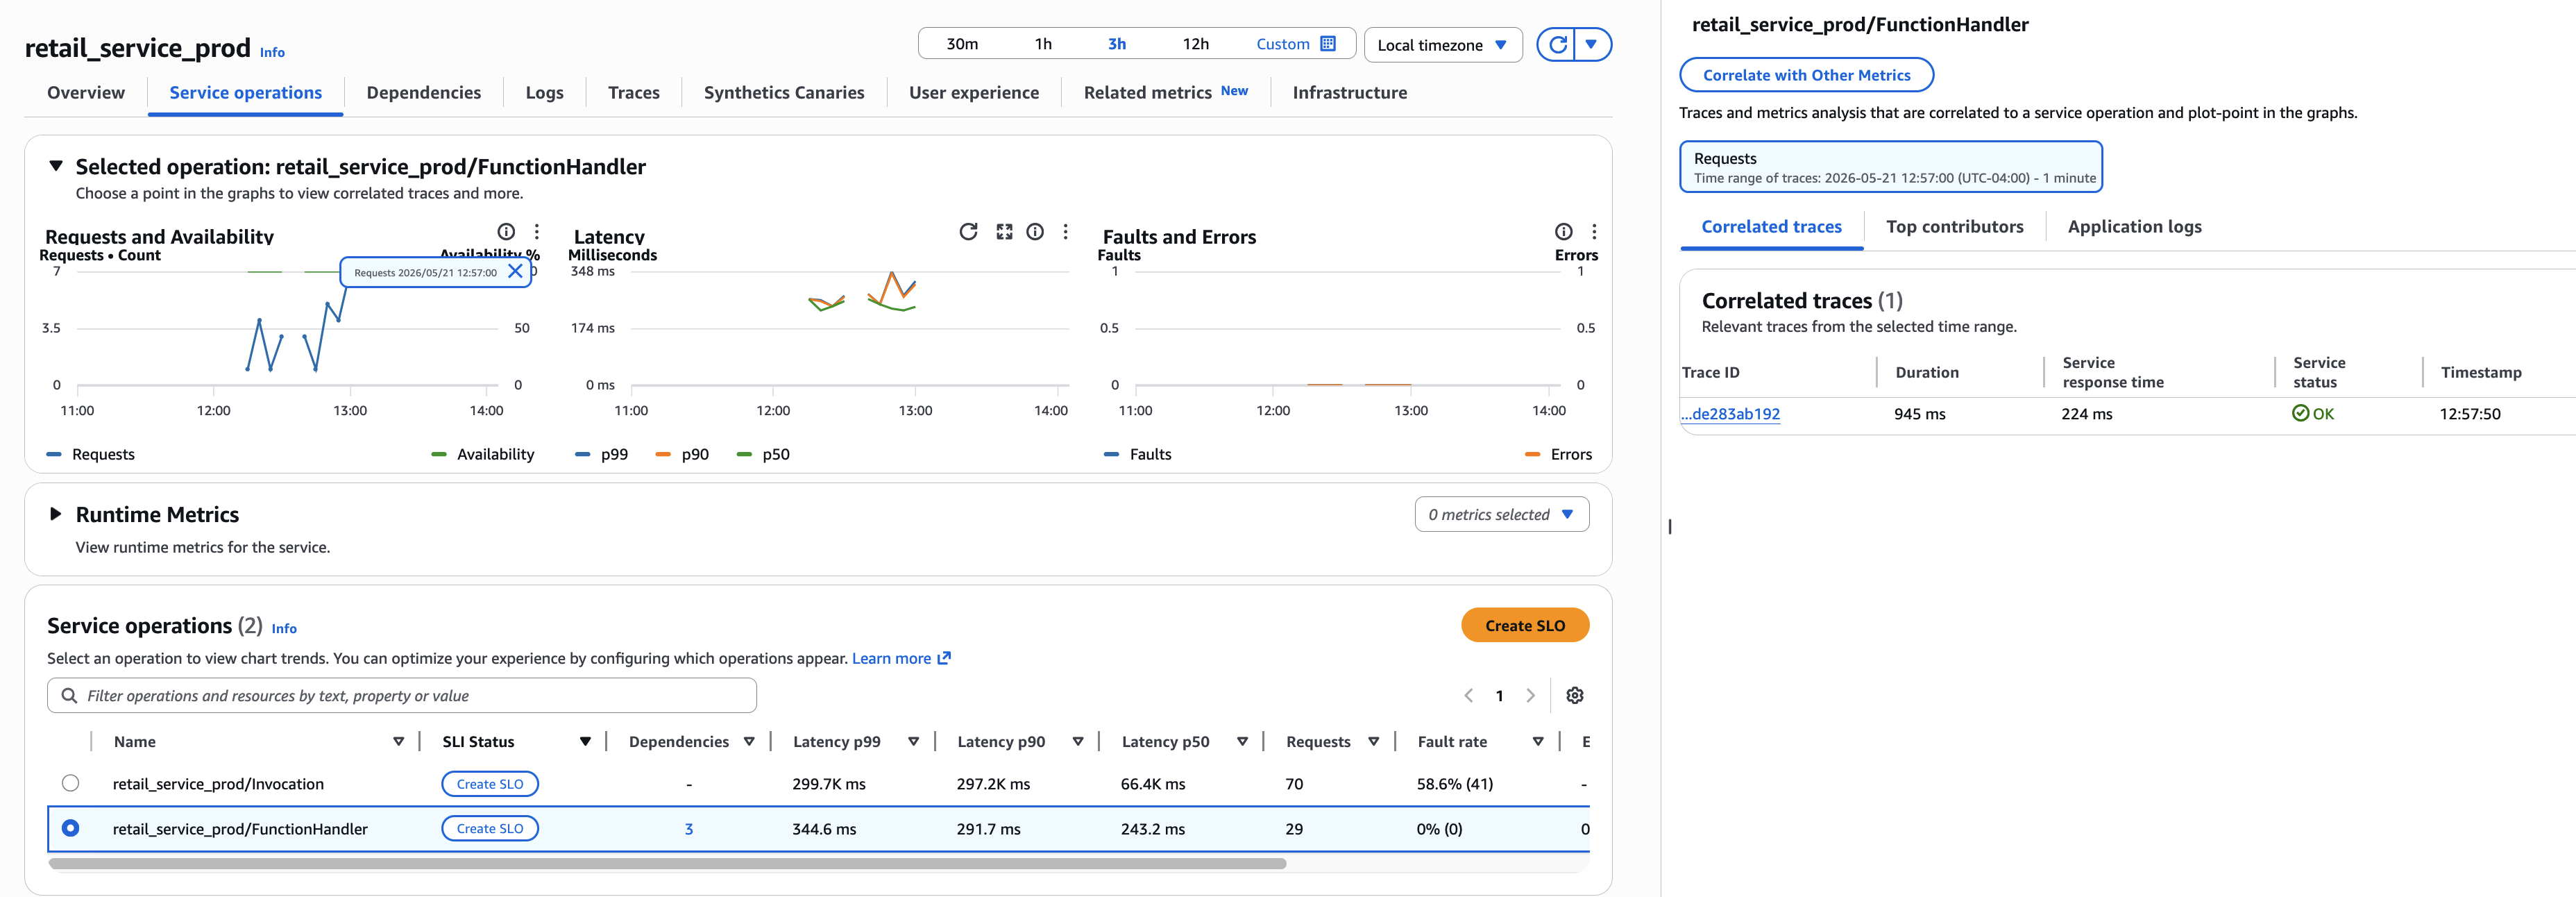
Figure 6 — FunctionHandler operation with correlated trace details
Notice the pattern: service response time is 224 ms, but total trace duration is 945 ms. The gap between “service response time” and “total duration” means something outside the application code is adding latency, likely Lambda cold start initialization (481 ms Init time) under throttling pressure.
Choose the trace (...de283ab192) to understand what the request path looks like.
The full picture: Trace map reveals the request path
The Trace Details page opens for trace 1-6a0f398e-4b0cd207697772de283ab192. The header confirms: Response Code: 200, Duration: 945 ms, Age: an hour (2026-05-21 12:57:51). The visual trace map shows the complete request path:
Client → retail_service_prod (Lambda Context) → retail_service_prod (Lambda Function) → retail_service_prod → PostgreSQL + UnknownRemoteService
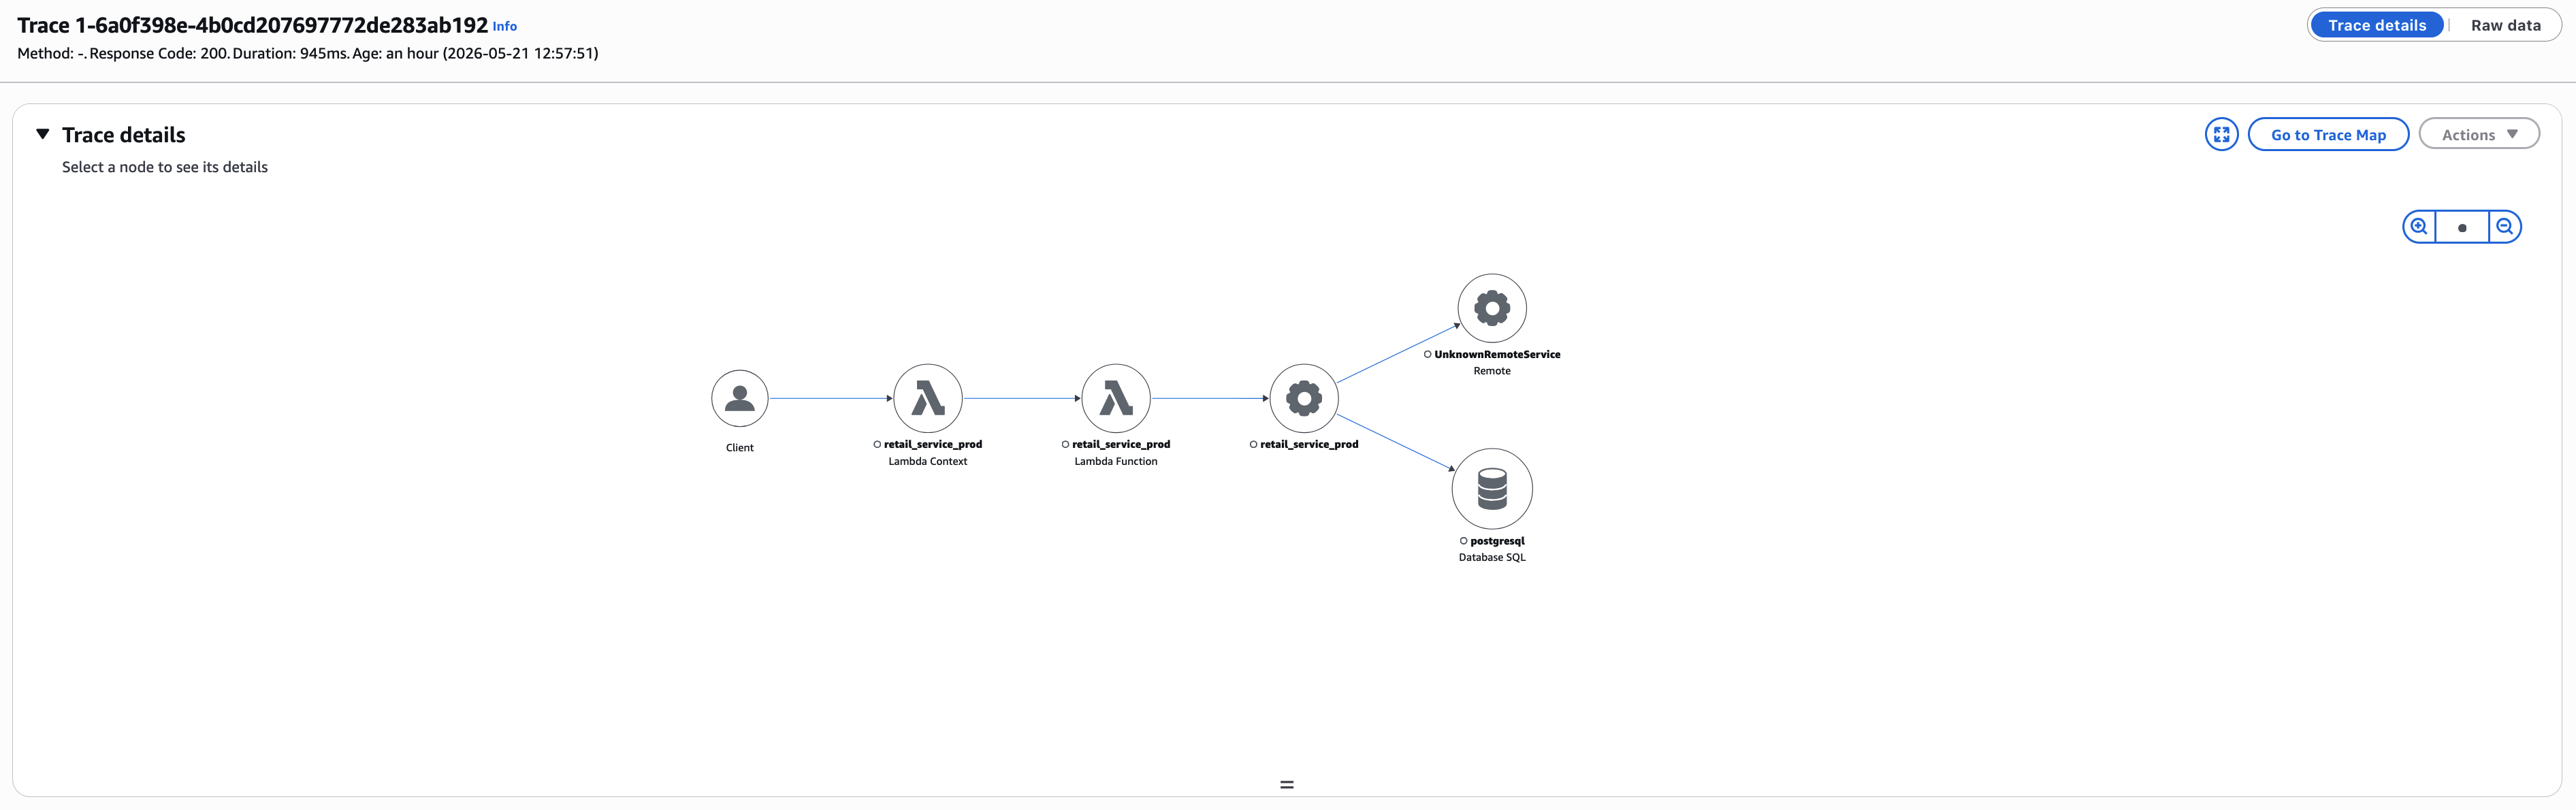
Figure 7 — Distributed trace map showing the end-to-end request path from client to database
The Segments Timeline quantifies exactly where time is spent:
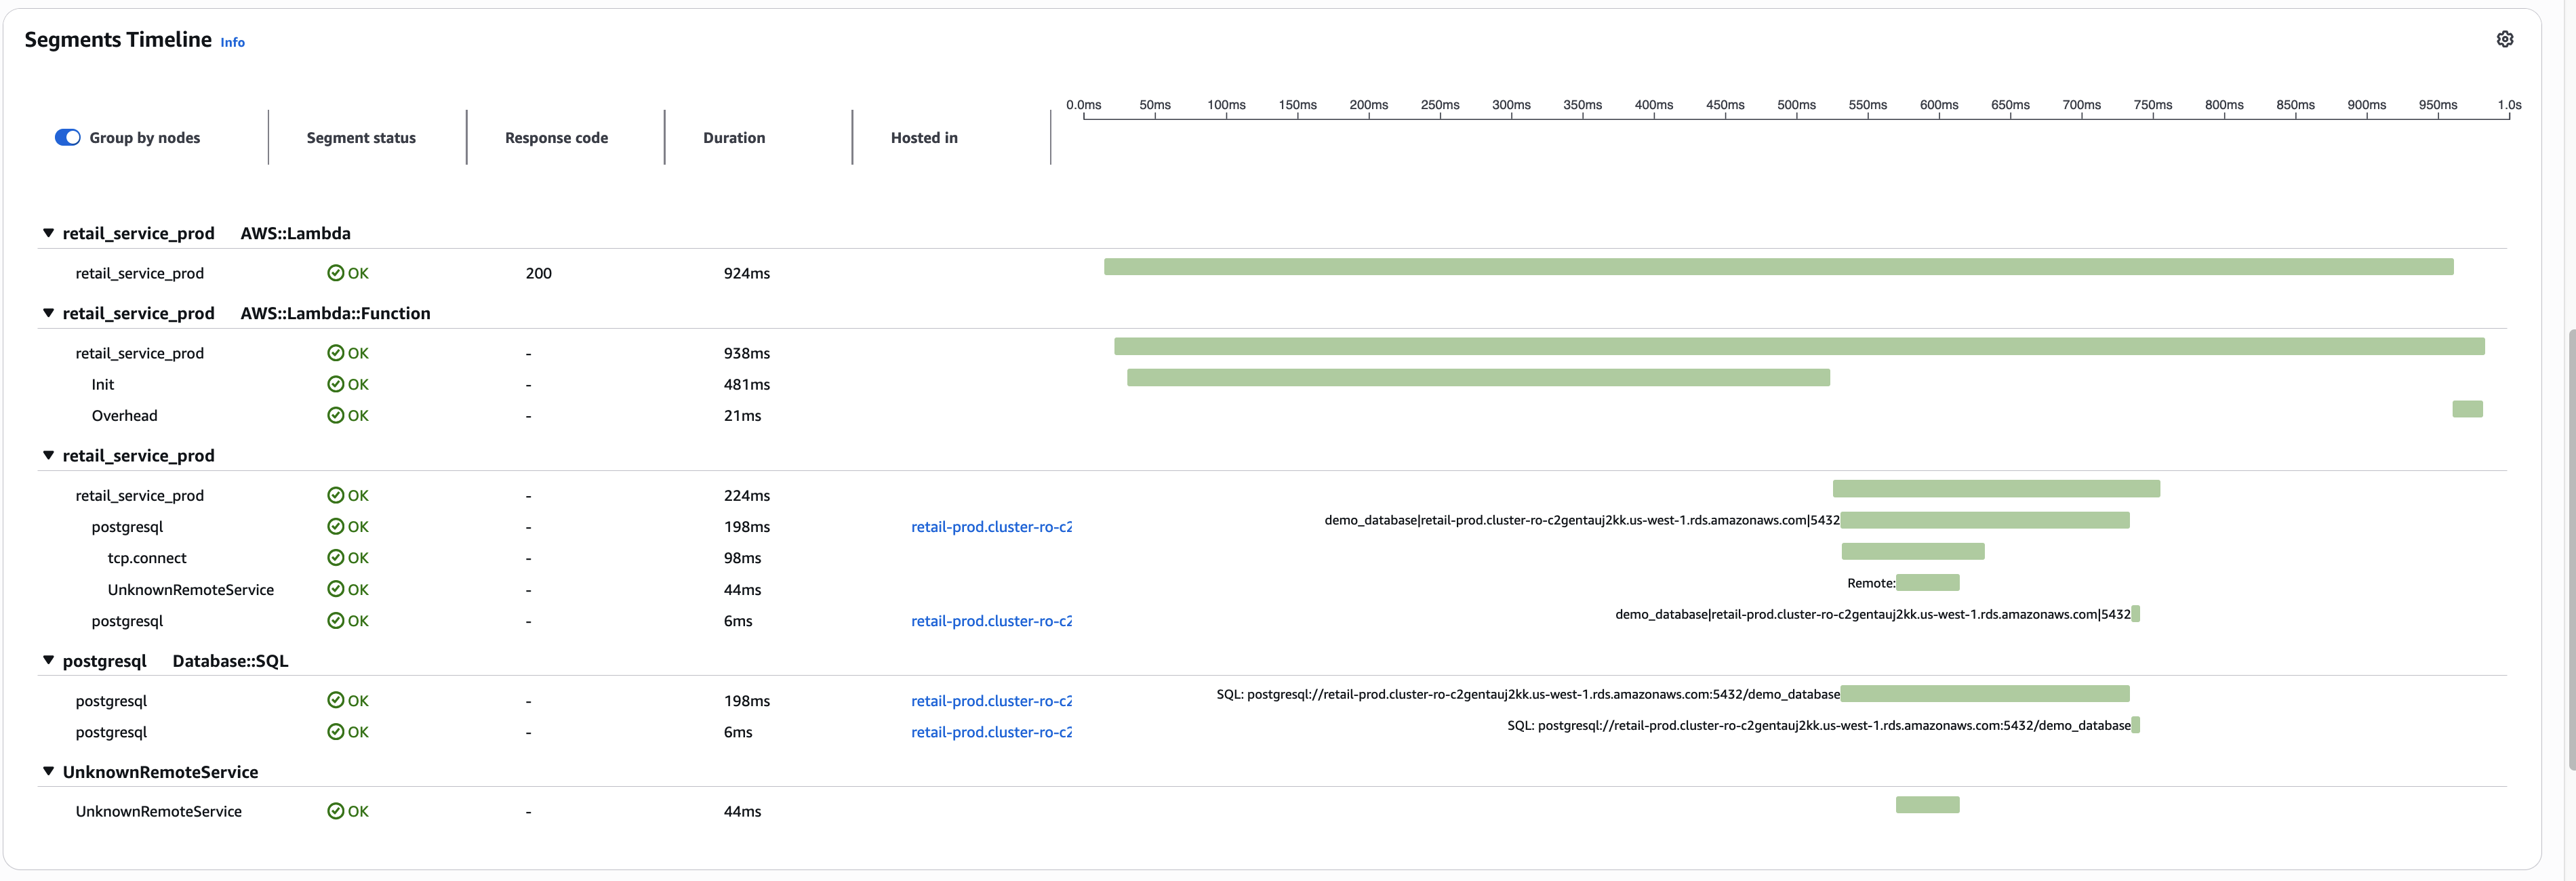
Figure 8 — Segments Timeline showing time spent in each component of the request
The insight: In this trace, the total Lambda execution takes 938 ms, of which 481 ms is cold start initialization (Init) and 224 ms is the actual function handler. The database queries take 204 ms (198 ms + 6 ms) of the handler time. The TCP connection setup adds 98 ms.
The Logs section confirms the Lambda execution details: functionArn: arn:aws:lambda:<aws-region>:111122223333:function:retail_service_prod, duration 938.182 ms, billed 939 ms, memory used 117 MB of 256 MB allocated.

Figure 9 — Lambda execution logs showing platform.start and platform.report events
The smoking gun: What SQL is actually running?
Choose the postgresql segment (198 ms). The Segment details panel opens. Choose the SQL tab:
Database type: postgresql. User: orders_service.
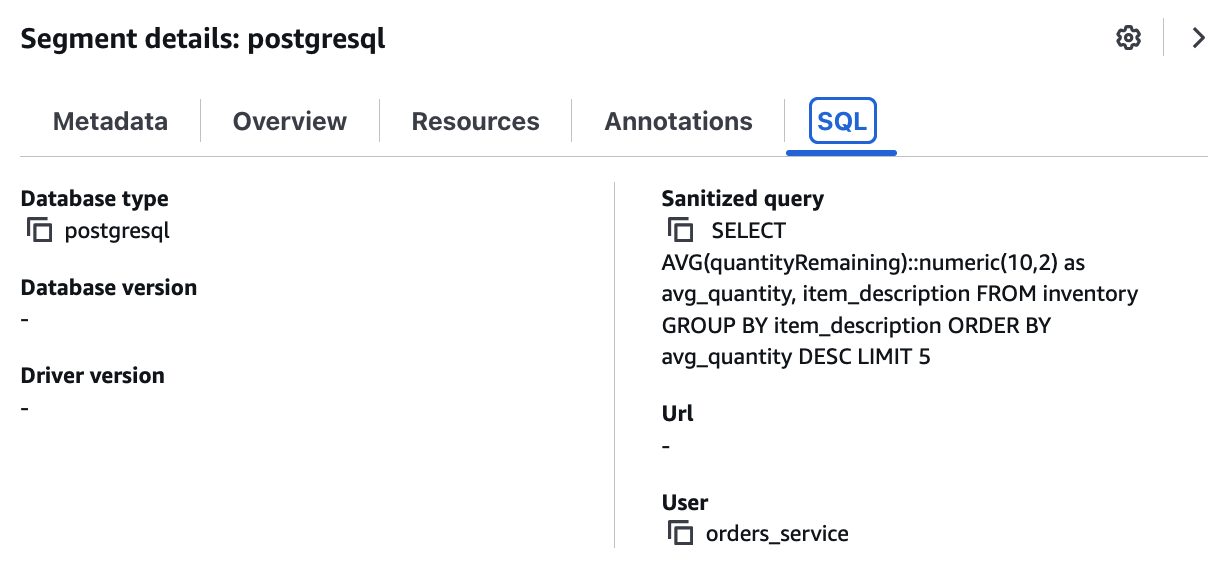
Figure 10 — PostgreSQL segment details showing the sanitized SQL query and database user
Now the investigation has a complete narrative:
- What’s happening:
retail_service_prodis sending a surge of requests (99 total in the observed window)
- What each request does: A
SELECT AVG(quantityRemaining) FROM inventoryquery grouped byitem_description, returning the top 5 items by average quantity. - Why the database is overloaded: Concurrent inventory queries are consuming CPU and I/O, pushing DB load to 165.16x vCPU capacity.
- Why requests are failing: Lambda is throttling under the volume, causing the 58.6% fault rate (41 failures) at the
Invocationlevel, while the application code itself runs successfully at 100% availability.
You’ve gone from “the database is on fire” to a complete root cause in minutes, without leaving the CloudWatch console, without messaging another team, and without correlating timestamps between tools.
Resolution: Engaging the right team with evidence
You now have everything needed to contact the correct team with specific, actionable context rather than a vague “the database is slow” escalation:
- The Application Team can investigate why
retail_service_prodis generating a traffic spike. - The Database Team can confirm the instance is healthy per-request (198 ms query time is within acceptable range) and doesn’t need optimization.
- The Infrastructure Team can evaluate whether the db.t3.medium instance needs scaling if this traffic pattern is expected.
The Application Team discovers a deployment introduced a polling loop with no backoff. Every failed health check triggered an inventory recheck. They roll back the deployment. DB load returns to normal within minutes.
Without calling services, this same incident would have required 3 teams, hours of chat threads, and a post-incident review to piece together what happened.
Additional benefits
CloudWatch Database Insights supports cross-account and cross-Region database fleet monitoring. This provides centralized observability across your entire database infrastructure. You can monitor, troubleshoot, and optimize databases spanning multiple AWS accounts and Regions from a single unified console experience. For detailed setup instructions, see the Database Insights documentation.
Clean up
If you no longer require these features, here are instructions on how to turn them off.
To turn off Application Signals for Lambda functions
- Open the AWS Lambda console at AWS Lambda console.
- Choose Functions and select the function you want to update.
- Choose the Configuration tab, then choose Monitoring and operations tools.
- Choose Edit.
- In the CloudWatch Application Signals and X-Ray section, clear both checkboxes.
- Choose Save.
To turn off Database Insights Advanced mode
- Open the Amazon RDS console at Amazon RDS console.
- In the navigation pane, choose Databases.
- Select your database instance.
- Choose Modify.
- In the Monitoring section, turn off Database Insights. Note that you should consider data retention implications for previously collected metrics.
- Choose Continue, then choose Apply immediately.
- Choose Modify DB instance.
To turn off Transaction Search
- Open the CloudWatch console.
- In the navigation pane, choose Settings.
- In the Traces section, choose Configure.
- Set the trace indexing sampling percentage to 0% or turn off Transaction Search. Also update your sampling rules in the X-Ray console as needed.
- Choose Save.
To delete log groups created by these features
- Open the CloudWatch console.
- In the navigation pane, choose Log groups.
- Delete the aws/spans log group created by Transaction Search. This log group continues to incur storage charges after Transaction Search is disabled.
- Delete any /aws/application-signals/* log groups created by Application Signals.
Considerations and limitations
Before adopting this approach, note the following constraints:
- Supported database engines – Database Insights is available for Amazon Aurora MySQL, Aurora PostgreSQL, Aurora PostgreSQL Limitless, Amazon RDS for PostgreSQL, RDS for MySQL, RDS for SQL Server, RDS for Oracle, and RDS for MariaDB. For the complete list of supported engine versions, instance classes, and Regions, see Aurora engine support and RDS engine support.
- Application Signals platform support – Application Signals is supported on Amazon EKS, native Kubernetes, Amazon ECS, Amazon EC2, and AWS Lambda. For details on supported languages, frameworks, and known limitations, see Supported systems.
- Database Insights mode requirement – The calling services feature demonstrated in this post requires Database Insights Advanced mode. Standard mode does not support viewing calling services with Application Signals. For instructions on enabling Advanced mode, see Turning on the Advanced mode of Database Insights.
- Regional availability – Database Insights and Application Signals are available in most commercial AWS Regions and AWS GovCloud (US). Confirm availability in your target Region before enabling. See Database Insights Region support and Application Signals documentation for current Region lists.
- Pricing – This solution combines costs from three services: CloudWatch Application Signals, Transaction Search (trace indexing), and Database Insights Advanced mode. Review the Amazon CloudWatch pricing page for current rates and to estimate costs for your workload.
- SQL text in traces – Application Signals and Database Insights capture SQL query text from your workloads. If your application uses literal values rather than parameterized queries, sensitive data such as personally identifiable information may appear in trace segments and performance dashboards. Use parameterized queries and verify the SQL text captured in a non-production environment before enabling these features in production.
Conclusion
Database performance issues rarely originate in the database alone, yet the tooling has historically forced engineers to correlate telemetry across teams and tools before forming a hypothesis. The calling services feature in CloudWatch Database Insights removes that barrier by connecting application telemetry directly to database workloads in a single console, letting you trace a DB load alarm to a specific query and a specific service in minutes. For fleets of more than 10 databases spanning multiple accounts and Regions, this turns every performance investigation into a repeatable workflow that immediately identifies the responsible service and eliminates hours of cross-team coordination.
Get started:
If you have questions or feedback about the calling services feature, leave a comment on this post.