AWS DevOps & Developer Productivity Blog
How AWS DevOps Agent uses multi-agent reasoning to find root causes
Confirmation bias is one of the most common reasons incident investigations take longer than they should. An on-call engineer gets alerted, forms a theory based on initial triage and experience, finds one piece of supporting evidence, and stops looking. The actual root cause — buried in a different service, a different signal, a different time window — goes undiscovered for longer than it should.
Modern distributed systems don’t lack telemetry. They lack reasoning — the ability to generate multiple explanations simultaneously, actively challenge each one, and converge on the true cause only when the evidence conclusively supports it.
AWS DevOps Agent, an autonomous agent, solves this with a multi-agent architecture that decomposes incident operations into specialized capabilities — each optimized for a different operational priority. But investigating an incident effectively requires starting with broader architectural context — which resources exist, how they relate to each other, and how they change with every deployment. That architectural understanding is what makes the difference between an agent that searches blindly through telemetry and one that reasons about your system.
In this post, we go inside the investigation lifecycle to explain how AWS DevOps Agent reasons through complex incidents — from the topology foundation that gives it architectural awareness, through autonomous triage and deep multi-hypothesis investigation, to the learning loop that prevents future incidents. Understanding how these capabilities connect is what turns the AWS DevOps Agent from a black box into a trusted member of your on-call rotation.
The Incident Lifecycle
AWS DevOps Agent organizes incident response into multiple capabilities that mirror how the best SRE teams operate — each purpose-built for a different operational priority, all sharing a common architectural foundation.
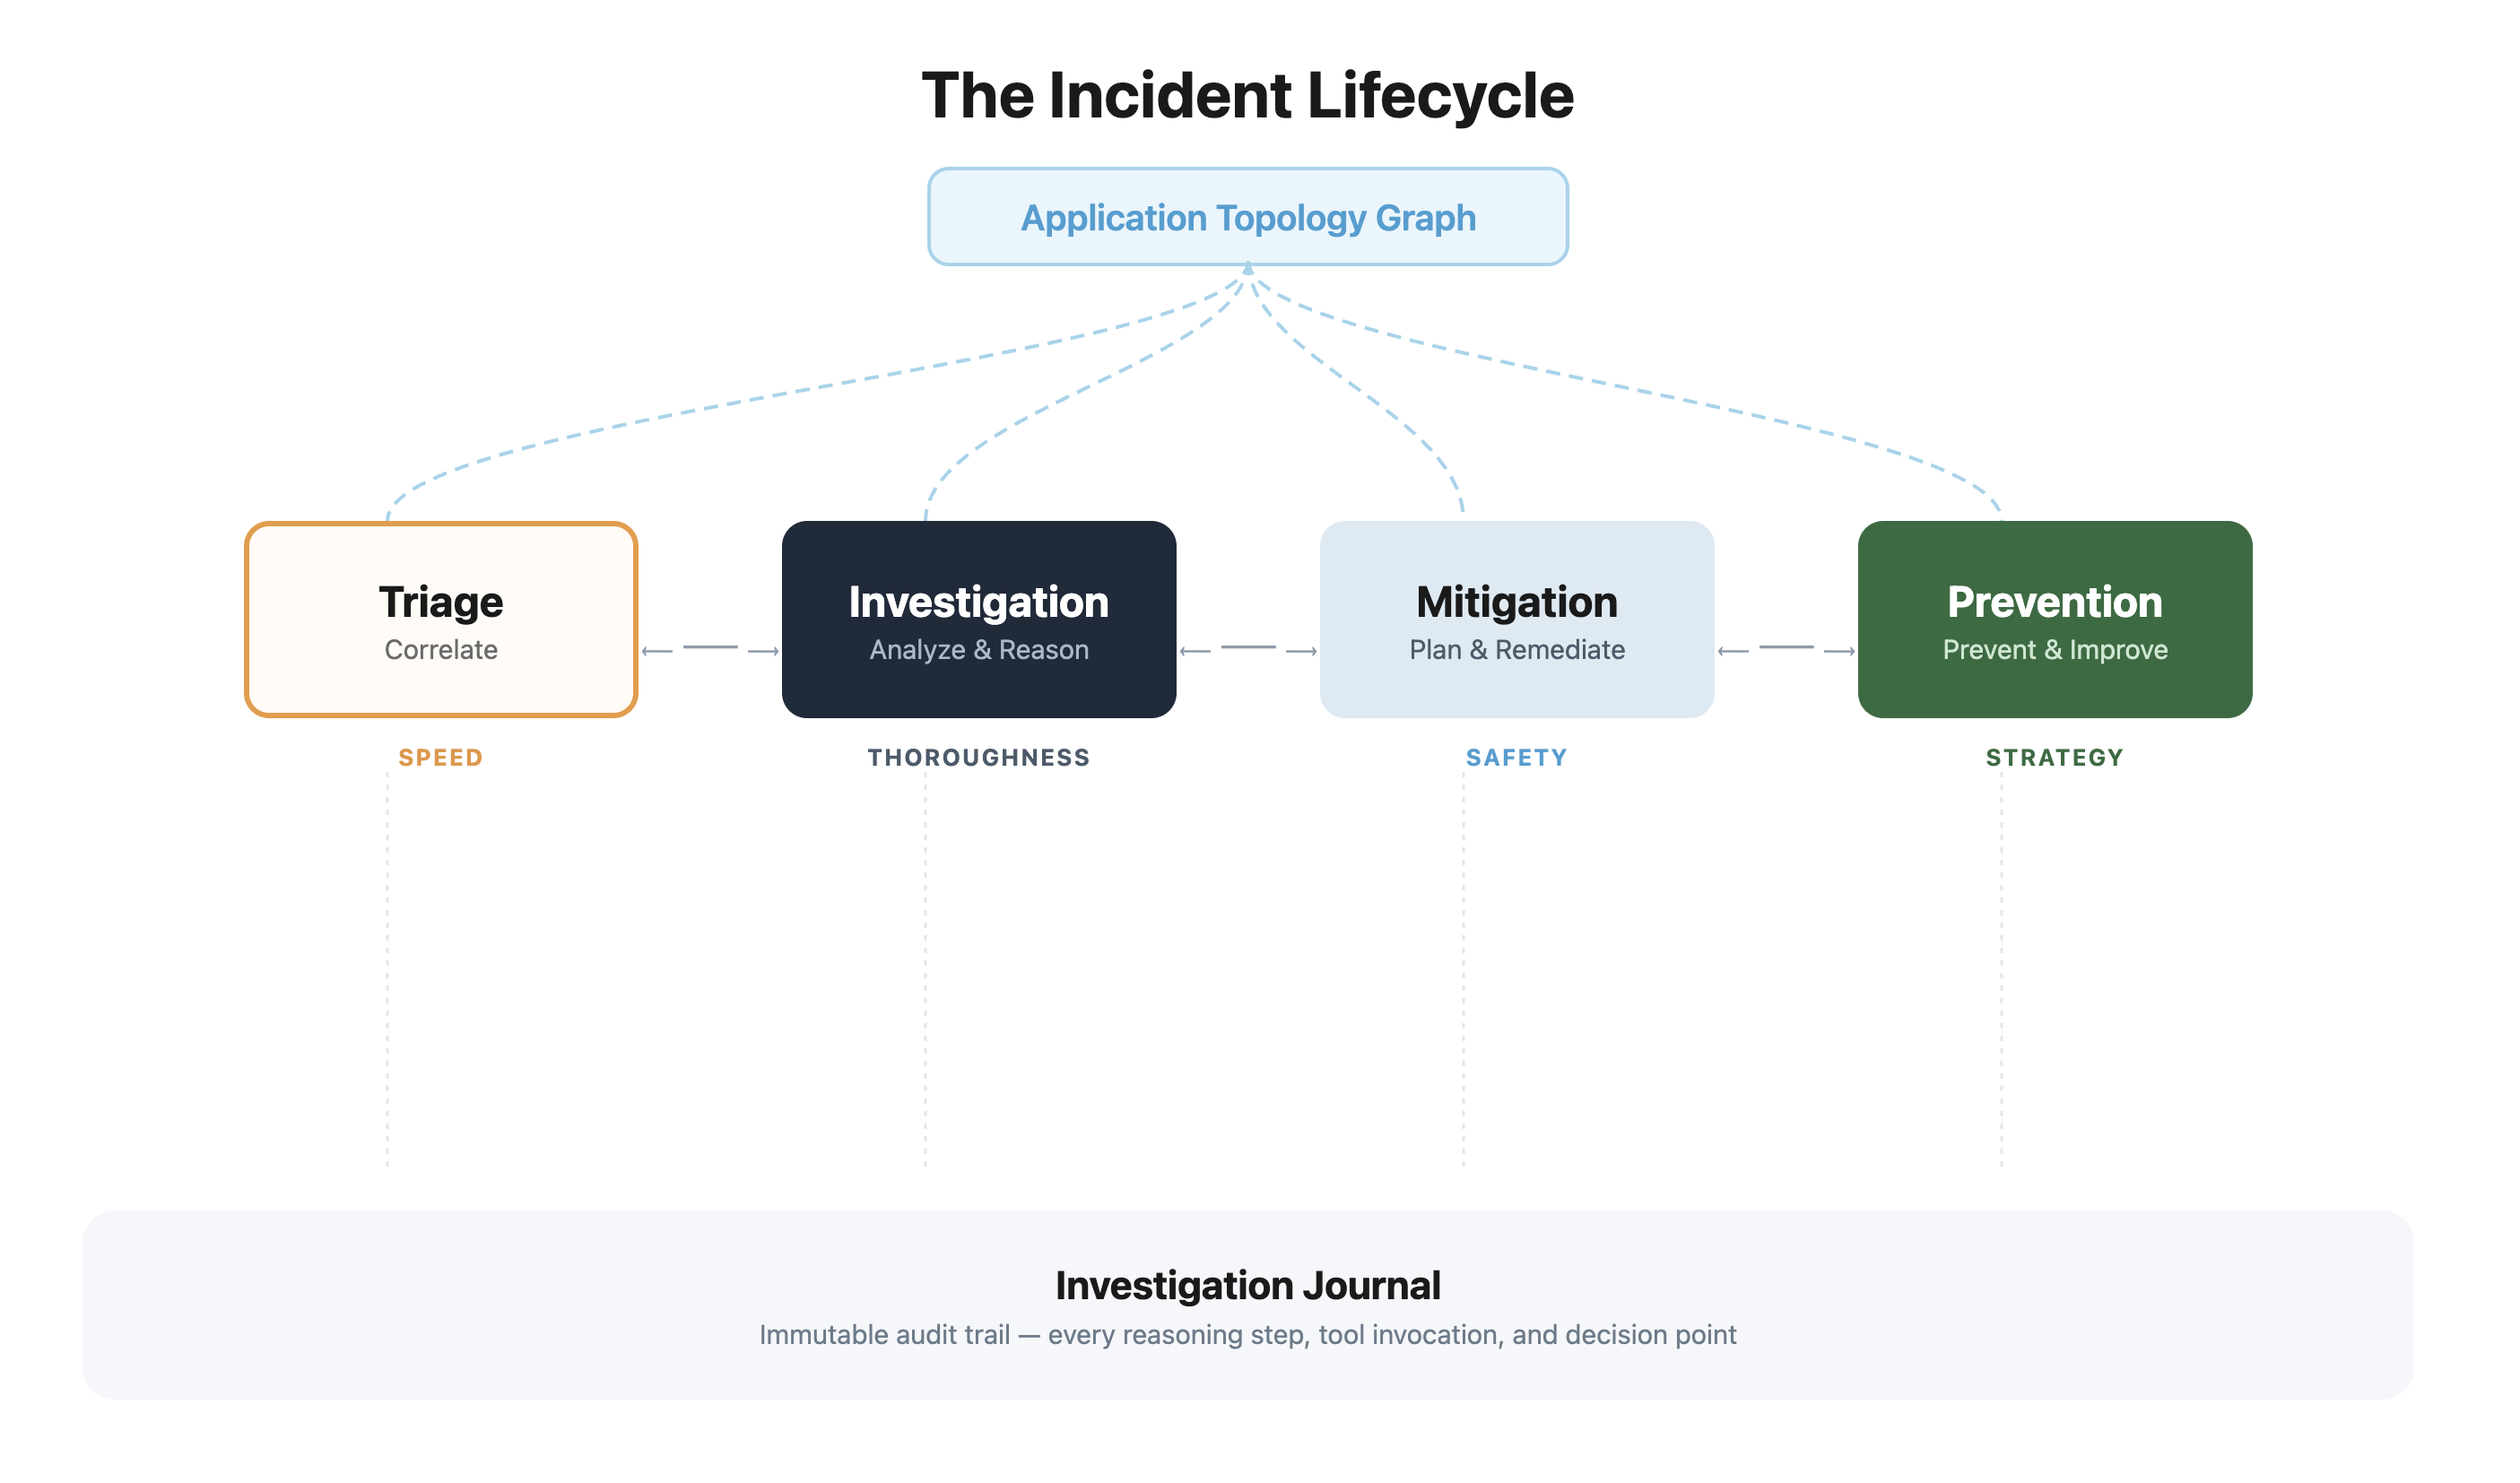
The topology graph provides the architectural foundation. The Topology Graph feeds context across the lifecycle and the Investigation Journal runs as a continuous audit trail beneath it. Each capability above it is purpose-built for a different operational priority.
-
- Triage — Correlates incoming signals with related alerts and enriches investigations with correlation context. Optimized for speed.
- Investigation — Deep multi-phase root cause analysis with parallel hypothesis generation and counter-evidence validation. The core reasoning engine.
- Mitigation — Generates immediate remediation actions based on the root cause identified by Investigation.
- Prevention — Analyzes patterns across historical incidents to prevent future occurrences.
All capabilities share a critical dependency: the application topology graph. Before we follow an incident through the lifecycle, let’s look at how that foundation is built.
Topology: The foundation everything depends on
Before the agent can investigate an incident, it needs to understand your architecture — not just a static inventory of resources, but a living map of how they relate, how they communicate at runtime, and how they connect back to the code that deploys them.
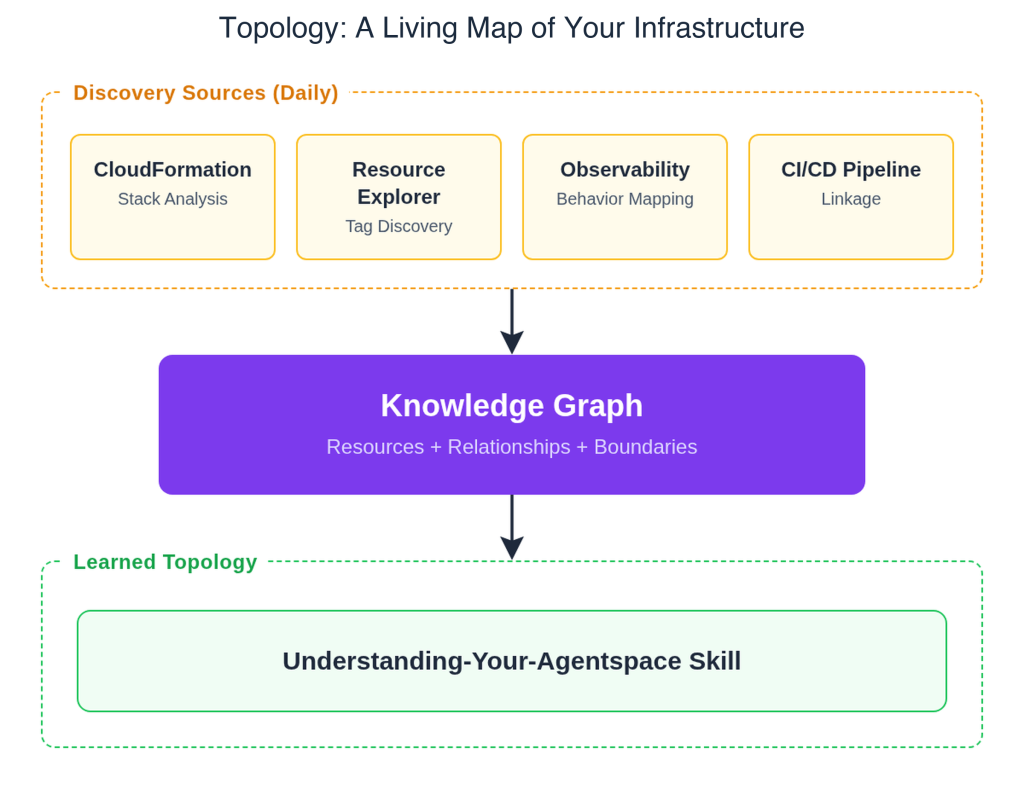
The topology engine builds this understanding through complementary discovery approaches: AWS CloudFormation stack analysis (including AWS CDK since it synthesizes to AWS CloudFormation), tag-based discovery through AWS Resource Explorer, behavioral mapping through CloudWatch Application Signals and third-party platforms like Dynatrace, Datadog etc. that reveals runtime communication patterns, and CI/CD pipeline integration like GitHub Actions, GitLab CI/CD that links resources back to deployment processes and specific code changes.
The result is a learned topology — built and continuously refined by the understanding-your-agentspace skill — that captures static infrastructure relationships, runtime communication patterns, and deployment lineage. When Investigation needs to trace a failure through dependencies, it follows the graph’s edges. When Mitigation needs to assess the impact radius of a proposed fix, it checks the graph’s relationship map. Without this foundation, the agent would be searching blindly through telemetry. With it, the agent reasons about your system with architectural context – following dependencies, checking blast radius, and correlating with recent changes.
All of this operates within an Agent Space — a logical container scoped to a team, service, or application. Each Agent Space maintains its own topology graph, investigation history, and integrations in full isolation from other spaces.
With the architectural foundation in place, let’s follow an incident through the lifecycle.
Triage: Fast classification and correlation
When an incident arrives — whether from CloudWatch Alarms, third-party tools like ServiceNow, PagerDuty, or Grafana, or through manual initiation — Triage activates first.
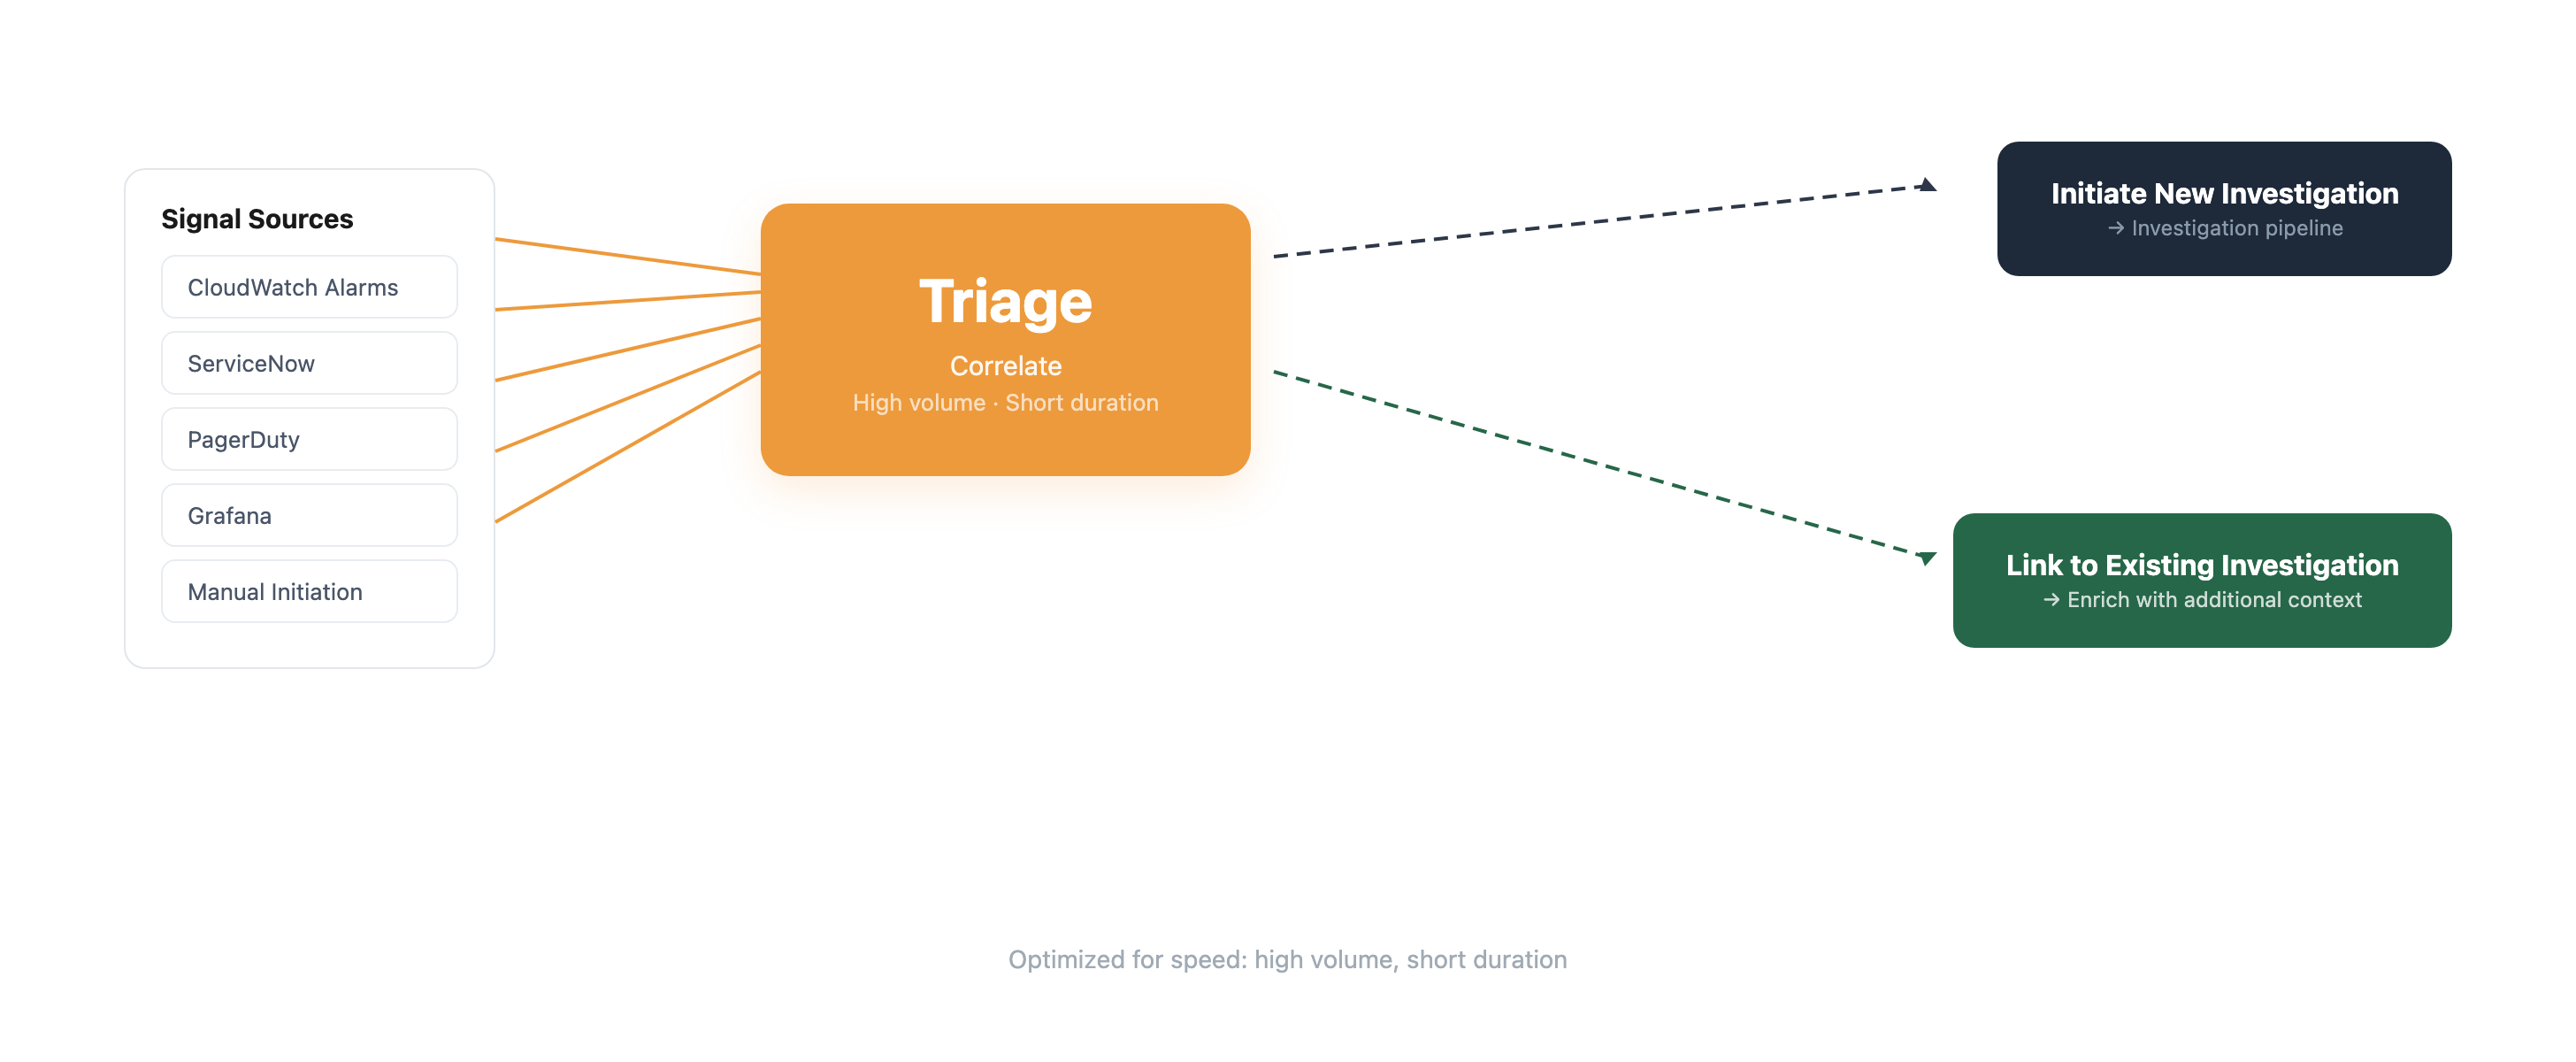 Triage is optimized for speed — high volume, short duration. It correlates incoming signals with related alerts and enriches investigations with correlation context.
A key part of Triage is correlation: the agent automatically correlates related alarms to identify when they originate from the same event. This accelerates incident response by immediately understanding which alarms are related and which require separate investigation — reducing noise and enabling teams to focus on the most critical issues first. In a complex distributed system, a single root cause can generate alerts across different services and monitoring tools; without correlation, each alert would spawn its own investigation, fragmenting the response team’s attention. With it, the agent funnels related evidence into a single, comprehensive investigation.
Correlation isn’t a one-way door. If the agent links alerts that an operator believes are unrelated, the operator can unlink them and spawn a separate investigation. The agent makes the initial correlation decision at machine speed; the human retains full control to override it.
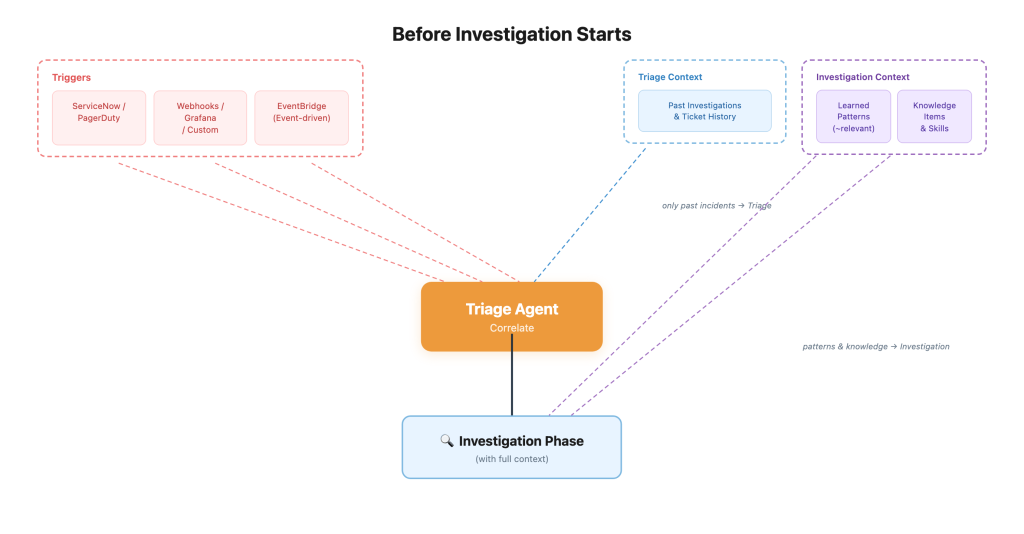
Once Triage has correlated the incoming signals and enriched the investigation with context, the Investigation capability begins its deep analysis.
Investigation: The Reasoning Engine
Investigation is the centerpiece — where AWS DevOps Agent’s architecture diverges from conventional AI-assisted troubleshooting. It follows a structured methodology that mirrors how experienced DevOps engineers work: acquire context about what’s affected and what changed, collect evidence across every connected data source, generate multiple competing hypotheses simultaneously, subject each to both supporting and counter-evidence validation, and converge on root cause only when the evidence demands it. Operators can steer the investigation at any point through natural language, with the journal recording how those inputs influenced the agent’s reasoning.
Context Acquisition and Data Collection
Every investigation starts with two questions: what’s affected and what changed recently?
The agent parses the incoming signal to understand scope — which resources show symptoms, what time window matters, and what the operator already knows. It then walks the topology graph outward from those resources, mapping the blast radius: direct dependencies, upstream producers, downstream consumers. It pulls recent deployment activity from connected CI/CD pipelines and checks whether the current pattern resembles anything it has investigated before.
With that situational map in hand, the agent casts a wide evidence net. It pulls time-series metrics alongside a healthy baseline so it can spot deviations, not just absolute values. It queries log streams across connected observability platforms — CloudWatch, Splunk, Datadog — filtered to the relevant resources and error signatures. It collects distributed traces showing how requests flowed through affected paths. It also captures configuration state and assembles a chronological timeline of deployments, config changes, scaling events, and alarm triggers.
Hypothesis Generation
With evidence collected, the agent generates multiple competing root-cause theories simultaneously — each one a different lens on the same data.
Some hypotheses come from pattern matching: the symptoms resemble a known failure signature from previous investigations. Others emerge from anomaly detection: a metric that was stable for weeks just deviated sharply from its baseline. The agent also checks temporal correlation with recent deployments, evaluates whether upstream or downstream services are showing their own problems, and looks at resource constraints — connection pools, CPU headroom, quota limits — that could explain degradation under load.
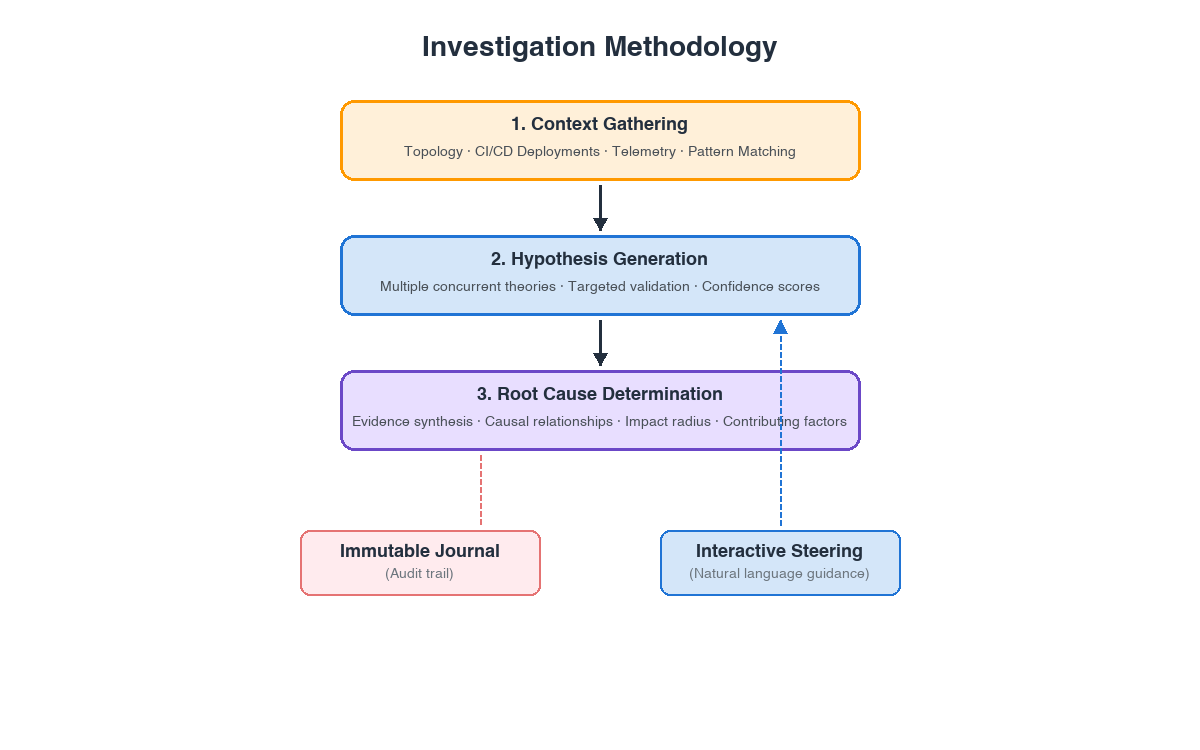 The agent pursues multiple hypotheses simultaneously, validating each with both supporting evidence and counter-evidence before surfacing them to operators. As the agent builds the causal chain, it classifies validated hypotheses as either a ’cause’ or ‘root cause’ based on their connection to the incident, and labels unconnected findings as hypothesis.
Evidence Gathering and Root Cause Determination
The agent validates multiple hypotheses simultaneously, testing each against both supporting and counter-evidence before surfacing them to operators.
Here’s what that looks like in practice. An e-commerce platform’s checkout service — the critical path between a customer clicking “Place Order” and payment processing — starts showing latency spikes during peak traffic. Orders are timing out, and the on-call team is getting paged.
The agent generates three hypotheses: a config change was pushed 20 minutes before onset, the payment gateway is returning slow responses, and the database connection pool is nearing capacity. All three are plausible — an engineer under pressure might pick whichever one they check first and run with it. The agent checks all three simultaneously. It examines the config change and finds it only affected logging verbosity — it couldn’t have impacted request latency. Theory eliminated. It confirms the payment gateway is indeed slow, but digs deeper and discovers that slowness started after the checkout latency began — the gateway is a symptom, not the cause. Theory eliminated. The connection pool, at 94% capacity, correlates with the exact onset time — and nothing contradicts it. That’s the root cause.
The agent then synthesizes evidence across remaining hypotheses — distinguishing correlation from causation, identifying primary and contributing causes, and flagging ambiguity when evidence isn’t conclusive.
With root cause established, the investigation’s final output is a structured mitigation plan — and this is where the agent’s safety-first design becomes critical.
Mitigation: Safe by default
The mitigation plan follows a deliberate structure: remediation strategy, step-by-step procedures, validation checks to verify system state before applying changes, success criteria to assess whether the fix worked, and rollback procedures to reverse it if something goes wrong.
AWS DevOps Agent generates mitigation plans but does not execute remediation actions on the operator’s behalf — the agent’s write capabilities are restricted to ticket and support case creation. The plans themselves can recommend write actions including specific commands, configuration changes, or code modifications, but execution remains with the operator. Every plan includes rollback procedures to reverse the mitigation if it introduces new problems. The agent uses topology awareness to assess the blast radius before recommending any change — the same graph that helped trace the root cause now helps understand the impact of the proposed fix.
This is a deliberate design choice. In production incident response, the most dangerous moment isn’t when you’re investigating — it’s when you’re applying a fix under pressure. By separating the recommendation from the execution, the agent helps ensure that a human reviews the plan, validates the rollback procedure, and makes the conscious decision to proceed.
Prevention: From reactive to proactive
The most valuable pattern the agent finds isn’t in any single incident — it’s across incidents. The Prevention capability clusters past incidents by shared root causes, even when their surface symptoms looked completely different. A latency spike in your API, a timeout in your batch processor, and an error rate in your notification service might all trace back to the same database scaling issue — but without pattern analysis, they appear as three unrelated incidents.
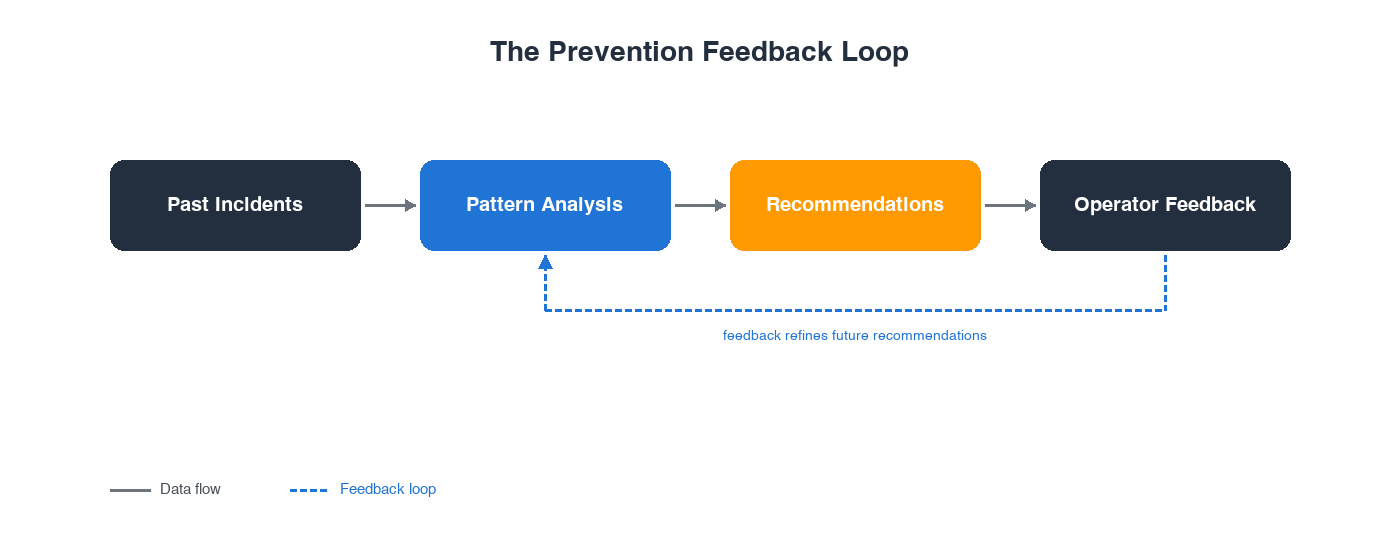
These patterns produce targeted recommendations across observability enhancements like monitoring gaps, alert tuning, and tracing coverage; testing and validation improvements like deployment validation and chaos engineering practices; code resilience patterns like retry logic, circuit breakers, and error handling; infrastructure optimization like capacity planning, autoscaling, and right-sizing; and governance guardrails like pipeline bake time suggestions, test validation gates, and pipeline integration tests.
Recommendations aren’t static. Operators accept them into their backlog or reject them with natural language feedback that refines future suggestions. Recommendations persist until operators explicitly act on them, keeping teams in control of their backlog.
Investigation can help reduce mean time to resolution. Prevention can help reduce incident count. Over time, fewer incidents compound into significant engineering hours saved — and the agent’s recommendations become more targeted with every cycle. The more it investigates, the more it prevents. The more it prevents, the fewer incidents your team faces.
Conclusion
AWS DevOps Agent connects these capabilities into an operational flywheel. The topology graph gives every stage architectural awareness — Investigation follows it to trace failures, and Mitigation checks it to assess blast radius. Investigation findings flow into Prevention, which clusters them to find patterns that individual incidents can’t reveal. Prevention recommendations improve the environment, which changes what the next investigation encounters — each cycle can make the system stronger and the next incident faster to resolve.
If you’ve been on call, you know the pressure — it’s late in the night, you’re switching between dashboards, notifications are flooding in, and you’re weighing whether the fix you’re about to apply could make things worse. AWS DevOps Agent is built to help in that moment — competing theories have already been tested against counter-evidence, the reasoning is documented in an immutable journal, and the mitigation plan includes rollback procedures.
The topology graph, investigation history, and prevention recommendations persist across team changes. Operational context that once lived only in an engineer’s head now lives in the system — available to whoever is on call next.
We’d love to hear how you approach incident investigation — what’s worked, what hasn’t, and what you’d want an AI agent to handle. Share your thoughts in the comments below.
Create your first Agent Space within AWS DevOps Agent in the AWS Management Console and start your first investigation.