AWS DevOps & Developer Productivity Blog
Investigate DMS migration issues with AWS DevOps Agent
Migrating a production database is a high-risk operational event. AWS DMS is a cloud service that migrates relational databases, data warehouses, and other data stores into the AWS Cloud or between environments. It moves the rows reliably, but the failures that page an on-call engineer rarely happen during the data copy. They occur in the hours after the cutover. A query that was fast on the old engine starts doing full scans. A connection pool sized for the old database becomes exhausted. A downstream service that nobody mapped begins timing out.
These are operational problems, not data problems. They resolve slowly because engineers must correlate many sources under time pressure: DMS task state, Amazon CloudWatch metrics, Amazon RDS Performance Insights, logs, and deployment history.
AWS DevOps Agent can investigate and troubleshoot your database migration issues. DevOps Agent is your always-available teammate that accelerates and validates the deployment of code changes, then keeps your applications running optimally across AWS, multicloud, and on-prem environments. It learns about your resources and their relationships, then correlates telemetry, code, and deployment data to pinpoint root causes and recommend fixes. When issues arise, it autonomously investigates and resolves them.
In this post, you’ll learn how to extend AWS DevOps Agent into a DMS migration specialist. You deploy a sample Model Context Protocol (MCP) server that gives the agent read-only, migration-specific tools and a library of runbooks. You’ll then watch the agent investigate real migration issues and reach grounded root causes on its own. The accompanying GitHub repository includes the full source and a deployment guide.
Prerequisites
Before you begin, make sure you have the following:
- An AWS account with AWS DevOps Agent turned on and an Agent Space created. Note the Agent Space ID.
- An active AWS DMS replication task that migrates to Amazon Aurora PostgreSQL-Compatible Edition, with data validation turned on. The repository includes scripts that provision a test migration if you need one.
- Permissions to deploy AWS CloudFormation stacks that create AWS Lambda functions, IAM roles, and an S3 bucket.
- The AWS Command Line Interface (AWS CLI) v2 configured, and Python 3.10 or later. No Node.js or CDK is required.
Architecture
DevOps Agent runs inside AWS. It reaches the MCP server over HTTPS and authenticates each request with AWS Signature Version 4 (SigV4). SigV4 is the same IAM mechanism that every AWS API uses, with no keys or shared secrets. The sample deploys your MCP server onto AWS Lambda, behind a Lambda function URL with the AWS_IAM auth type. That auth type accepts only SigV4-signed requests from authorized principals.
The following diagram shows the request path from the agent to the tools.
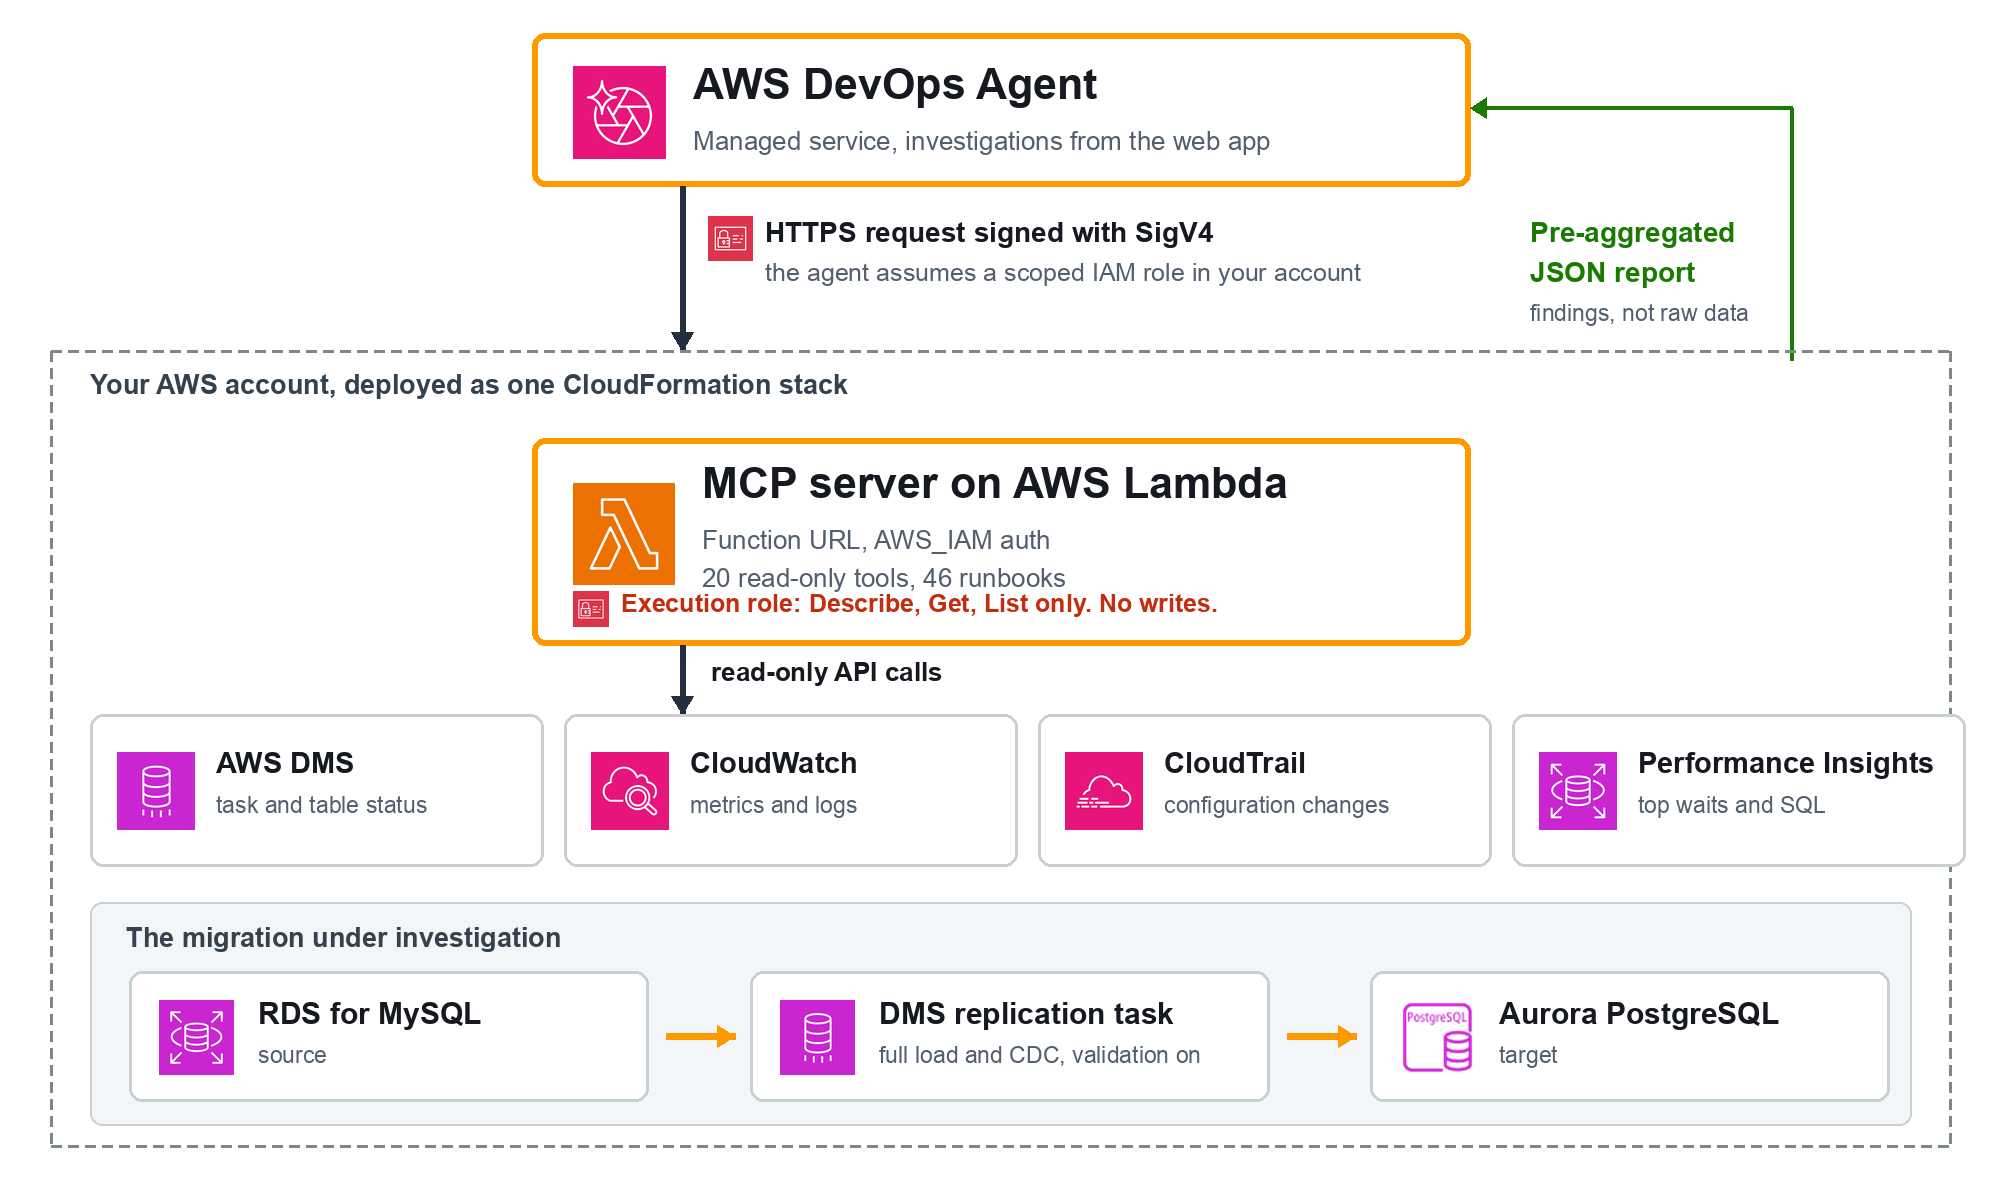
You deploy the server and its IAM roles as one AWS CloudFormation stack. You then register the function URL with DevOps Agent and add the tools to the allow list in your Agent Space. When a symptom appears, you create an investigation. The agent assumes the role, calls the tools, correlates the results, and returns the root cause.
Implementation walkthrough
DevOps Agent supports custom tools through MCP. After you deploy the sample server and register it, the agent calls its tools during an investigation, the same way it calls a CloudWatch tool. Every tool in this server calls only Describe*, Get*, List*, Lookup*, and TestConnection APIs. None of them modifies a resource, which is the property that lets you give them to an autonomous agent.
The MCP exposes 20 tools across the migration lifecycle. The following table lists the ones the agent reaches most often.
| Tool | Returns |
|---|---|
validate_migration_data |
Validation state distribution, failed and suspended tables (report and skill prompt) |
get_validation_failures |
Tables in non-Validated states with failed and suspended record counts |
check_connection_health |
Endpoint connectivity (waits for the real test result), SSL mode, failure messages |
analyze_cdc_latency |
Source vs target CDC latency, backlog, and an assessment |
check_replication_instance_health |
Replication-instance CPU, memory, swap, storage, network with flags |
capture_aurora_performance |
Aurora CloudWatch metrics and Performance Insights waits and SQL |
check_stabilization |
Post-cutover regressions, missing alarms, recommendations (report and skill prompt) |
summarize_task_health |
One-call roll-up across status, validation, latency, and instance health |
list_runbooks / get_runbook |
Browse the runbook catalog and fetch one by id |
The server also ships 46 runbooks covering data validation, full load, CDC, connectivity, replication-instance health, Aurora target health, and cutover readiness.
Database migration stages
You can apply this approach across the migration timeline:
- Pre-cutover readiness: Confirm endpoint connectivity and that every table has reached the
Validatedstate before you commit to the switch. - Issue investigation during cutover: You give the agent a symptom, such as a validation mismatch or a latency spike, and it finds the root cause instead of several engineers chasing parallel theories.
- Post-cutover stabilization: Detect regressions and missing alarms on the new database before they turn into outages.
What the agent sees, and what it does not
Out of the box, DevOps Agent reads Amazon CloudWatch, AWS CloudTrail, and the AWS APIs in your account. However, for a DMS migration, the agent needs to read migration-specific reasoning an operator applies: how to read a DMS validation state distribution, how to tell a source-side change data capture (CDC) bottleneck from a target-side one, or which alarms a freshly promoted Aurora instance should have but it only has access to raw CloudWatch metrics.
You close that gap with the sample MCP server:
- Read-only tools that turn DMS, CloudWatch, and Performance Insights data into pre-aggregated reports. The tools do the counting deterministically, and the agent does the interpretation.
- Runbooks the agent can browse and follow, each grounded in public AWS documentation.
Deploy the MCP server
The MCP server runs on AWS Lambda, the serverless compute service that runs your code without provisioning servers. AWS DevOps Agent reaches it through a Lambda function URL, a dedicated HTTPS endpoint for the function. You do not run or host anything yourself; the deployment creates the Lambda function and its endpoint in your account.
The endpoint is not open to the public. It uses the AWS_IAM auth type, so it accepts only requests that DevOps Agent signs with an IAM role in your account, as described in the architecture section above.
Deploying and registering are two distinct steps. Deploying creates the server: the Lambda function, the function URL, and the IAM roles. Registering tells DevOps Agent that the server exists and adds its tools to the allow list. You can select either of the two options as indicated below.
Option A: Deploy MCP and register via AWS Management Console
Deploy the MCP and perform the MCP registration manually via console:
./deploy.sh us-east-1 --skip-registerThe script deploys the MCP server and prints its Function URL and role ARN, then leaves the registration to you. With the server deployed, register it in the console by following Connecting MCP servers:
- Sign in to the AWS Management Console and open the AWS DevOps Agent console.
- On the Capability Providers page, find MCP Server under Available providers and choose Register.
- On the MCP server details page, enter a Name, the Endpoint URL (the function URL from the stack output), and an optional Description.
- For the authorization method, choose AWS SigV4, enter the role ARN from the stack output, set the Region to
us-east-1, and set the service name tolambda. - Open your Agent Space, go to the Capabilities tab, and add the tools to the allow list.
Option B: Deploy MCP and register with one click deployment
Alternatively, you can deploy the MCP and perform the MCP registration with one-click deployment. Complete the following steps to deploy and register the server.
- Clone the repository and change to the deployment directory:
git clone https://github.com/aws-samples/sample-dms-devops-mcp.git
cd sample-dms-devops-mcp/lambda_mcp- Run the deployment script with your target Region:
./deploy.sh us-east-1The script prompts for your Agent Space ID. It then packages the Lambda code, deploys the CloudFormation stack, and registers the server with your Agent Space, allow-listing all of its read-only tools.
- Verify the deployment. In the DevOps Agent console, open your Agent Space, go to the Capabilities tab, and confirm the tools appear under MCP Servers.
If registration returns HTTP 403, confirm the IAM role grants both lambda:InvokeFunctionUrl and lambda:InvokeFunction. Granting only the first returns 403. The template grants both.
Review and investigation
To validate the approach, we ran it against a live migration: an Amazon Relational Database Service (Amazon RDS) for MySQL source replicating to Aurora PostgreSQL through a DMS task with data validation turned on, 1,000 rows across four tables (customers, products, orders, and order_items). Every query and response below is from a real DevOps Agent investigation against that environment. You start each one by entering a prompt in the DevOps Agent web app, the conversational interface where you investigate issues and review findings.
A consistent pattern shows up across all five investigations: the agent chooses a different set of tools for each question. It is reasoning about which tool fits, not running a fixed script.
The five scenarios are not demo picks. Each one represents a class in the DMS failure taxonomy the server’s 46 runbooks cover: data validation, full load, change data capture, connectivity, replication-instance health, Aurora target health, and cutover readiness. That taxonomy is the operational surface of a real migration, so a reader who follows these five is rehearsing the categories they are most likely to hit, not a curated happy path. Each scenario below is one representative of its class; the full catalog is available to the agent through list_runbooks.
Pre-Migration: Confirm cutover readiness
Before a cutover, you want a clear go or no-go.
Query
We are about to cut over the DMS migration (task dms-mcp-test-task, us-east-1, target Aurora dms-mcp-test-target). Before we switch the application, confirm whether this migration is ready: are the endpoints healthy and has all data validated? Give me a clear go or no-go.
Response
The agent chose exactly the go/no-go gate tools: check_connection_health and validate_migration_data for the readiness signals, plus get_task_status, get_validation_failures, list_table_statistics, and analyze_cdc_latency to confirm the full picture. The connection-health tool waits for the real endpoint test result rather than reporting that a test merely started, and the validation tool confirms whether DMS actually compared source and target rows and found them equal, not just that the full load reached 100 percent. In our test runs the agent returned this go/no-go in under two minutes, against the fifteen to thirty minutes an operator typically spends cross-checking endpoint tests, task status, and per-table validation state by hand. (Illustrative from our runs, not a benchmark.)
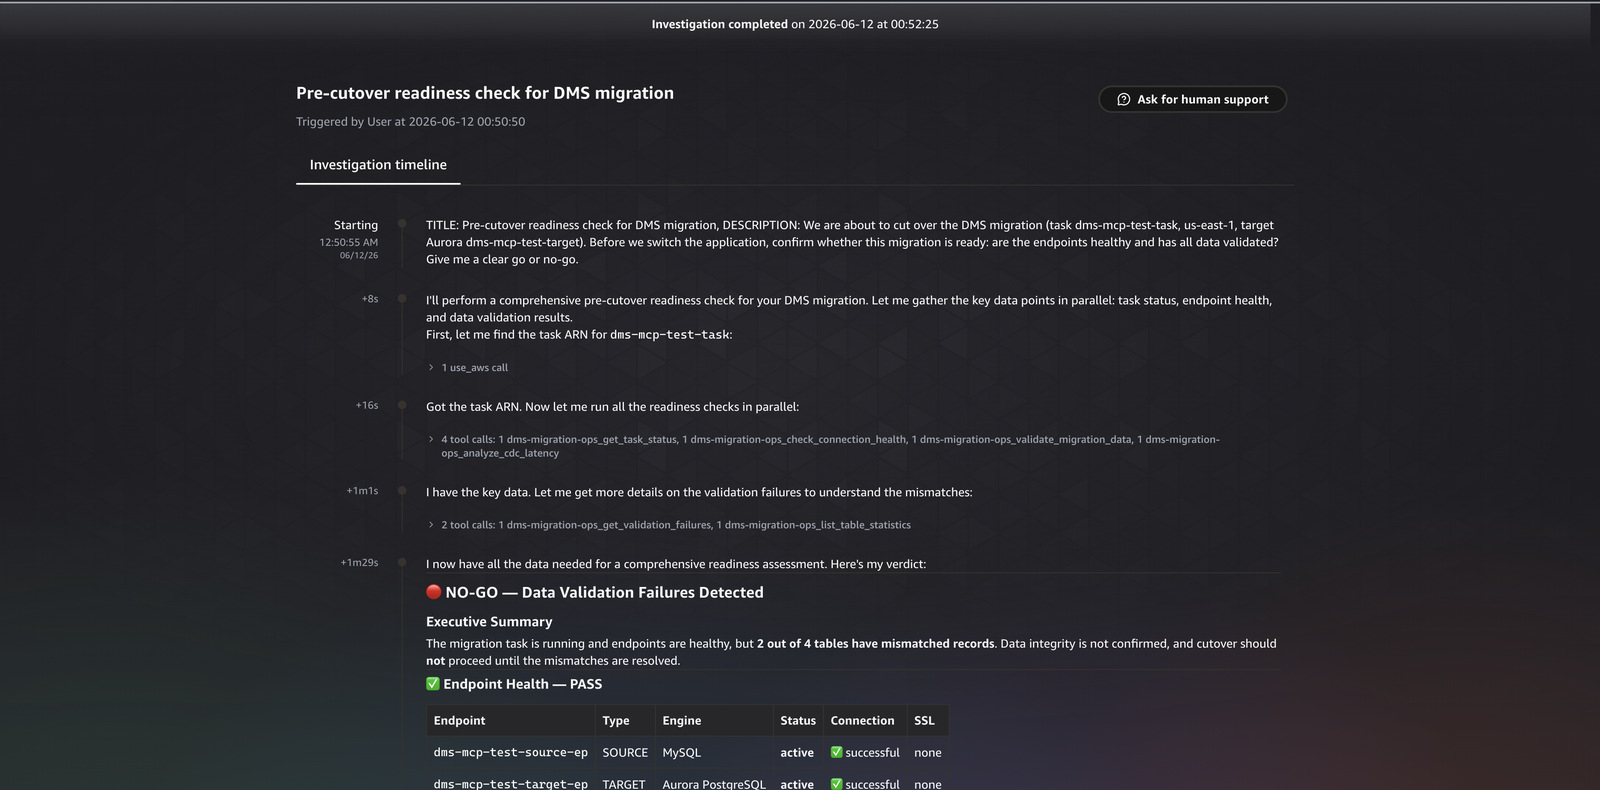
Figure 1. The readiness check, showing endpoint health and validation state feeding a go/no-go assessment.
Migration: Investigate validation failures
To create a fault, we changed two rows directly on the Aurora target, bypassing DMS, which moved the customers and orders tables to the Mismatched records state.
Query
Our DMS migration to Aurora PostgreSQL (task dms-mcp-test-task in us-east-1, Aurora instance dms-mcp-test-target) is reporting data validation failures on some tables. Investigate the root cause and tell me how to fix it.
Response
The agent ran a deep investigation across 73 journal records, calling 11 of the registered tools (33 tool calls in total). It started with get_task_status, get_validation_failures, validate_migration_data, and list_table_statistics to establish which tables had diverged, then used search_task_logs, correlate_cloudtrail_changes, get_recent_task_events, analyze_cdc_latency, capture_aurora_performance, describe_endpoints, and get_premigration_assessment to build the timeline. It identified both affected tables and produced these findings:
 Finding: CDC changes not applied to target before validator compared rows
 Source modifications occurred on customers and orders at ~05:37:18 UTC.
 The validator compared at 05:37:41 UTC, 23 seconds later, before CDC applied
 them to Aurora. Evidence: CDC captured 17 source events but target id was 0
 (no changes applied), and TARGET_APPLY logs showed "waiting for data from
 upstream" through the window.
 Finding: ValidationQueryCdcDelaySeconds set to 0 allows the validator to race
 ahead of  CDC replication.
That second finding is the difference between a dashboard and an investigation. The agent did not just report which tables failed. It named the exact DMS task setting (ValidationQueryCdcDelaySeconds) behind the transient failures and explained the mechanism, which is the fix an operator can act on. In our test runs the agent reached the ValidationQueryCdcDelaySeconds root cause in a single investigation of about three minutes, work that manually means correlating the failure table, CDC latency, CloudTrail, and task logs across four consoles, commonly thirty minutes or more. (Illustrative from our runs, not a benchmark.)
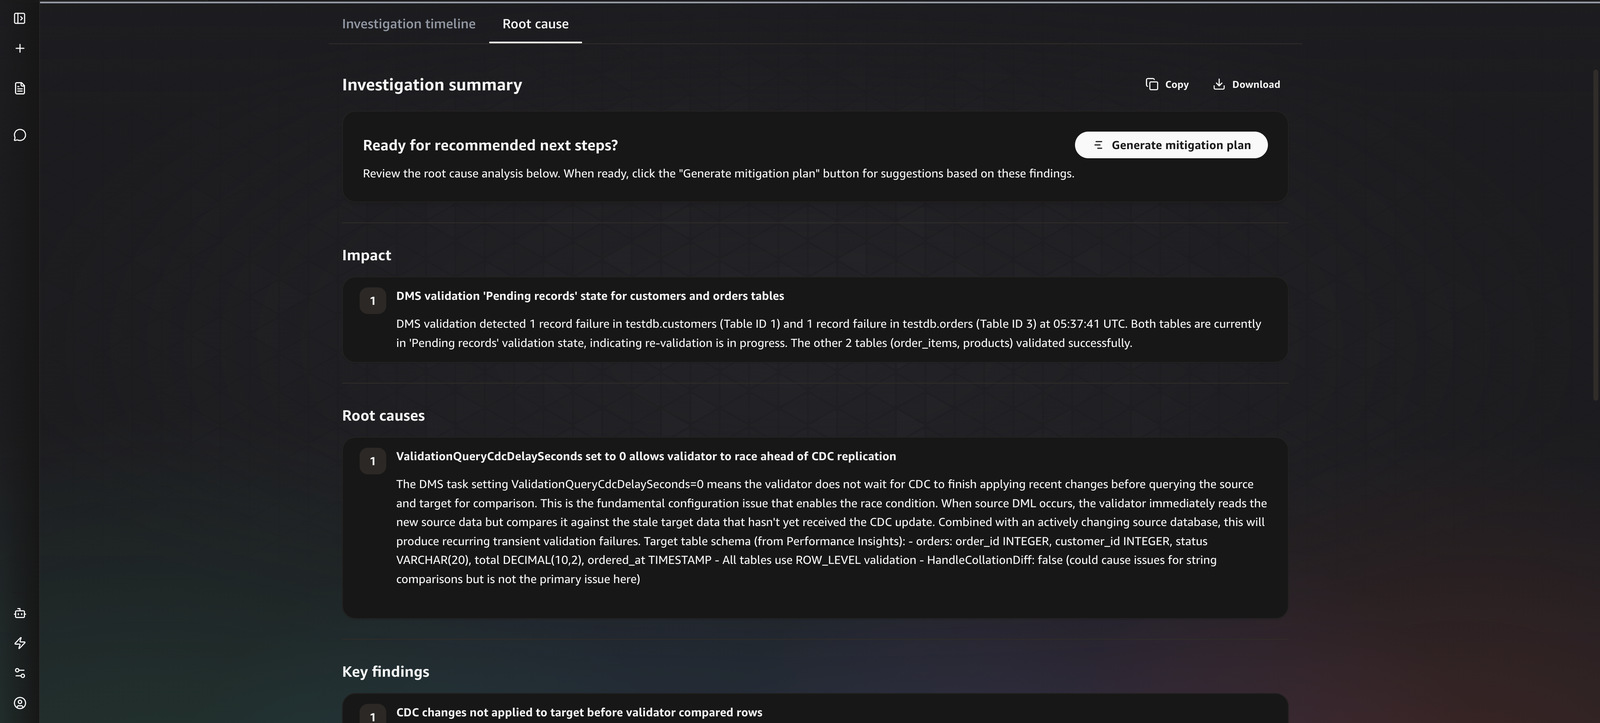
Figure 2. The DevOps Agent investigation for the validation failure, showing the tool timeline and the root-cause findings.
Migration: Assess replication latency
During ongoing replication, you want to know whether CDC is keeping up and where any delay sits.
Query
I want to understand the replication performance of our DMS task dms-mcp-test-task in us-east-1. Is the change data capture keeping up, and is the replication instance healthy or is it a bottleneck? Summarize the latency picture.
Response
The agent picked up the performance-specific tools: analyze_cdc_latency, check_replication_instance_health, and describe_replication_instance, with get_task_status and list_table_statistics for context. The latency tool compares source latency with target latency and returns an assessment, because the two together tell you where the delay sits. When source and target latency track each other, the bottleneck is the source side. When target latency runs well above source latency, the bottleneck is the target apply side. The instance-health tool flags CPU, memory, swap, and storage pressure that would make the instance itself the limit. In our test runs the latency assessment came back in roughly a minute, versus the manual path of pulling source and target CDC latency and instance metrics from CloudWatch and reasoning about which side leads. (Illustrative from our runs, not a benchmark.)
The latency tool also knows when it cannot answer. When the metric window is too sparse to separate source-side from target-side delay, it returns an insufficient_data verdict and asks for a longer window instead of forcing a conclusion from a handful of datapoints. This is deliberate: a confident but wrong root cause is worse than a request for more data. The agent surfaces that verdict to you rather than inventing a bottleneck, which is what makes its confident answers trustworthy when it does give them.
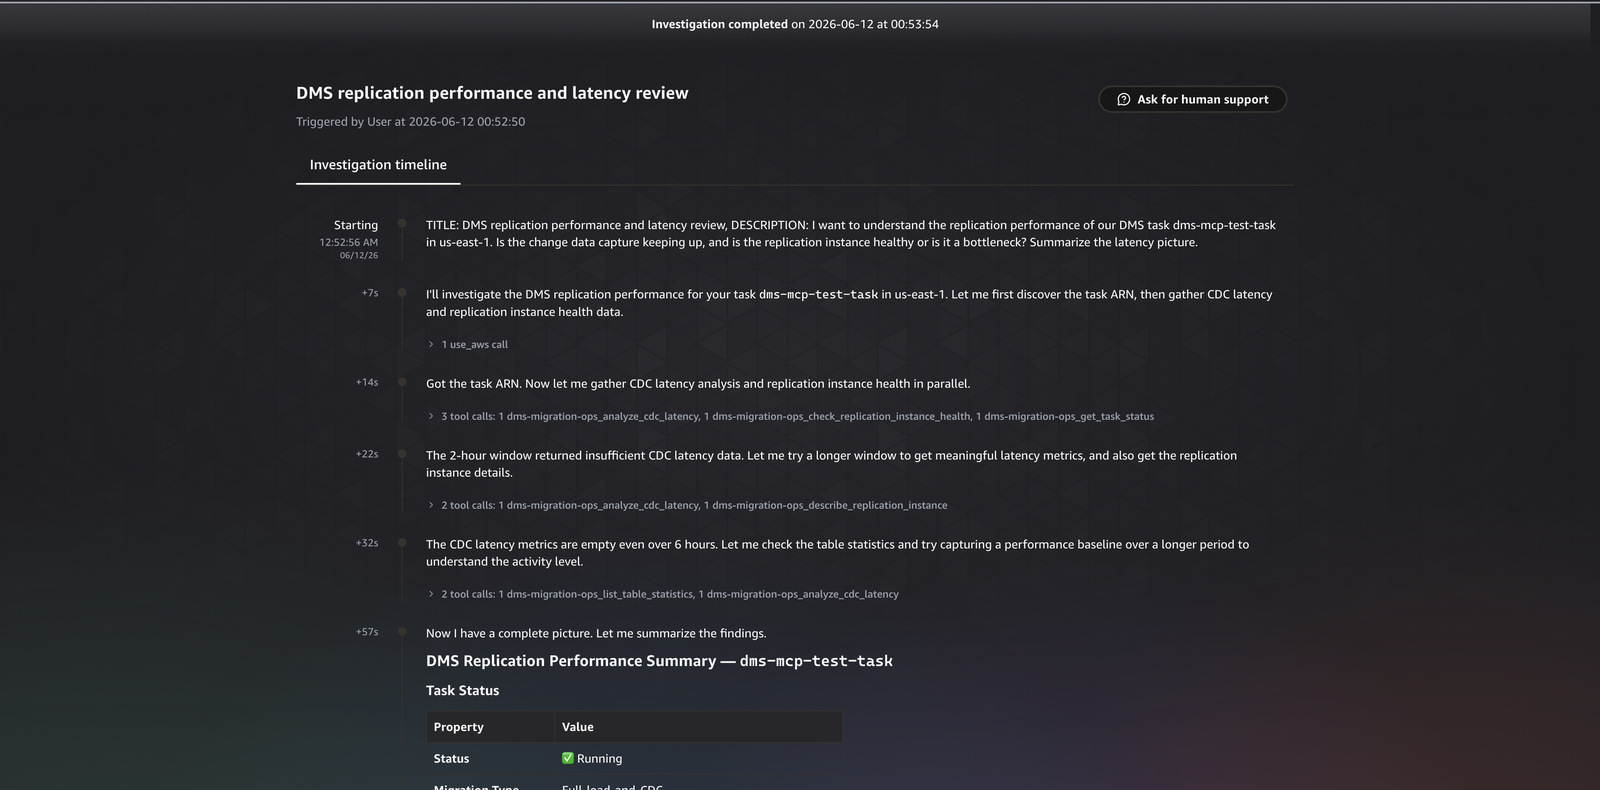
Figure 3. The replication latency assessment, comparing source and target CDC latency and instance health.
Migration: Run an open-ended investigation
Sometimes the operator does not know what is wrong yet. This is where the runbooks earn their place.
Query
Something seems off with our DMS migration (task dms-mcp-test-task, us-east-1, Aurora target dms-mcp-test-target) but I am not sure what. Investigate broadly, use any available runbooks that match what you find, and report the most important issue with how to fix it.
Response
Given no specific symptom, the agent ran the broadest investigation of the suite: 12 distinct tools across 43 records. It swept the task status, validation state, connectivity, latency, replication instance, endpoints, and logs, then called list_runbooks, recognized the validation symptom it had found, and fetched get_runbook for the matching runbook, which returned the full procedure. It produced a finding about a datatype or precision difference in the MySQL to PostgreSQL migration and followed the runbook to the recommended remediation. In our test runs this broad sweep of twelve tools resolved to a single prioritized finding in a few minutes, against the open-ended manual triage it replaces, which has no fixed time because the operator does not yet know where to look. (Illustrative from our runs, not a benchmark.)
Tools the agent chose: validate_migration_data, get_validation_failures,
list_table_statistics, check_connection_health, describe_endpoints,
describe_replication_instance, analyze_cdc_latency, summarize_task_health,
search_task_logs, correlate_cloudtrail_changes, list_runbooks, get_runbook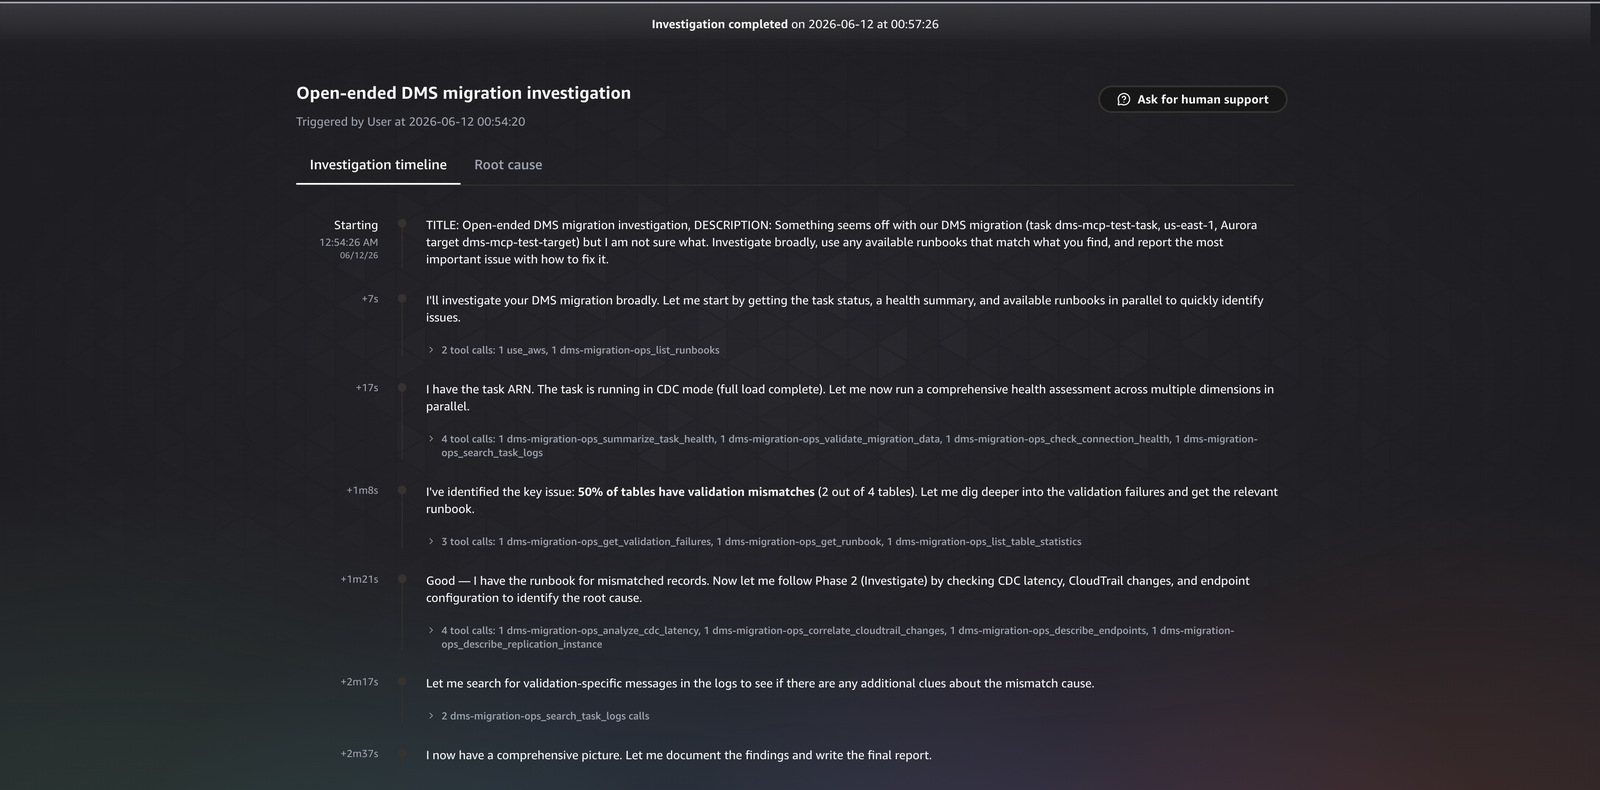
Figure 4. The open-ended investigation, showing the agent browse the runbook catalog and follow the matching runbook.
Post-Migration: Review stabilization and monitoring
After cutover, the question shifts from “did the data move” to “is the new database healthy and watched.”
Query
We just cut over to Aurora PostgreSQL (instance dms-mcp-test-target) from a DMS migration (task dms-mcp-test-task, us-east-1). Assess the target database health now and tell me what monitoring or alarms are missing that we should add before production traffic ramps up.
Response
The agent selected the stabilization tool set: check_stabilization, capture_aurora_performance, summarize_task_health, get_validation_failures, and check_pending_maintenance. It read the Aurora target health (CPU, connections, read and write latency, buffer cache hit ratio, and the top Performance Insights wait event), then assessed what monitoring was missing for a database about to take production traffic. The point of this phase is the interpretation: a buffer cache hit ratio that stays low after warmup points to missing indexes, and a new database with no alarm on connection count or query latency is one bad query away from an unmonitored outage. In our test runs the stabilization review returned target health and the specific missing alarms in about two minutes, versus manually inspecting Aurora metrics and Performance Insights and then deciding which alarms a freshly promoted database still lacks. (Illustrative from our runs, not a benchmark.)
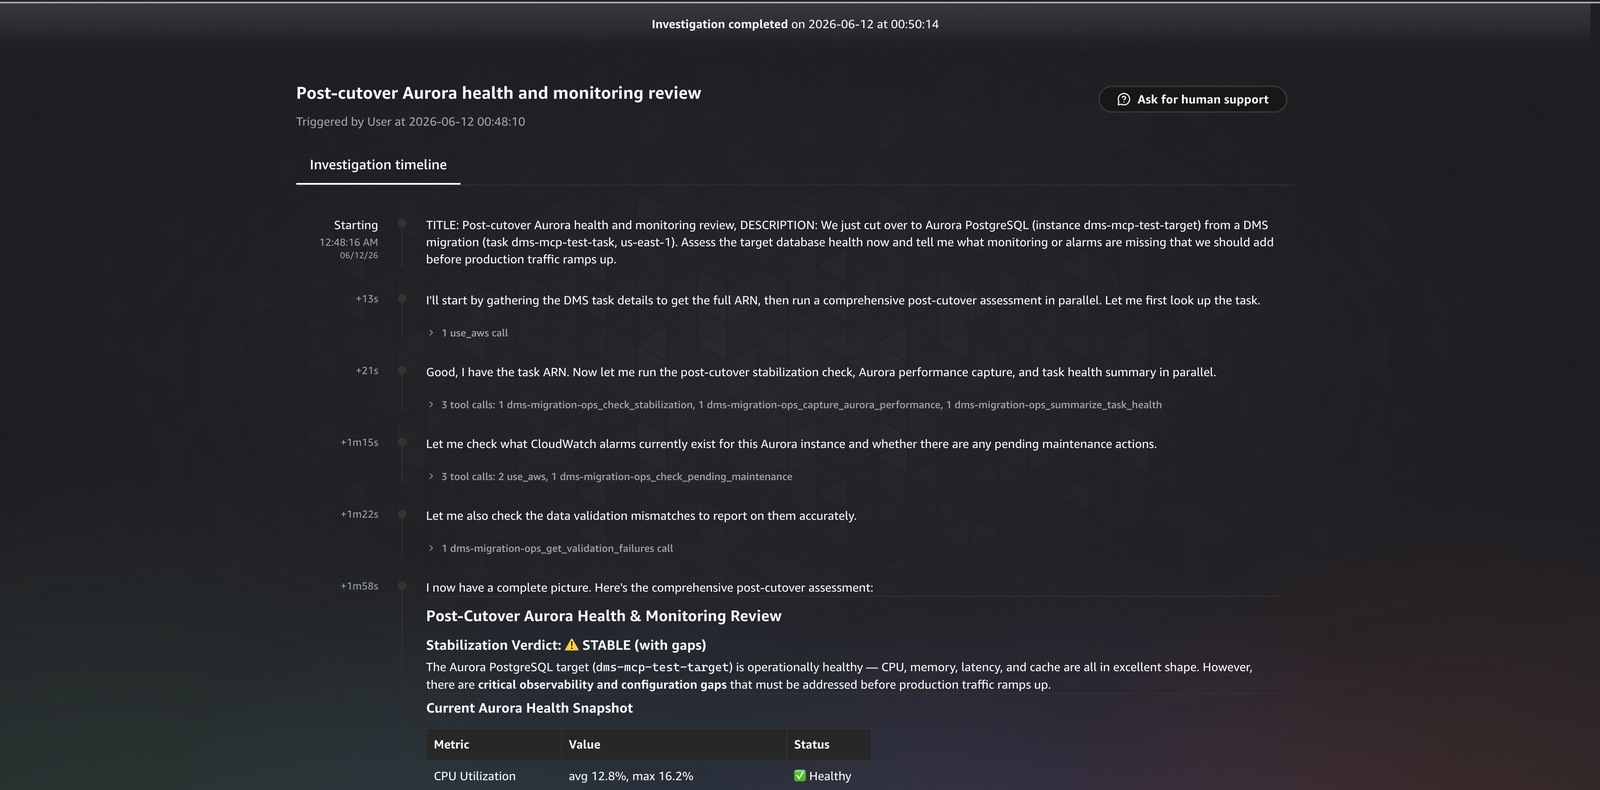
Figure 5. The post-cutover stabilization review, with target health and the monitoring gaps the agent flagged.
Improve the agent with Skills and runbooks
A finding like the ValidationQueryCdcDelaySeconds race condition should improve the next migration, not be relearned. The agent’s migration judgment is captured in two places. DevOps Agent Skills are Markdown instruction sets that load automatically when relevant and tell the agent when to call a tool and how to read its output. The runbooks are fetched on demand: the agent calls list_runbooks to browse the catalog, then get_runbook to pull the procedure that matches what it found, as it did in scenario 5. You can fold each new finding back into a skill or runbook, so the agent improves with every migration.
To make the flywheel concrete, here is the runbook the agent fetched in the open-ended investigation. When it found the validation symptom, it called get_runbook and received this procedure, authored from earlier findings and grounded in public AWS documentation:
---
id: validation-mismatched-records
title: "Validation: mismatched records on a table"
severity: HIGH
triggers:
  - "ValidationState=Mismatched records"
  - "ValidationFailedRecords>0"
tools:
  - get_validation_failures
  - list_table_statistics
  - analyze_cdc_latency
  - correlate_cloudtrail_changes
---

# Validation: mismatched records on a table

A table shows Mismatched records, meaning source and target rows differ.
The row-level diffs are recorded in the awsdms_validation_failures_v1
control table on the target.

## Phase 1 — Assess
- Run get_validation_failures to see which tables are in Mismatched records
  and the failed-record counts.
- Run list_table_statistics to confirm the per-table validation state.

## Phase 2 — Investigate
- Query awsdms_validation_failures_v1 on the target for the failing rows/columns.
- Run analyze_cdc_latency: if validation runs during heavy CDC, transient
  diffs can appear while changes are in flight.
- Run correlate_cloudtrail_changes to check for an out-of-band write or reload.
- Check for data-type, precision, timezone, or character-set differences.

## Phase 3 — Report
- State which tables diverged and by how many records.
- Name the most likely cause (type/precision, timezone, encoding, out-of-band write).
- Recommend revalidating the table after the cause is corrected.

## Remediation (operator action)
- Correct the underlying difference, then revalidate with validate-only.

> All steps use read-only MCP tools. Remediation actions are operator tasks
> and are not performed by the tools.
The judgment for when to apply a runbook lives in a DevOps Agent Skill, a Markdown instruction set that loads automatically when relevant. The data-validation skill, for example, encodes the rules the agent follows before it draws a conclusion:
# Skill: DMS Data Validation Assessment

## Critical Rules
- Every finding MUST cite actual numbers from the metrics report, never generalize.
- Do NOT fabricate or estimate any metric. If data is missing, say "Data not available."
- Do NOT hardcode thresholds, use relative comparisons (% of total, trend direction).
- Validation metrics come from TWO sources: the DMS table-statistics API AND
  CloudWatch. Cross-reference both.

## Concepts to Evaluate — ValidationState machine
- Validated          = healthy, all rows confirmed matching
- Mismatched records = ACTION REQUIRED, source/target differ, check failure table
- Suspended records  = source churn too high, DMS cannot compare
- No primary key     = CANNOT VALIDATE, table lacks a PK
Flag if Mismatched + Suspended + Error tables exceed 5% of the total.
Every new finding folds back into a runbook or a skill, so the next migration starts from what the last one learned. The ValidationQueryCdcDelaySeconds race condition from scenario 2 becomes a trigger the agent recognizes on sight, rather than something it has to rediscover.
When to use this approach
This pattern fits issue investigation, pre-cutover readiness gates, and post-cutover stabilization reviews, where an operator hands the agent a symptom and wants a grounded root cause from read-only tools. It is not a replacement for continuous monitoring or alarms, and it does not ship logs for long-term retention. Use it alongside your existing CloudWatch alarms and dashboards, not instead of them.
Clean up
To avoid ongoing charges, delete the resources you created. Delete the CloudFormation stack with aws cloudformation delete-stack --stack-name dms-mcp-test-mcp-server. Remove the MCP server from your Agent Space and deregister it. If you provisioned a test migration with the repository scripts, run the included cleanup script.
Conclusion
Migration issues usually stem from operational problems, not data problems, and AWS DMS does not catch them. In this post, you saw how to extend AWS DevOps Agent to investigate them autonomously, using a sample MCP server that exposes read-only, migration-specific tools and runbooks. Across five real investigations, the agent chose the right tools for each question, found the affected tables, named the exact task setting behind a validation race condition, and followed a runbook to a fix. Because the tools are read-only and access is least-privilege IAM, you can give them to an autonomous agent without widening your operational scope.
To get started, deploy the MCP server from the GitHub repository, register it with your Agent Space, and turn on DMS data validation before your next cutover.
About the authors
|
|
Chitresh Saxena Chitresh Saxena is a Senior AI/ML Specialist, specializing in generative AI solutions and dedicated to helping customers successfully adopt AI/ML on AWS. He excels at understanding customer needs and provides technical guidance to build, launch, and scale AI solutions that solve complex business problems. |

|
|
Neel Sendas Neel Sendas is a Principal Technical Account Manager at AWS, leading Cloud Operations for some of AWS’s largest enterprise customers across ML governance, cloud finance, and operational resilience at scale. He is also a core member of AWS’s Machine Learning Technical Field Community, helping shape the roadmap for AWS AI/ML services. |

|
|
Tipu Qureshi Tipu Qureshi is a Senior Principal Technologist in AWS Agentic AI, focusing on operational excellence and incident response automation. He works with AWS customers to design resilient, observable cloud applications and autonomous operational systems. |