AWS for Games Blog
Monitoring server health with Amazon GameLift Servers
Running a successful multiplayer game means constantly balancing performance, scale, and player experience. As your player base grows, new challenges emerge. The causes could be any one of a variety of different problems. Perhaps it’s something in your server code. There could be a memory leak, inefficient logic, or a bug that only surfaces under specific conditions.
Also, it is important to optimize latency using Amazon GameLift Servers by strategically placing capacity across Regions, verifying players connect to servers closest to them. However, even with latency optimizations in place, you might still receive complaints from players about poor performance or degraded gameplay from a subset of players.
We’ve previously covered how to diagnose and address wider network issues, but latency metrics alone won’t tell you the full story. You need deeper visibility into what’s happening on your game servers.
This is where the Amazon GameLift Servers telemetry metrics can help.
Beyond latency: Server-side observability
When using Amazon GameLift Servers with telemetry enabled, your game servers capture a variety of detailed metrics—including resource utilization (such as CPU, memory, and network), game-specific metrics (such as tick rate), and custom metrics you define. These metrics are captured with different dimensions and levels of aggregation, so you can analyze performance at the process, container, host, and fleet-wide level. The metrics flow into your choice of metrics warehouse and can be visualized with your preferred tools and services.
We will demonstrate using Amazon Managed Grafana with pre-built dashboards. The set up is streamlined and can be accomplished in under an hour.
The real power isn’t only in the metrics themselves, it’s in how the dashboards help you quickly identify and diagnose issues.
Troubleshooting game server crashes
Let’s start with a common scenario: Game sessions are crashing. Players are being disconnected mid-match, and you need to figure out why.
If you haven’t already set up monitoring dashboards, follow the Configure Amazon Grafana documentation—it takes a few minutes to provision pre-built dashboards for your fleet. Note that we are following the C++ SDK steps linked from the Implementation documentation, adjust for your chosen implementation option.
Once configured, open Amazon Managed Grafana from the Amazon Web Services (AWS) Management Console (console) and navigate to the EC2 Fleet Overview dashboard. Figure 1 shows a crash event in the Game Server Crashes graph, while the Crashed Game Sessions section shows the details of the specific game session which crashed. Both the instance and the game session which crashed are conveniently linked to allow for deeper investigation.
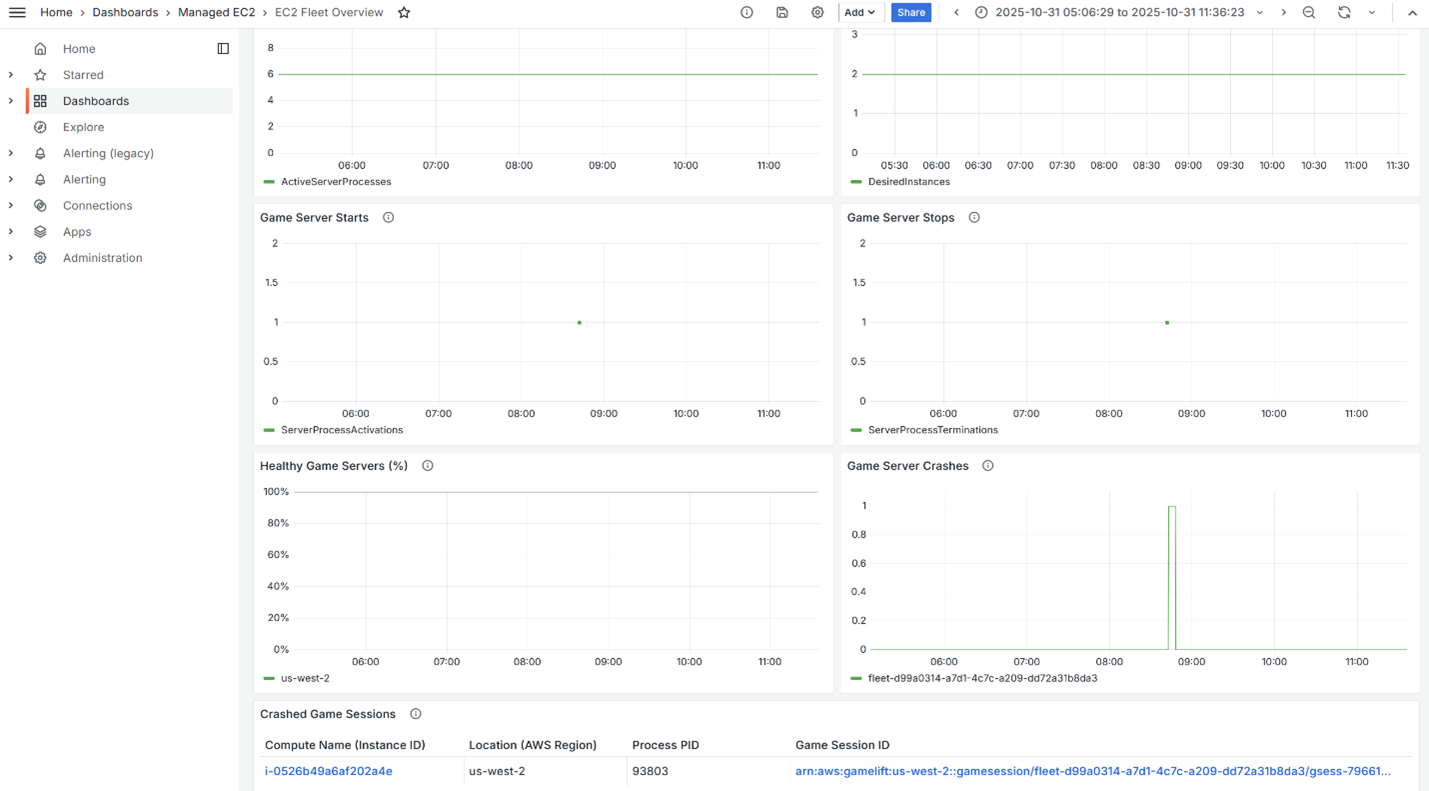
Figure 1: EC2 Fleet Overview dashboard showing a crashed Game Session.
Select the affected instance by clicking on it. The memory graph (Figure 2) illustrates the story: memory usage spiked sharply, then dropped as the process crashed. This is the signature of a memory leak. Looking at the session-level breakdown, you can see that one game session had significantly more memory usage.
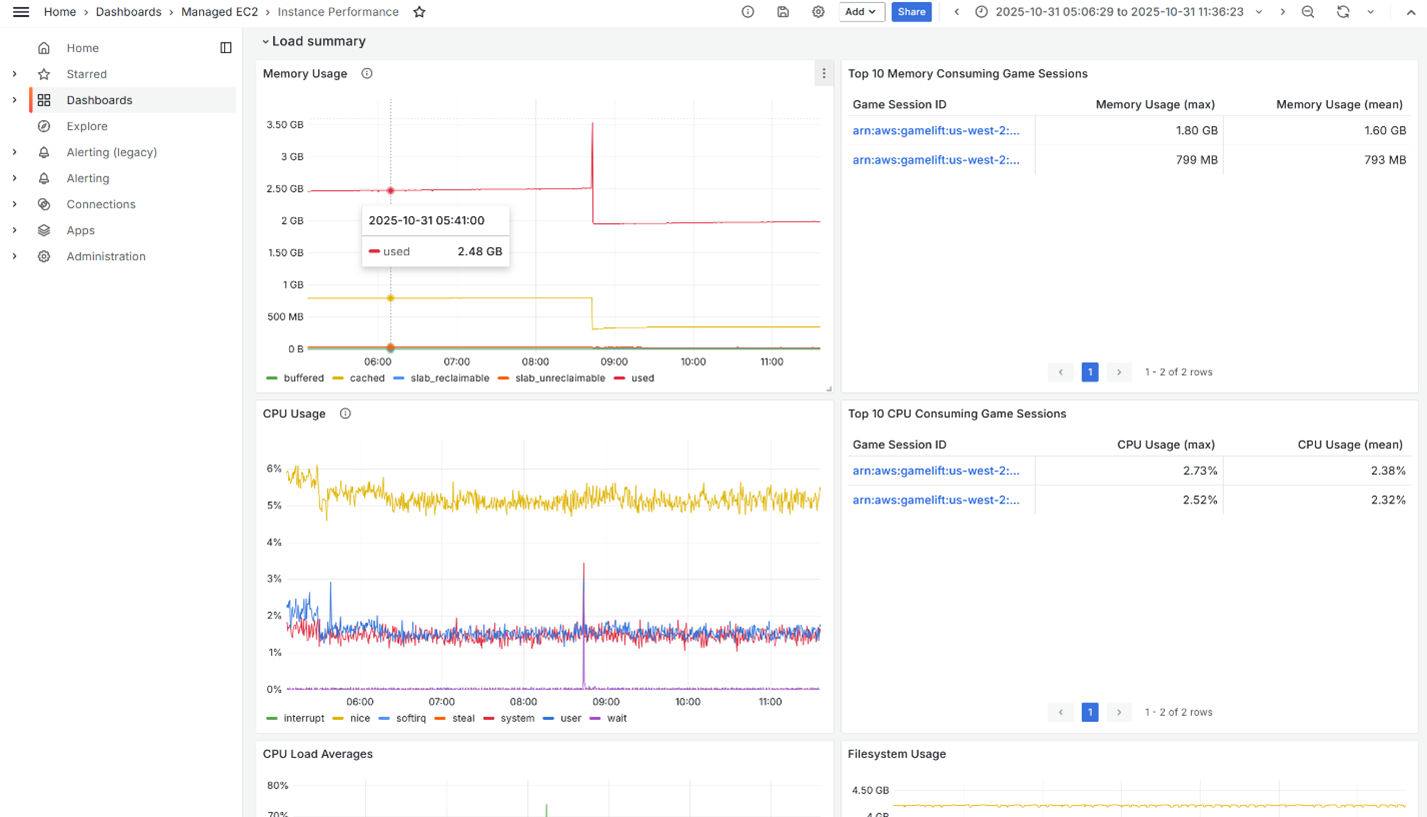
Figure 2: Instance Performance dashboard showing memory leak.
Clicking on the crashed game session brings us to the Server Performance dashboard (Figure 3), which shows the game session’s consumption up to the moment of crashing. The dashboard illustrates that the crashed game session was the one responsible for the memory leak.
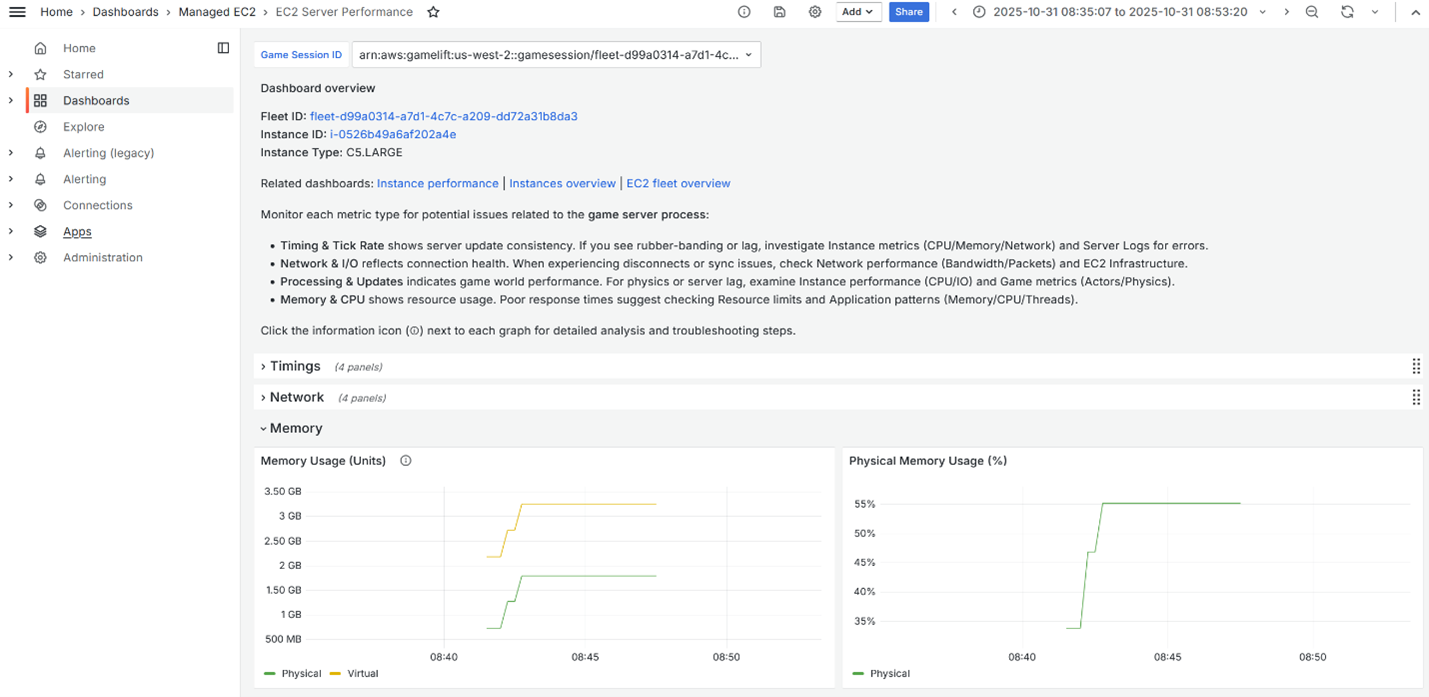
Figure 3: Server Performance dashboard showing memory leak.
Every graph includes helpful tooltips explaining what to look for and how to interpret the data. In this case, the next step is clear: investigate the game session logs of the crashed session to identify what triggered the leak. This can help you determine if it was a specific game mode or could have been from a particular player’s action. The metrics help point you to the right logs to examine.
Troubleshooting high CPU usage
Let’s look at another scenario: Players are reporting stuttering gameplay, but no crashes. The issue might be CPU-related.
Switch to the EC2 Instances Overview dashboard in Amazon Managed Grafana. Figure 4 displays the top 20 EC2 instances by CPU consumption. Most instances hover around 2-3% CPU usage, but a few are showing at 20-30% or higher.
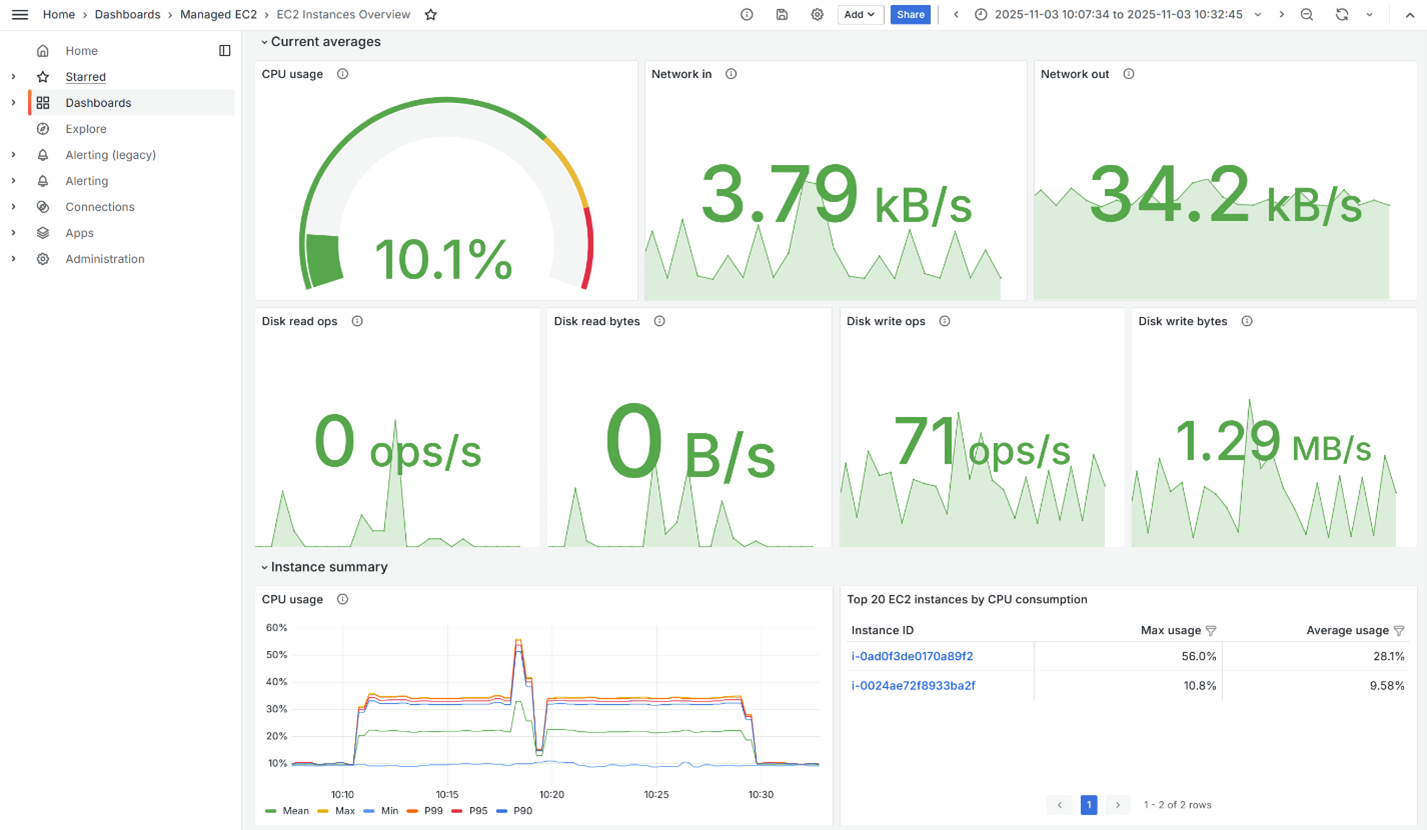
Figure 4: EC2 Instances Overview dashboard.
Select one of the high-CPU instances. The dashboard will break down the CPU usage by game session (Figure 5) and immediately indicates which session is consuming the most resources. You can then consult the game session logs for that specific session, focusing on the period with elevated CPU usage.
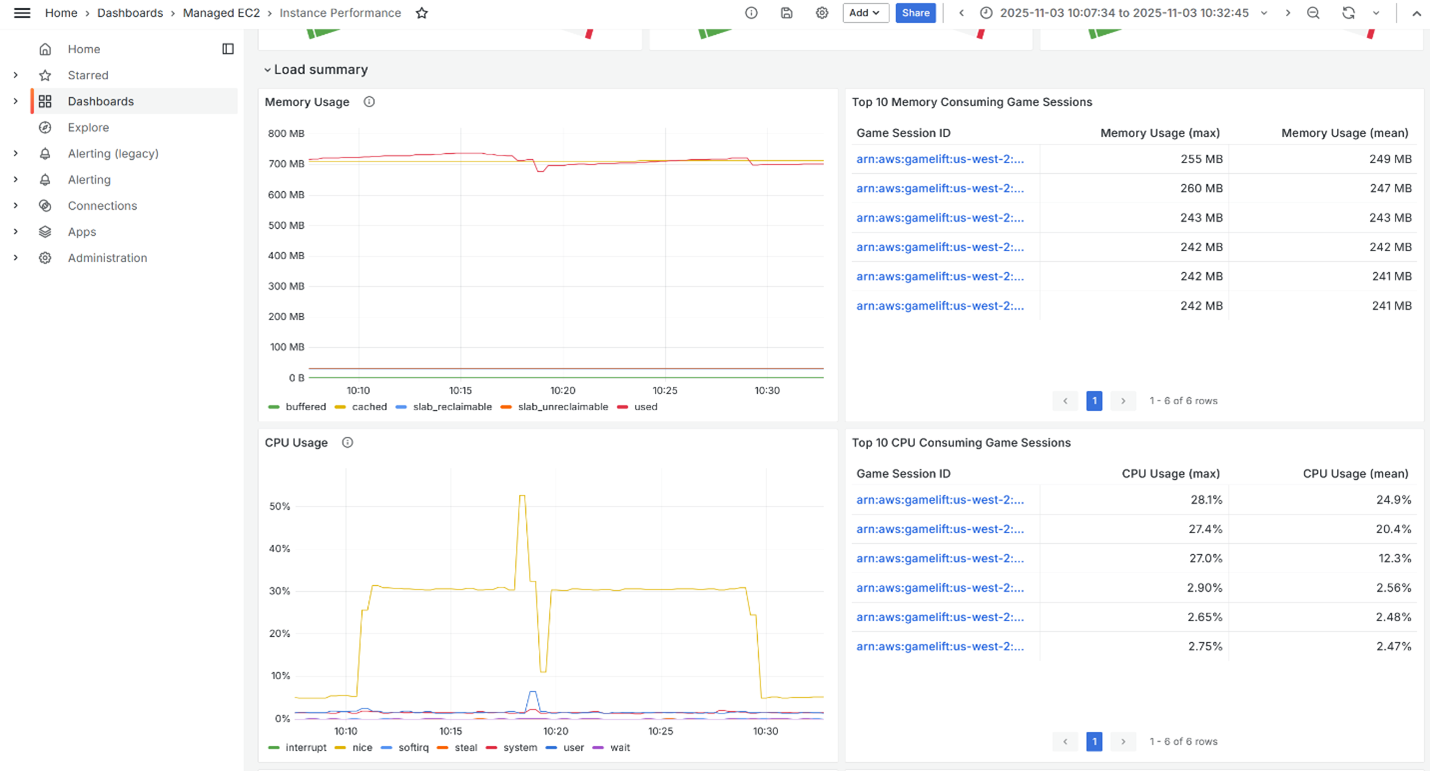
Figure 5: Instance Performance dashboard showing top CPU consuming game sessions.
Perhaps you discover the high CPU correlates with intense combat scenarios, or maybe there’s a pathfinding bug that causes excessive calculations. While the metrics alone don’t tell you exactly what’s wrong, they do tell you exactly where to look.
Container support
If you’re running your Amazon GameLift Servers Fleet with containers instead of EC2 instances, the same troubleshooting approach applies. Figure 6 shows the Container Fleet Overview dashboard, which displays the top tasks by CPU or memory consumption.
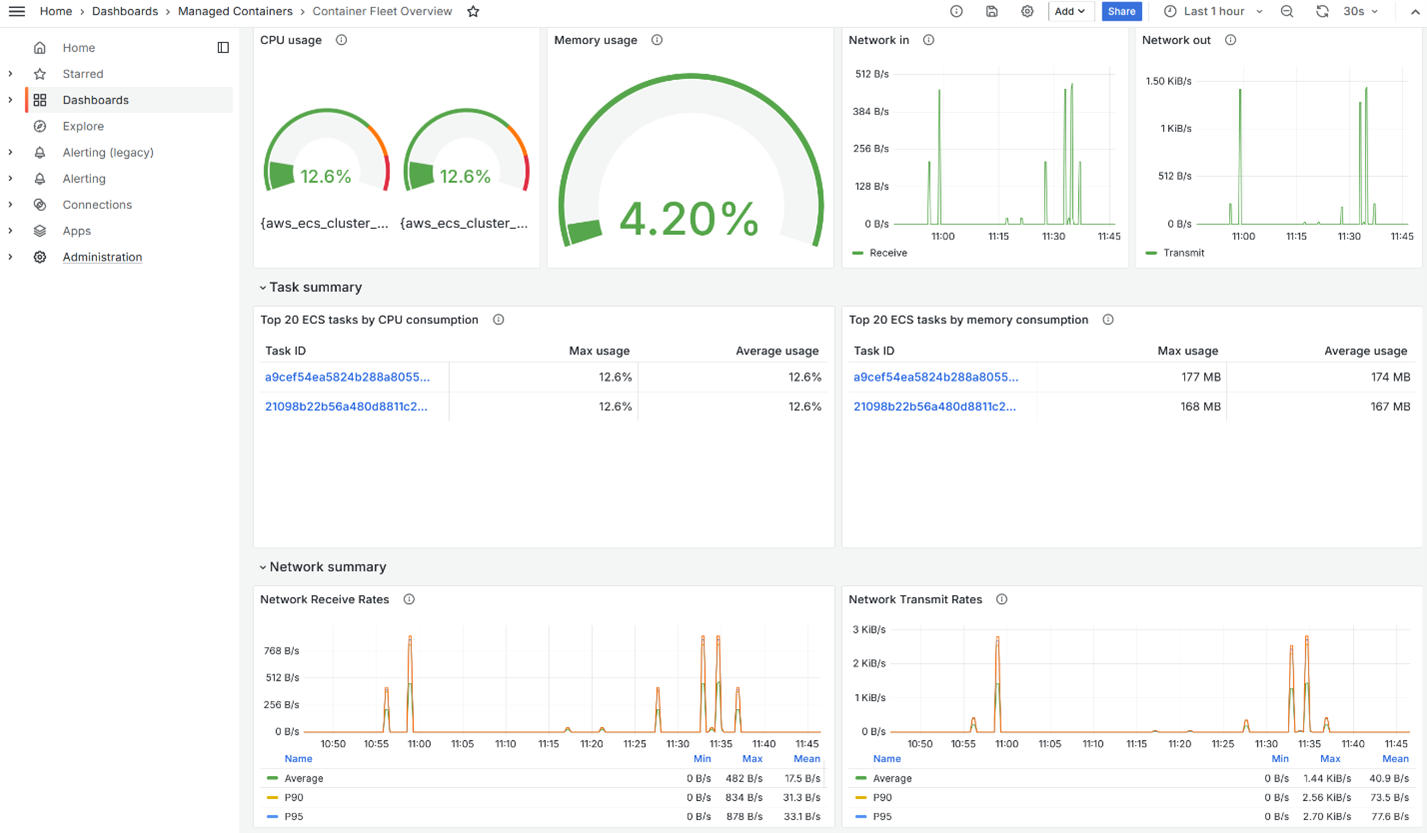
Figure 6: Container Fleet Overview dashboard.
Click on a specific task, and the Container Performance dashboard will break down the metrics by individual containers within that task (Figure 7). You can see if the game server container (Container1 in this case) is consuming resources as expected, or if a sidecar container is causing issues. This granularity helps you isolate problems quickly, whether you’re running on EC2 or containers.
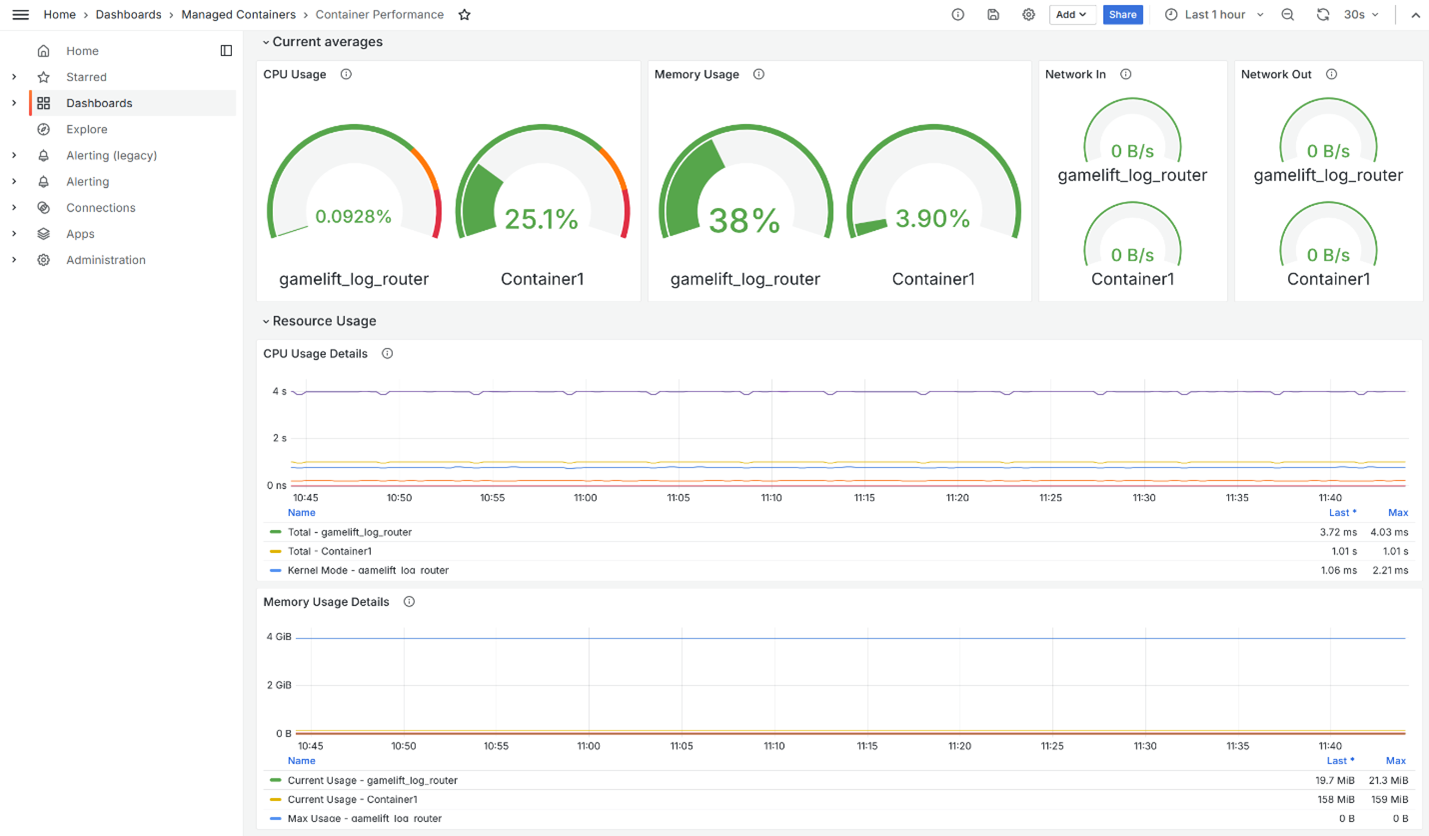
Figure 7: Container Performance dashboard.
Next steps
While the built-in metrics cover hardware performance and generic game metrics (such as tick rate and crashes), you can extend monitoring even further. Game-specific health indicators can be captured using custom metrics as described in the Custom metrics documentation.
Consider tracking metrics such as:
- Combat balance: Average time-to-kill or damage-per-second across weapon types to detect if a recent balance patch made certain weapons overpowered
- Progression blockers: Success rate for critical quests or boss encounters to identify if a bug is preventing players from advancing
- Economy health: Currency inflation rates or item acquisition patterns to spot exploits before they destabilize your in-game economy
- AI pathfinding duration: Time spent calculating NPC movement paths to detect if complex scenarios are causing performance
Once you’ve instrumented custom metrics that make sense for your game, set up alerts in Amazon Managed Grafana for both system and game-specific thresholds. Add alerts for memory usage above 90%, CPU usage sustained above 85%, crashed session increases, or other anomalies in your custom metrics (such as a sudden spike in failed boss attempts). When an alert fires, you can click directly into the relevant dashboard and start investigating—catching regressions before they reach social media.
Conclusion
Optimizing latency can connect players to the right location, but server-side observability confirms they have a smooth experience once they’re in-game. Amazon GameLift Servers telemetry metrics, with pre-built dashboards, provides the visibility needed to quickly diagnose crashes, performance bottlenecks, and resource issues—without drowning in raw metrics.
The next time a player complains about a glitchy experience, you’ll know exactly where to look, and with proactive alerting, you’ll catch the issue before they even notice.
Contact an AWS Representative to know how we can help accelerate your business.