IBM & Red Hat on AWS
Observe AI Agents on Amazon Bedrock AgentCore with IBM Instana
AI agents built with Amazon Bedrock AgentCore (AgentCore) autonomously reason, act, and orchestrate multi-step workflows to solve complex business problems. As organizations deploy these agents in production, comprehensive observability becomes essential for understanding agent behavior, diagnosing issues, and optimizing performance. Customers using IBM Instana Observability (Instana) on Amazon Web Services (AWS), can send AgentCore telemetry to Instana for a unified observability across their AI agent workloads.
IBM Instana Observability, available as Software-as-a-Service (SaaS) through AWS Marketplace, provides real-time observability with generative AI-specific capabilities for agent workflows. Instana natively accepts OpenTelemetry (OTel) signals from AgentCore, enabling you to explore reasoning chains, investigate model interactions, and detect anomalies in agent behavior while correlating observations with AWS service health.
In this post, you will learn how to integrate IBM Instana Observability with Amazon Bedrock AgentCore Runtime. You will configure OTel to export telemetry from a Strands-based agent using Amazon Bedrock models, deploy the containerized agent to AgentCore Runtime, and use Instana’s analytics capabilities to gain visibility into reasoning paths, performance patterns, and agent decision-making.
Solution architecture and integration
AgentCore emits service-generated traces, spans, metrics, and logs that can be forwarded via OpenTelemetry (OTel). Instana natively accepts OTLP signals and provides Generative AI (GenAI) specific observability capabilities, enabling you to correlate agent runs (reasoning steps, tool calls, and downstream service interactions) with the health and performance of your AI Agents on AWS.
Instana accepts OTel data natively, enabling correlation between agent behaviors and AWS infrastructure. By sending telemetry directly from AgentCore to Instana, you can visualize reasoning chains, monitor model latency, and detect anomalies in real time.
Architecture Diagram
AI agents make dynamic decisions, invoke tools based on context, and follow reasoning paths that differ with each interaction. In traditional application monitoring, predefined metrics and known failure models are tracked, but agents require deeper observability capabilities that reveal why decisions were made, how tools were selected, and where reasoning processes diverged from expectations. AgentCore emits traces, spans, metrics, and logs through OpenTelemetry, providing detailed telemetry about agent operations.
By configuring your agent to send this telemetry to Instana, you gain observability into reasoning steps, tool invocations, and memory interactions while correlating these agent behaviors with AWS service health. Instana’s GenAI-specific observability features enable you to detect anomalies in agent behavior, investigate performance variations, and understand decision patterns across agent executions.
The following diagram shows the integration architecture (Figure 1):
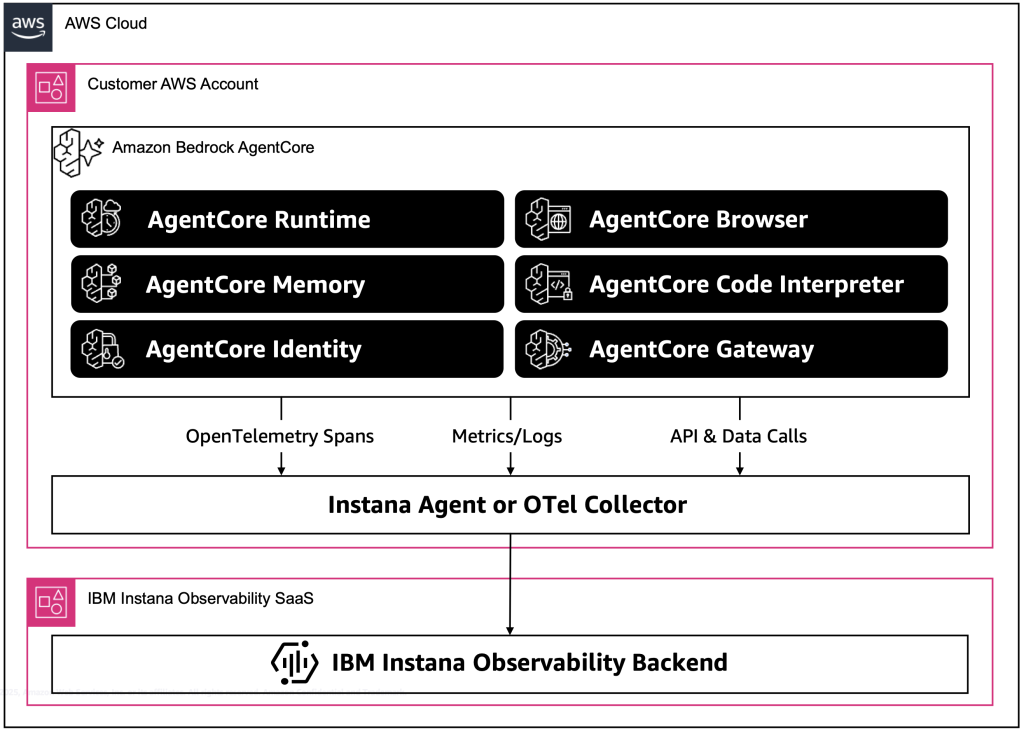
Figure 1. Amazon Bedrock AgentCore telemetry flow through OpenTelemetry to Instana observability backend.
The integration consists of the following components:
- Strands Agents – Implements agent logic using the Strands framework with built-in telemetry support for OTel.
- Amazon Bedrock AgentCore Runtime – Provides a managed, scalable environment for deploying and invoking agents.
- OpenTelemetry Exporter – Sends agent telemetry (spans, metrics, logs) to Instana using OTLP over HTTP.
- Instana OTel Collector – Receives OTLP data and forwards it securely to the Instana backend.
- IBM Instana Observability Backend – Provides GenAI-specific observability capabilities to explore agent reasoning steps, model interactions, and tool calls while correlating with AWS service health.
This architecture helps you gain observability into agent execution from invocation through tool calls and model interactions, providing the transparency needed to investigate issues and optimize agent performance in production environments.
Implementation walkthrough
This section walks you through deploying a Strands agent to Amazon Bedrock AgentCore Runtime with IBM Instana Observability. You will configure your environment, instrument your agent for OTel, deploy it to AgentCore, and validate that telemetry data is flowing into Instana.
The steps follow the same pattern as the reference notebook included in the Amazon Bedrock AgentCore Samples repository, where you can find end-to-end examples, sample Dockerfiles, and deployment scripts. If you are new to AgentCore or want to reproduce this implementation, start from Strands Agent with Instana Observability on Amazon Bedrock AgentCore Runtime sample notebook.
Prerequisites
Before you begin, make sure you have the following:
- An AWS account with credentials configured
- Access to Amazon Bedrock AgentCore in a supported AWS Region
- AWS Identity and Access Management (IAM) permissions for Amazon Bedrock AgentCore Runtime and Amazon Bedrock operations
- Access to Amazon Bedrock models (this post uses nova-lite-v1:0)
- An active subscription to IBM Instana Observability. You can start with an Instana free trial from AWS Marketplace
- An Instana API token, which you can generate after signing in to Instana
- Access to your Instana tenant URL (for example, https://your-instance.instana.io)
- Identify Instana Deployment Region and Instana OTLP Collector endpoint
The following tools installed and configured on your workstation:
- AWS Command Line Interface (AWS CLI) version 2
- Amazon Bedrock AgentCore Starter Toolkit
- Python 3.10 or later and Docker
Cost considerations
Implementing this solution creates resources in your AWS account that incur costs. The primary cost drivers include Amazon Bedrock AgentCore, Amazon Bedrock model invocation charges, Amazon Elastic Container Registry (Amazon ECR) storage for container images, and AWS CodeBuild minutes for container builds. Costs vary based on usage patterns, selected models, and runtime duration.
Retrieve your Instana Deployment Region and OTLP Collector Endpoint
- Sign in to your Instana tenant URL with your credentials to get your Instana deployment region.
- From the Instana user interface, choose More from the navigation menu, and About Instana. This will show the region label for your deployment (for example, blue, red, green, or coral), as seen in the following image (Figure 2):
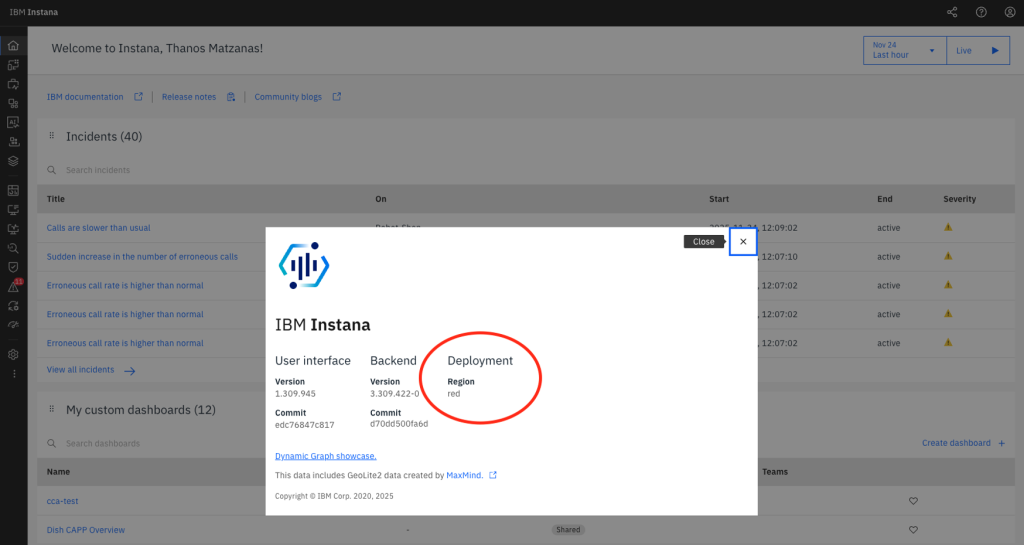
Figure 2. Visualizing your IBM Instana Observability deployment region label.
Store your Credentials and Configurations Values
Using a .env file separates configuration data from your application code, preventing sensitive credentials—such as your Instana API key or OTLP endpoint—from being hardcoded or shared in source control. Your containerized agent will read these credentials at startup to authenticate with Instana and export telemetry data through OTel.
- Create a .env file in your project directory, to store your credentials and configuration values:
%%writefile .env
# Instana OTLP endpoint (e.g., https://otlp-magenta-saas.instana.rocks:4318)
OTEL_EXPORTER_OTLP_ENDPOINT="<REPLACE_WITH_YOUR_INSTANA_ENDPOINT>"
# Note: This example uses StrandsTelemetry() for exporting, which supports only the HTTP OTLP endpoint.
# Make sure to use the HTTP endpoint when working with Strands Telemetry.
# Instana key
INSTANA_KEY="<REPLACE_WITH_YOUR_INSTANA_KEY>"
- Create the requirements.txt file and add the following dependencies:
%%writefile requirements.txt
uv
ddgs
boto3
bedrock-agentcore
bedrock-agentcore-starter-toolkit
dotenv
strands-agents[otel]
strands-agents-tools- Install the required dependencies:
!pip install --force-reinstall -U -r requirements.txt --quietImplement the Strands Agent
The agent implementation includes tracing, and metrics hooks for AgentCore Runtime. Each decision, tool call, and memory operation emits spans and attributes (for example, agent.session_id, tool.name, memory.key). This implementation initializes Strands telemetry to export data to Instana.
- Create a file named strands_nova.py for the Strands agent, with the following code:
%%writefile strands_nova.py
import os
import logging
from bedrock_agentcore.runtime import BedrockAgentCoreApp
from strands import Agent, tool
from strands.models import BedrockModel
from strands.telemetry import StrandsTelemetry
from ddgs import DDGS

logging.basicConfig(level=logging.ERROR, format="[%(levelname)s] %(message)s")
logger = logging.getLogger(__name__)
logger.setLevel(os.getenv("AGENT_RUNTIME_LOG_LEVEL", "INFO").upper())

@tool
def web_search(query: str) -> str:
    """
    Search the web for information using DuckDuckGo.
    Args:
        query: The search query
    Returns:
        A string containing the search results
    """
    try:
        ddgs = DDGS()
        results = ddgs.text(query, max_results=5)

        formatted_results = []
        for i, result in enumerate(results, 1):
            formatted_results.append(
                f"{i}. {result.get('title', 'No title')}\n"
                f"   {result.get('body', 'No summary')}\n"
                f"   Source: {result.get('href', 'No URL')}\n"
            )

        return "\n".join(formatted_results) if formatted_results else "No results found."

    except Exception as e:
        return f"Error searching the web: {str(e)}"

# Function to initialize Bedrock model
def get_bedrock_model():
    region = os.getenv("AWS_DEFAULT_REGION", "us-east-1")
    model_id = os.getenv("BEDROCK_MODEL_ID", "amazon.nova-lite-v1:0")

    bedrock_model = BedrockModel(
        model_id=model_id,
        region_name=region,
        temperature=0.0,
        max_tokens=1024
    )
    return bedrock_model

# Initialize the Bedrock model
bedrock_model = get_bedrock_model()

# Define the agent's system prompt
system_prompt = """You are an experienced travel agent specializing in personalized travel recommendations
with access to real-time web information. Your role is to find dream destinations matching user preferences
using web search for current information. You should provide comprehensive recommendations with current
information, brief descriptions, and practical travel details."""

app = BedrockAgentCoreApp()

def initialize_agent():
    """Initialize the agent with proper telemetry configuration."""

    # Initialize Strands telemetry with 3P configuration
    strands_telemetry = StrandsTelemetry()
    strands_telemetry.setup_otlp_exporter()

    # Create and cache the agent
    agent = Agent(
        model=bedrock_model,
        system_prompt=system_prompt,
        tools=[web_search]
    )

    return agent

@app.entrypoint
def strands_agent_bedrock(payload, context=None):
    """
    Invoke the agent with a payload
    """
    user_input = payload.get("prompt")
    logger.info("[%s] User input: %s", context.session_id, user_input)

    # Initialize agent with proper configuration
    agent = initialize_agent()

    response = agent(user_input)
    return response.message['content'][0]['text']

if __name__ == "__main__":
    app.run()
Configure AgentCore Runtime deployment
In this step, you use the starter toolkit to configure the AgentCore Runtime deployment. The configuration specifies the entrypoint, execution role, requirements file, and Amazon Elastic Container Registry (Amazon ECR) repository settings. When you run the configuration command, a Dockerfile is automatically generated based on your application code.
The Bedrock AgentCore Starter Toolkit enables AgentCore Observability by default. To use Instana for observability, set disable_otel=True.
- Run the following code to configure your agent deployment:
from bedrock_agentcore_starter_toolkit import Runtime
from boto3.session import Session
boto_session = Session()
region = boto_session.region_name

agentcore_runtime = Runtime()
agent_name = "strands_instana_observability"
response = agentcore_runtime.configure(
    entrypoint="strands_nova.py",
    auto_create_execution_role=True,
    auto_create_ecr=True,
    requirements_file="requirements.txt",
    region=region,
    agent_name=agent_name,
    disable_otel=True,
)
response
You will see output like the following example (Figure 3):
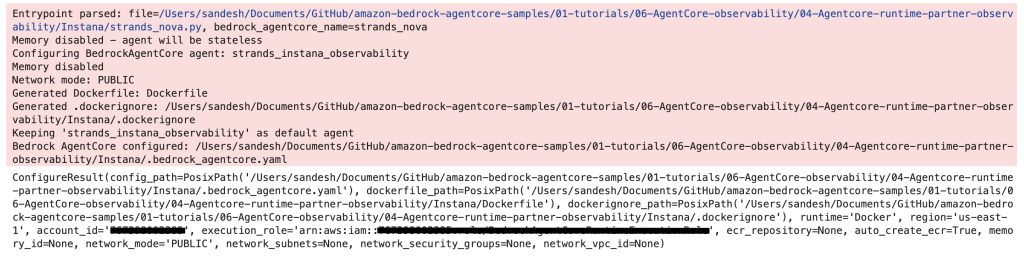
Figure 3. Output of the Amazon Bedrock AgentCore agent configuration.
Deploy to AgentCore Runtime
After the configuration and Dockerfile have been generated, you can launch your agent to AgentCore Runtime. This step builds the container image, creates the necessary AWS resources (including the Amazon ECR repository and IAM execution role if configured in Step 5), deploys your containerized agent to AgentCore Runtime, and loads your environment variables from the .env file. Make sure your .env file is correctly configured as described in step 3.
- Run the following code to launch your agent:
from dotenv import load_dotenv
import os

# Load environment variables from .env file
load_dotenv()

# Fetch configuration
otel_endpoint = os.getenv("OTEL_EXPORTER_OTLP_ENDPOINT")
instana_key = os.getenv("INSTANA_KEY")

# Format Instana header
otel_auth_header = f"x-instana-key={instana_key}"

# Launch the AgentCore runtime
launch_result = agentcore_runtime.launch(
    env_vars={
        "BEDROCK_MODEL_ID": "amazon.nova-lite-v1:0",
        "OTEL_EXPORTER_OTLP_ENDPOINT": otel_endpoint,
        "OTEL_EXPORTER_OTLP_HEADERS": otel_auth_header,
        "OTEL_SERVICE_NAME": "AWS-APP",
        "OTEL_EXPORTER_OTLP_INSECURE": "false",
        "DISABLE_ADOT_OBSERVABILITY": "true",
    }
)

launch_result
You will see output like the following example (Figure 4):
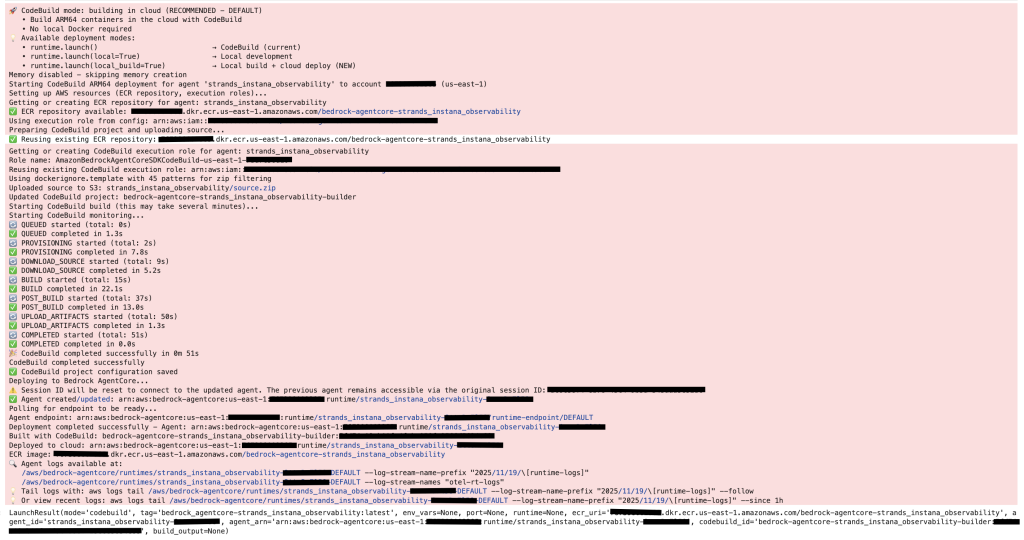
Figure 4. Output of the agent being launched in Amazon Bedrock AgentCore Runtime.
Check deployment status
After the deployment launches, it may take a few minutes for AgentCore Runtime to finish setting up. You can monitor the deployment status in real time.
- Run the following code to continuously check the status of your AgentCore endpoint:
import time
status_response = agentcore_runtime.status()
status = status_response.endpoint['status']
end_status = ['READY', 'CREATE_FAILED', 'DELETE_FAILED', 'UPDATE_FAILED']
start_time = time.time()
poll_interval = 10  # seconds
max_wait = 900      # 15 minutes
attempt = 0

while status not in end_status:
    elapsed = time.time() - start_time
    if elapsed > max_wait:
        raise TimeoutError(
            f"AgentCore deployment timeout after {elapsed:.0f}s. "
            f"Status: {status}. Check Amazon Bedrock AgentCore console for details."
        )
    print(f"[Attempt {attempt + 1}] Status: {status} | Elapsed: {elapsed:.0f}s")
    time.sleep(poll_interval)

    status_response = agentcore_runtime.status()
    status = status_response.endpoint['status']
    attempt += 1

print(f"\n✓ Deployment {status} after {(time.time() - start_time):.0f}s")
The code checks the status every few seconds until it reaches one of the following final states:
- READY – Deployment completed successfully
- CREATE_FAILED, UPDATE_FAILED, or DELETE_FAILED – Deployment encountered an error
Invoke the agent
After your agent is deployed and ready, you can invoke it with a sample prompt to test its response and verify that it is working as expected.
- Run the following code to invoke your agent:
invoke_response = agentcore_runtime.invoke({"prompt": "I'm planning a weekend trip to London. What are the must-visit places and local food I should try?"})You will see output like the following example (Figure 5):

Figure 5. Response showing the agent deployed to Amazon Bedrock AgentCore Runtime responding as expected.
View Traces and Insights in Instana
After your Strands agent is deployed on Amazon Bedrock AgentCore Runtime and telemetry is flowing into Instana, you can analyze every agent interaction in real time, from the Instana dashboard.
- Navigate to your Instana tenant URL and sign in with your credentials. From the left-hand navigation menu, choose Analytics, and then choose Calls.
- This view displays aggregated telemetry across all services and endpoints, showing you how often your agents are invoked, their response latency, and any errors detected. The following screenshot shows the Analytics overview page (Figure 6):
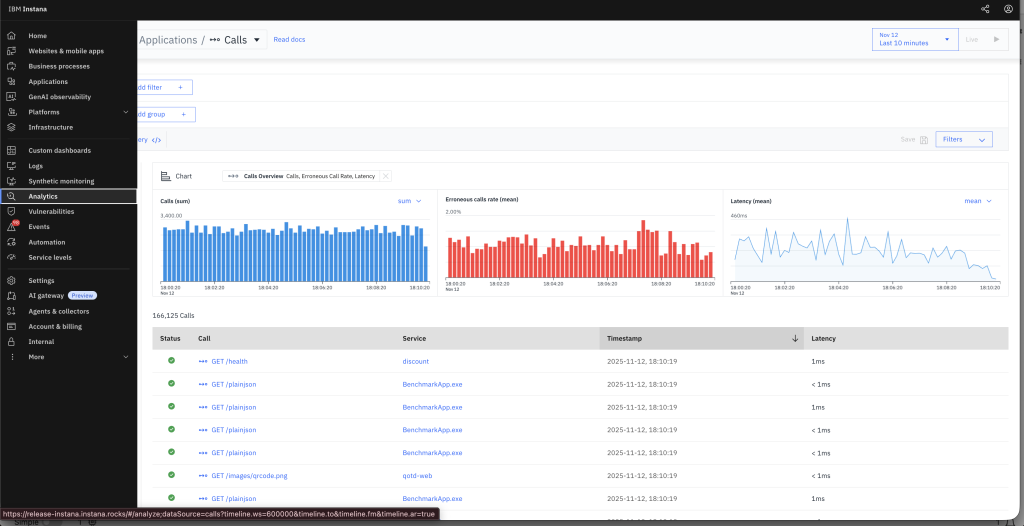
Figure 6. Analytics overview page in Instana showing aggregated telemetry for service invocations, latency, and error rates.
From this view, you can quickly identify whether agent invocations are occurring as expected and confirm that telemetry data from AgentCore is being successfully ingested by Instana.
- Use the Time Range selector in the upper-right corner to choose a time window (for example, the last 30 minutes or 1 hour).
- The charts automatically refresh to display call frequency (blue), errors (red), and latency trends (gray). The following screenshot shows the time range selector (Figure 7):
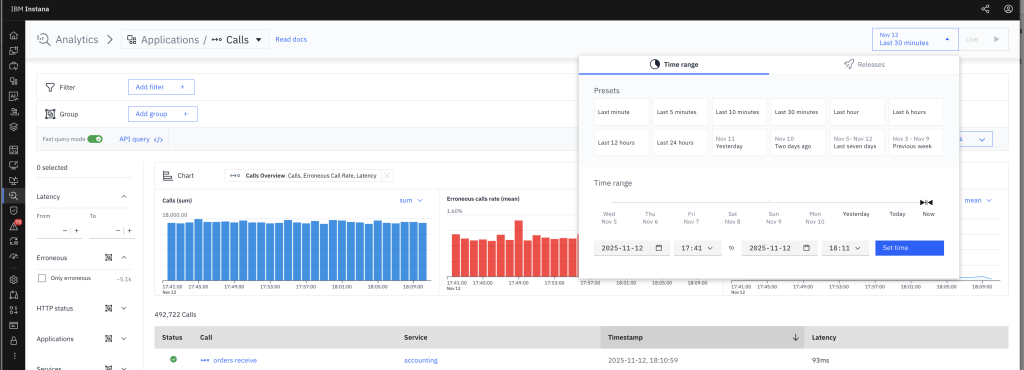
Figure 7. Time range selector in Instana dashboard for filtering telemetry data by time period.
This allows you to focus your analysis on specific testing periods or recent deployments to pinpoint performance regressions or sudden behavior changes.
- At the bottom-left corner, open the Hidden Calls tab and choose Show internal calls.
- This reveals nested function or tool-level operations that are usually hidden from high-level views. An internal call represents work performed within a service. For AgentCore traces, this reveals detailed reasoning steps, tool invocations, and memory retrievals inside your agent—essential for debugging agentic workflows or investigating performance bottlenecks. The following screenshot shows the internal calls view (Figure 8):
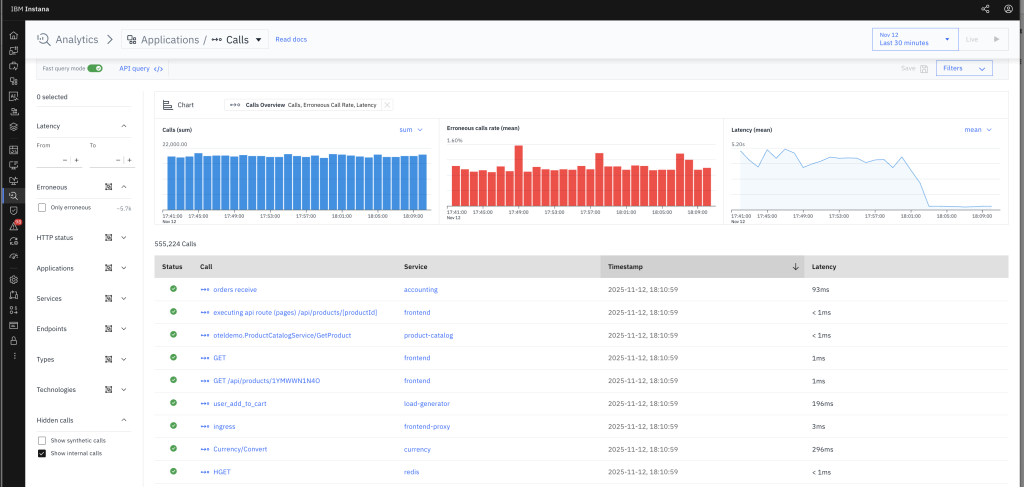
Figure 8. Internal calls view in Instana showing nested agent operations and tool-level executions.
- Choose Add Filter, select Service Name, and enter strands-agents in the search bar. This isolates telemetry associated specifically with your Strands agent on AgentCore, narrowing your view to just the observability data emitted by your deployed agent and reducing noise from other applications or integrations running in the same Instana workspace.
- Review the calls list in the lower section of the dashboard. Each captured call displays columns for Service, Timestamp, and Latency. Choose any entry to open a detailed trace view. The following screenshot shows the filtered calls list (Figure 9):
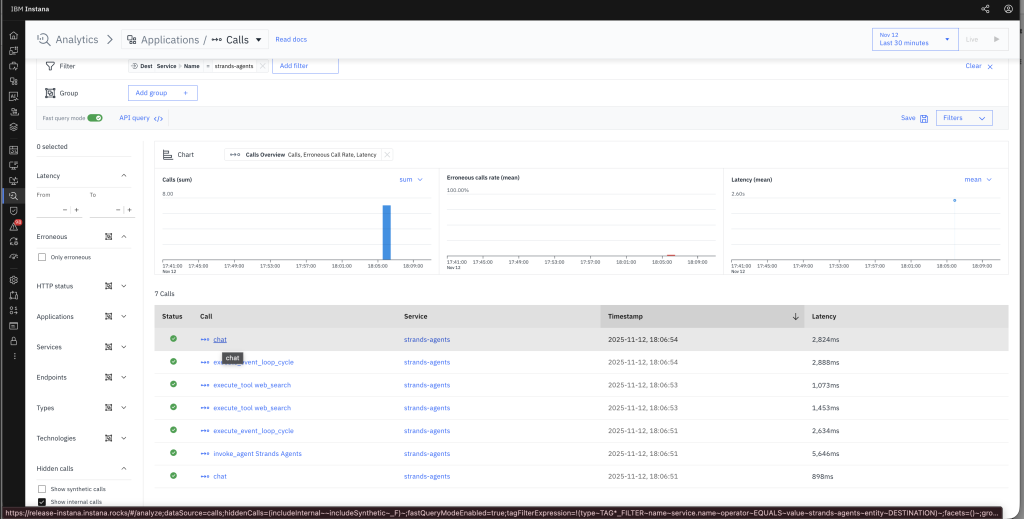
Figure 9. Filtered calls list in Instana showing agent invocations with service, timestamp, and latency information.
This view provides an immediate summary of your agent’s performance patterns, helping you identify outliers, slow responses, or failed tool calls at a glance.
- Choose any call to open the full trace visualization. The trace details include:
- A timeline of reasoning and tool calls within the agent
- Metrics such as latency, duration, and token usage
- Metadata including request payloads, user input, and downstream API interactions
The following screenshot shows the trace detail view (Figure 10):
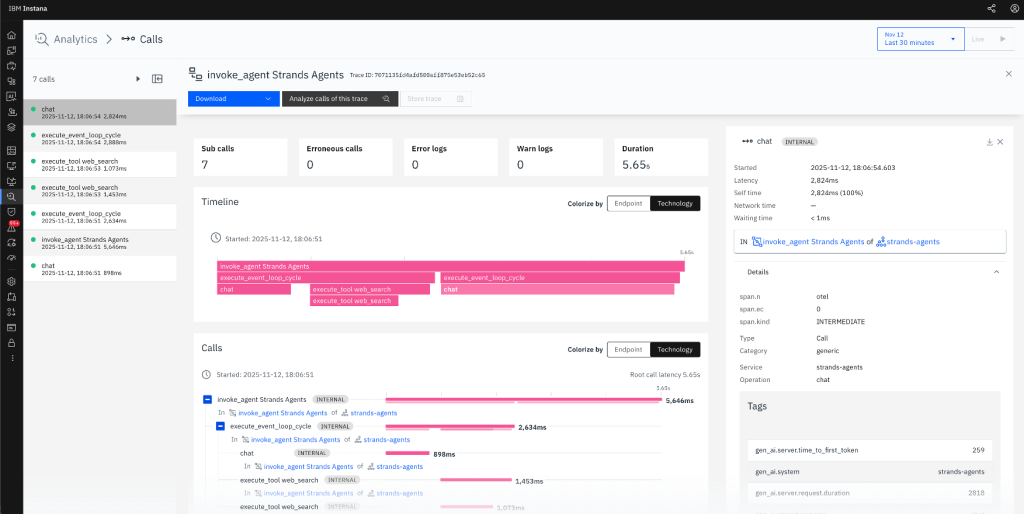
Figure 10. Trace detail view in Instana showing end-to-end agent execution timeline with reasoning steps and tool invocations.
This provides end-to-end visibility into each user request—from model inference to external API calls—helping you optimize the reasoning flow, model performance, and response reliability.
Clean up
After you finish testing, run the following code to delete the AgentCore Runtime and associated Amazon ECR repository to avoid ongoing costs. This action permanently deletes your agent runtime and container images. Make sure you no longer need these resources before proceeding.
import boto3

agentcore_control_client = boto3.client(
    'bedrock-agentcore-control',
    region_name=region
)
ecr_client = boto3.client(
    'ecr',
    region_name=region
)
runtime_delete_response = agentcore_control_client.delete_agent_runtime(
    agentRuntimeId=launch_result.agent_id,
)
response = ecr_client.delete_repository(
    repositoryName=launch_result.ecr_uri.split('/')[1],
    force=True
Summary
In this post, you learned how to integrate IBM Instana Observability with Amazon Bedrock AgentCore Runtime to monitor AI agent behavior. You implemented a Strands-based agent using Amazon Bedrock models, configured OpenTelemetry to export telemetry data to Instana, and deployed the containerized agent using the AgentCore starter toolkit. After deployment, you explored the Instana Analytics dashboard to visualize reasoning paths, tool executions, latency metrics, and model performance across agent invocations.
This integration demonstrates how organizations using IBM Instana on AWS can extend their existing observability capabilities to AI agent workloads. By sending AgentCore telemetry to Instana through OpenTelemetry, you gain unified visibility across agent operations and AWS services in a single observability platform. This consolidated view helps you investigate issues, analyze performance patterns, and maintain reliable agent deployments.
To start using IBM Instana Observability on AWS, visit the Instana Observability listings on AWS Marketplace. You can begin with a 14-day free trial.
To learn more about Amazon Bedrock AgentCore and observability capabilities, see the following resources:
- Get started with Amazon Bedrock AgentCore
- Observe your agent applications on Amazon Bedrock AgentCore Observability
- Amazon Bedrock AgentCore Samples repository
Additional Content:
- Stream Amazon CloudWatch metrics to IBM Instana with Amazon Data Firehose
- Reducing Network Costs and Enhancing Observability Security with IBM Instana and AWS PrivateLink
- Implement observability for Amazon EKS workloads using the Instana Amazon EKS Add-on
- Monitor and Optimize Amazon EKS Costs with Instana and Kubecost
- Monitoring Amazon Bedrock Large Language Models with Instana
- Automate Observability for AWS with Instana self-hosted
- Realtime monitoring of microservices and cloud-native applications with Instana SaaS on AWS