AWS Architecture Blog
Realtime monitoring of microservices and cloud-native applications with IBM Instana SaaS on AWS
Customers are adopting microservices architecture to build innovative and scalable applications on Amazon Web Services (AWS). These microservices applications are deployed across multiple AWS services, and customers are looking for comprehensive observability solutions that can help them effectively monitor and manage the performance of their applications in real-time.
IBM Instana is a fully automated application performance management (APM) solution, available to customers as a fully managed software as a service (SaaS) solution on AWS. It is specifically designed to help customers address the challenges of monitoring microservices and cloud-native applications in real-time. It uses artificial intelligence and machine learning to provide detailed insights into the health and behavior of applications, allowing developers and IT teams to gain real-time insights into their microservices applications, optimize performance, and quickly identify and troubleshoot issues.
This post explains the capabilities of IBM Instana to automatically collect observability metrics, traces, and events from microservices deployed on AWS cloud, as well as on-premises, to provide full visibility into the performance of individual components and applications as a whole.
IBM Instana solution overview
IBM Instana is designed to be highly scalable and adaptable to changing microservices applications environments. Its architecture (Figure 1) consists of several components that work together to provide comprehensive monitoring for microservices and cloud-native applications.
Instana’s main building blocks are host agents and agent sensors that are deployed in a customer’s AWS account and responsible for collecting, aggregating, and sending detailed monitoring information of applications and AWS services to the Instana SaaS backend.
The Instana SaaS backend services provide several key components, including data collectors, storage services, analytics engines, and user interfaces. It allows customers to process and analyze data in real-time, generate actionable insights, have a comprehensive view of their applications and infrastructure performance, enabling them to quickly identify and resolve issues and improve their overall operations.

Figure 1. IBM Instana architecture on AWS
Monitoring data
Instana monitors and observes microservices and cloud-native applications by collecting beacons, traces, and one-second metrics:
- Beacons are small monitoring payloads that are transmitted by a JavaScript agent to the Instana servers, modeling specific events occurring within the lifecycle of a page view of a website; for example, page loading, resource retrieval, and HTTP requests.
- Traces are detailed records of the requests and transactions that flow through a microservice architecture. They record the sequence of events that occur when a request is processed, including the services that are involved, the duration of each service, and any errors or exceptions that occur. Instana automatically correlates traces across services to provide a complete view of an entire transaction. This allows for easy identification and diagnosis of performance issues.
- Metrics are numerical values that represent the performance and resource utilization of a microservice or infrastructure component. Metrics are collected by Instana Agents and sent to the Instana backend at regular intervals. Instana Agents collect hundreds of different metrics, including (but not limited to) CPU usage, memory usage, network traffic, and disk I/O.
This information is captured by Instana agents and sensors, which also collect application configurations and events, plus discover application building blocks, including clusters, containers, and services.
IBM Instana agents and sensors
The Instana host agent is a lightweight software component that collects and aggregates data from various sensors before sending the data to the Instana backend. It can be deployed to AWS services, including Amazon Elastic Compute Cloud (Amazon EC2), Amazon Elastic Kubernetes Service (Amazon EKS), AWS Fargate, AWS Lambda, or Red Hat OpenShift Service on AWS (ROSA). A single host agent, one per host, is used to collect data from monitored systems.
Once Instana agents are running, they automatically detect applications and services, such as containers running on Amazon EKS, and processes like Nginx, NodeJS, Spring Boot, Postgres, Elasticsearch, or Cassandra. For each component detected, different Instana sensors are automatically downloaded, installed, and configured to monitor the environment.
Instana sensors are small programs that are designed to attach and monitor one specific technology and pass their data to the agent. They are automatically managed, updated, loaded, and unloaded by the host agent.
These sensors can monitor several different AWS services like Lambda, Amazon DynamoDB, Amazon Simple Storage Service (Amazon S3), Amazon Aurora, Amazon Simple Queue Service, and Amazon Managed Streaming for Apache Kafka. They collect data—like request and error rates, latency, CPU utilization—via AWS APIs and Amazon CloudWatch.
Instana also provides sensors to collect data from applications running on AWS, like IBM MQ, IBM Db2, or Red Hat OpenShift Container Platform. Review IBM’s full list of supported technologies and AWS services.
Instana also provides tracers, which are used with runtimes like Java, .NET, NodeJS, plus others. They modify code execution to capture logs, traces at request level, and send those back to the Instana agent.
With the use of sensors, the host agent collects configuration data and monitors the applications it has detected. The host agent also handles communications with the Instana SaaS backend services. It collects, aggregates and sends logs, traces and records metrics (such as response times, error rates, and resource utilization) every second to the Instana SaaS backend in real-time, using secure and efficient communication protocols.
IBM Instana SaaS
The Instana SaaS backend is the heart of the Instana APM solution and responsible for processing, storing, and analyzing the monitoring data collected from the Instana agents and sensors installed in the customer’s infrastructure.
It consists of several components and services that work together to provide real-time monitoring and analysis of microservices applications, including:
- Data collectors: Receive and process data from the Instana agents and sensors, and store it in the Instana backend for further analysis.
- Analytics engine: Analyzes the data collected by the agents and sensors to provide insights into the performance and health of the microservices applications.
- User interface: Web-based interface that customers use to view and analyze their monitoring data.
- Alerting engine: Generates alerts when thresholds or anomalies are detected in the monitoring data.
- Data storage: Time-series database that stores the monitoring data collected by the agents and sensors. Allows customers to query and analyze the data in real-time.
- Integrations: Integrates with various third-party tools, such as Slack, PagerDuty, and ServiceNow, providing seamless alerting and incident management.
IBM Instana backend: making sense of the situation in real time
The Instana SaaS platform automatically ingests data from agents and continuously updates a dependency map (Figure 2). This map presents every dependency in context, giving users an easy way to understand the interrelationships between application components and services.
This understanding enables users to identify the upstream and downstream impacts of any issue, ensuring that they stay informed about any potential impacts.

Figure 2. An example of an IBM Instana dependency map
Instana traces every request end-to-end without sampling. The traces are analyzed in real-time, providing metrics that make any performance problems immediately visible. In the event of an incident, Instana can illustrate how a single issue can generate a ripple effect and impact a number of directly and indirectly connected services. Using the relationship information from the Dynamic Graph, Instana’s automatic root-cause analysis can precisely aggregate the individual issues into a single incident.

Figure 3. Applications monitoring with IBM Instana
Developers, IT operations, or site reliability engineers (SREs) can access the Instana backend end-user monitoring interface (Figure 3) or end-user monitoring (EUM) interface (Figure 4) to view monitoring data of their workloads. These can be websites, mobile applications, AWS services, and infrastructure levels. From this UI, these personas can access service dashboards that show key performance indicators (KPIs), like response time and error rate.

Figure 4. End-user monitoring with IBM Instana
The following actions demonstrate how an EUM for a JavaScript application, deployed to Amazon S3 can be completed:
- Developers inject Instana JavaScript code (Figure 5) into the static website (HTML).
- When a user visits the website, the JavaScript agent sends beacons to the Instana backend.
- Dashboards show specific events of the website lifecycle, including page loading, JS errors, and HTTP requests.
- Teams access Instana UI to check performance matrices. They can configure Smart Alerts with custom alerting policies based on specific metrics and KPIs.
- Smart Alerts can send alerts via various channels, such as email, Slack, or IBM Watson AIOps Webhook.
- In case of an incident, teams can use Instana to retrieve various performance metrics for root-cause analysis.
- Developers can resolve the issues and apply the patch.
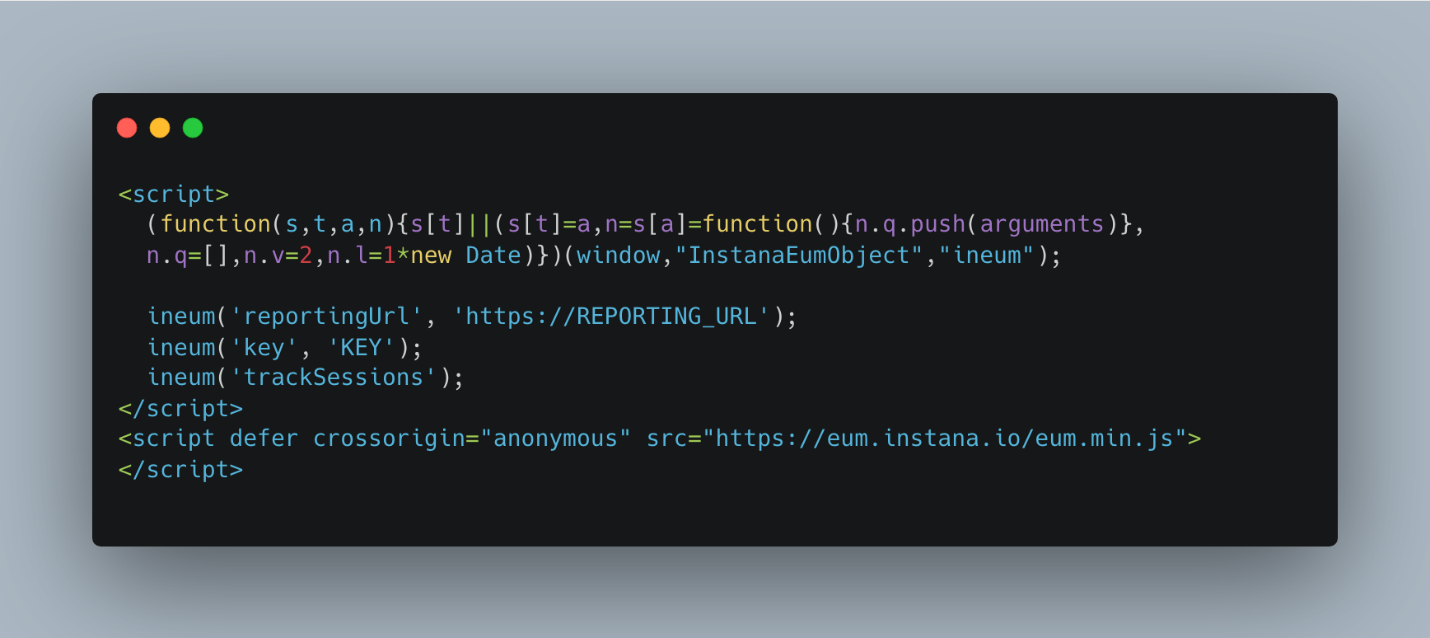
Figure 5. IBM Instana EUM JavaScript agent
Instana also offers Smart Alerts (Figure 6) to provide a more intuitive process of managing alerts. With Smart Alerts, customers can automatically generate alerting configurations using relevant KPIs and automatic threshold detection for use cases like website slowness or website errors.

Figure 6. IBM Instana Smart Alerts
Conclusion
In this post, we discussed how IBM Instana provides a comprehensive monitoring solution with the right tools to help you implement a real-time observability and monitoring solution. It allows you to gain insight into your microservices and cloud-native applications, including visibility into AWS services, containers, on-premises infrastructure, and other technologies. Instana can quickly identify and resolve issues before they impact end-users, ensuring that your applications are performing optimally.
As an IT administrator, developer, or business owner, IBM Instana on AWS give a deeper understanding of your applications and help you make data-driven decisions to improve overall performance.