AWS Cloud Operations Blog

Author: Imaya Kumar Jagannathan
Imaya Kumar Jagannathan is a Principal Solution Architect focused on AWS Observability services including Amazon CloudWatch, AWS X-Ray, Amazon Managed Service for Prometheus, Amazon Managed Grafana and AWS Distro for Open Telemetry. He is passionate about monitoring and observability and has a strong application development and architecture background. He likes working on distributed systems and is excited to talk about microservice architecture design. He loves programming in C#, working with containers and serverless technologies. LinkedIn: /imaya.

Adding metrics and traces to your application on Amazon EKS with AWS Distro for OpenTelemetry, AWS X-Ray and Amazon CloudWatch
In order to make a system observable, it must be instrumented. This means that code to emit traces, metrics and logs must be added to the application either manually, with libraries, or with automatic instrumentation agents. Once deployed, the instrumented data from the application will be sent to the respective backend. There are a number […]

Announcing Prometheus Alertmanager rules in Amazon Managed Grafana
Today, we are announcing Amazon Managed Grafana’s new alerting feature that allows customers to gain visibility into their Prometheus Alertmanager alerts from their Grafana workspace. Customers can continue to use classic Grafana Alerting in their Amazon Managed Grafana workspaces if that experience better fits their needs. Customers using the Amazon Managed Service for Prometheus workspaces to […]

Announcing Private VPC data source support for Amazon Managed Grafana
Today, we are announcing Amazon Managed Grafana support for connecting to data sources inside an Amazon Virtual Private Cloud (Amazon VPC). Customers using Amazon Managed Grafana have been asking for support to connect to data sources that reside in an Amazon VPC and are not publicly accessible. Data in Amazon OpenSearch Service clusters, Amazon RDS instances, self-hosted […]

Amazon Athena, Amazon Redshift Plugins and New Features in Amazon Managed Grafana
During late August 2021, we made Amazon Managed Grafana generally available, and around re:Invent we launched some new features, specifically for new plugins. This post provides you with the high-level overview and shows you some of them in action. Amazon Managed Grafana is a fully managed service that handles the provisioning, setup, scaling, and maintenance […]

Amazon Managed Service for Prometheus is now Generally Available
At re:Invent 2020, we launched Amazon Managed Service for Prometheus, a fully managed Prometheus-compatible service in Preview on AWS. It is a secure and scalable service customers can utilize to collect infrastructure and application metrics from workloads hosted on various environments, such as Amazon Elastic Kubernetes Service (Amazon EKS), Amazon Elastic Container Service (Amazon ECS), […]

Amazon Managed Grafana is now Generally Available
At re:Invent 2020, we introduced Amazon Managed Grafana and made it available in preview. Since then, we’ve been working on numerous enhancements that were made available during preview. Now we’re excited to launch Amazon Managed Grafana in General Availability (GA), and with this post we’ll lay out exactly what this means. Figure 1: List of […]

Monitoring hybrid environments using Amazon Managed Grafana
Setting up observability for workloads is critical to tracking application performance, reliability, and health. It’s even more important when you’re dealing with workloads that are deployed in hybrid environments. A proliferation of monitoring tools can result in data silos or multiple single panes of glass. When an organization loses its consolidated view, whether it be across […]

How Wealthfront utilizes AWS X-Ray to analyze and debug distributed applications
This blog post was written by Harichandan Pulagam, a Data Engineer at Wealthfront In this blog post, we describe how Wealthfront used AWS X-Ray to streamline the development and operations of a distributed application. About Wealthfront Wealthfront’s mission is to build a financial system that favors people, not institutions. They strive to provide better experiences […]
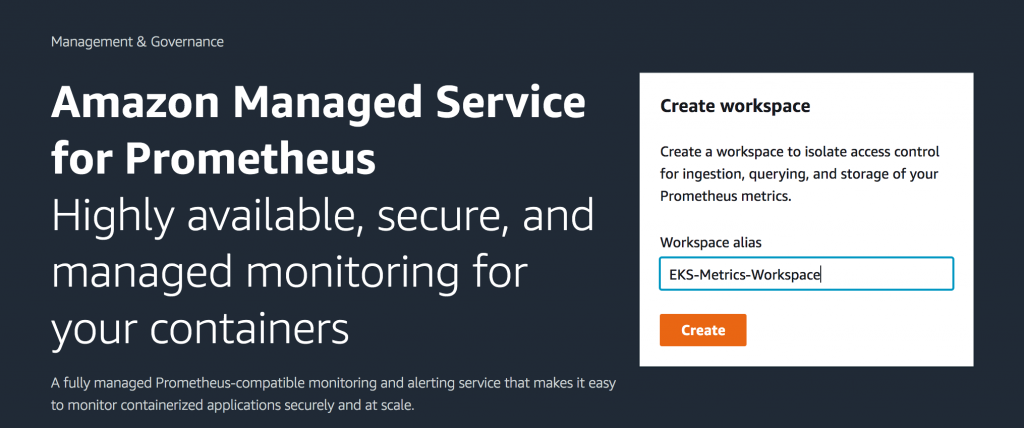
Getting Started with Amazon Managed Service for Prometheus
4/9/2021 – Updated the Prometheus server deployment setup part by removing the AWS SigV4 side-car proxy container. This is no longer needed as the Prometheus server now directly signs requests made to the AMP remote write API. Amazon Managed Service for Prometheus (AMP) is a Prometheus-compatible monitoring service for container infrastructure and application metrics for […]

Amazon Managed Grafana – Getting Started
September 8, 2021: Amazon Elasticsearch Service has been renamed to Amazon OpenSearch Service. See details. Amazon Managed Grafana is a fully managed and secure data visualization service that enables customers to instantly query, correlate, and visualize operational metrics, logs, and traces for their applications from multiple data sources. Amazon Managed Grafana is based on the […]