AWS Cloud Operations Blog
Amazon Athena, Amazon Redshift Plugins and New Features in Amazon Managed Grafana
During late August 2021, we made Amazon Managed Grafana generally available, and around re:Invent we launched some new features, specifically for new plugins. This post provides you with the high-level overview and shows you some of them in action.
Amazon Managed Grafana is a fully managed service that handles the provisioning, setup, scaling, and maintenance of Grafana servers. It is generally available in US East (N. Virginia), US East (Ohio), US West (Oregon), Europe (Ireland), Europe (Frankfurt), Europe (London), Asia Pacific (Singapore), Asia Pacific (Tokyo), Asia Pacific (Sydney), and Asia Pacific (Seoul). At re:Invent 2021, we upgraded the Amazon Managed Grafana data plane to use Grafana 8.2 (from 8.0), and now it also supports CloudFlare, Zabbix, and Splunk Infrastructure Monitoring data sources. We worked with Grafana Labs to make a series of plugins available as open source (more later on in this post) for self-managed Grafana. Moreover, we’re offering them for you to use in Amazon Managed Grafana. Let’s look closer at the new data sources and visualization.
Geomap visualization
You can now use the Geomap panel visualization to visualize geospatial data in a map view. You can configure multiple overlay styles to visually represent important location-based characteristics of your data, such as the heatmap overlay to cluster data points for visualizing hotspot locations with high data densities.
The following example shows the OpenStreetMap on AWS open data set (OSM) in action, using the Geomap panel that’s readily available on the left-hand side drop down within the Amazon Managed Grafana workspace. To re-create this, upload the OSM data into an S3 bucket, configure Athena as a data source, and then visualize the query results of available restaurants in Las Vegas by using the Geomap visualization.
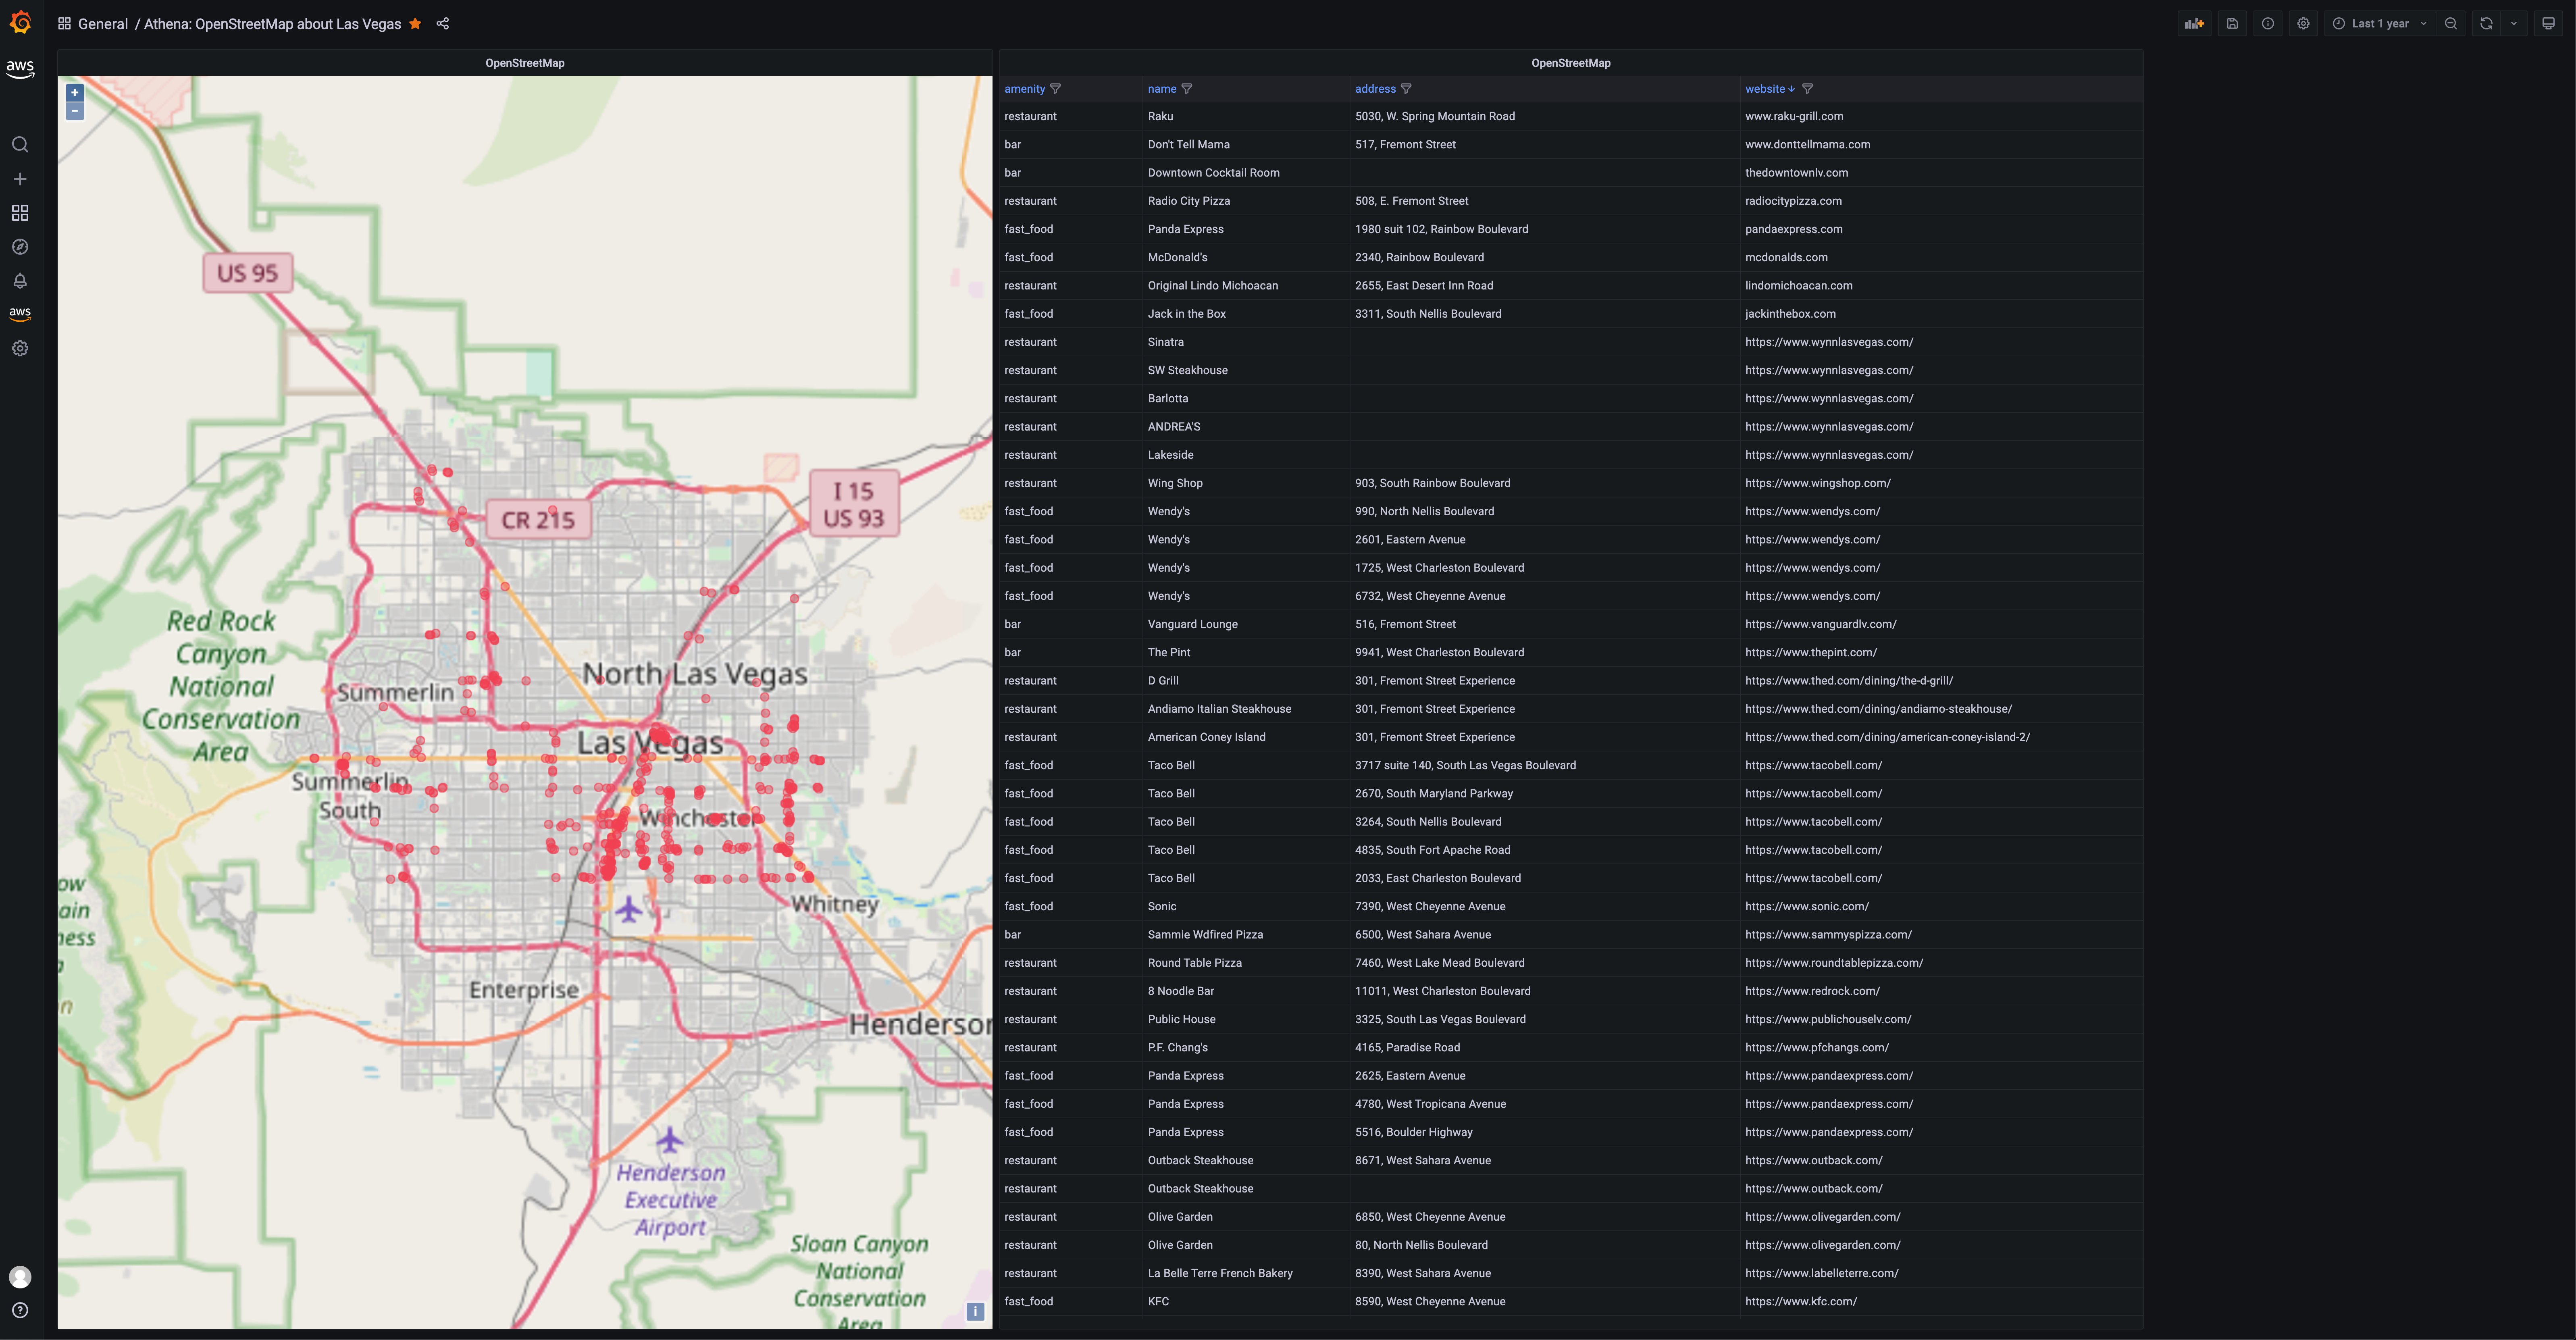
Figure 1: Grafana Geomap visualization showing a map of Las Vegas with restaurant locations plotted
See also:
Amazon Athena/S3 data source
Amazon Athena is a distributed query engine (think: PrestoDB as a service) that lets you query a range of structured data formats (including JSON, CSV, ORC, and Parquet) using SQL, with the data stored in Amazon Simple Storage Service (S3) buckets. This means that for a number of non-relational datasets, from security (VPC flow logs) to budgeting (Cost and Usage Report (CUR)) to the previously mentioned OpenStreetMap geo data, you can now use Grafana to query and visualize your data.
The default dashboard that we bundled with the Athena data source is for the CUR data, and it looks like this:
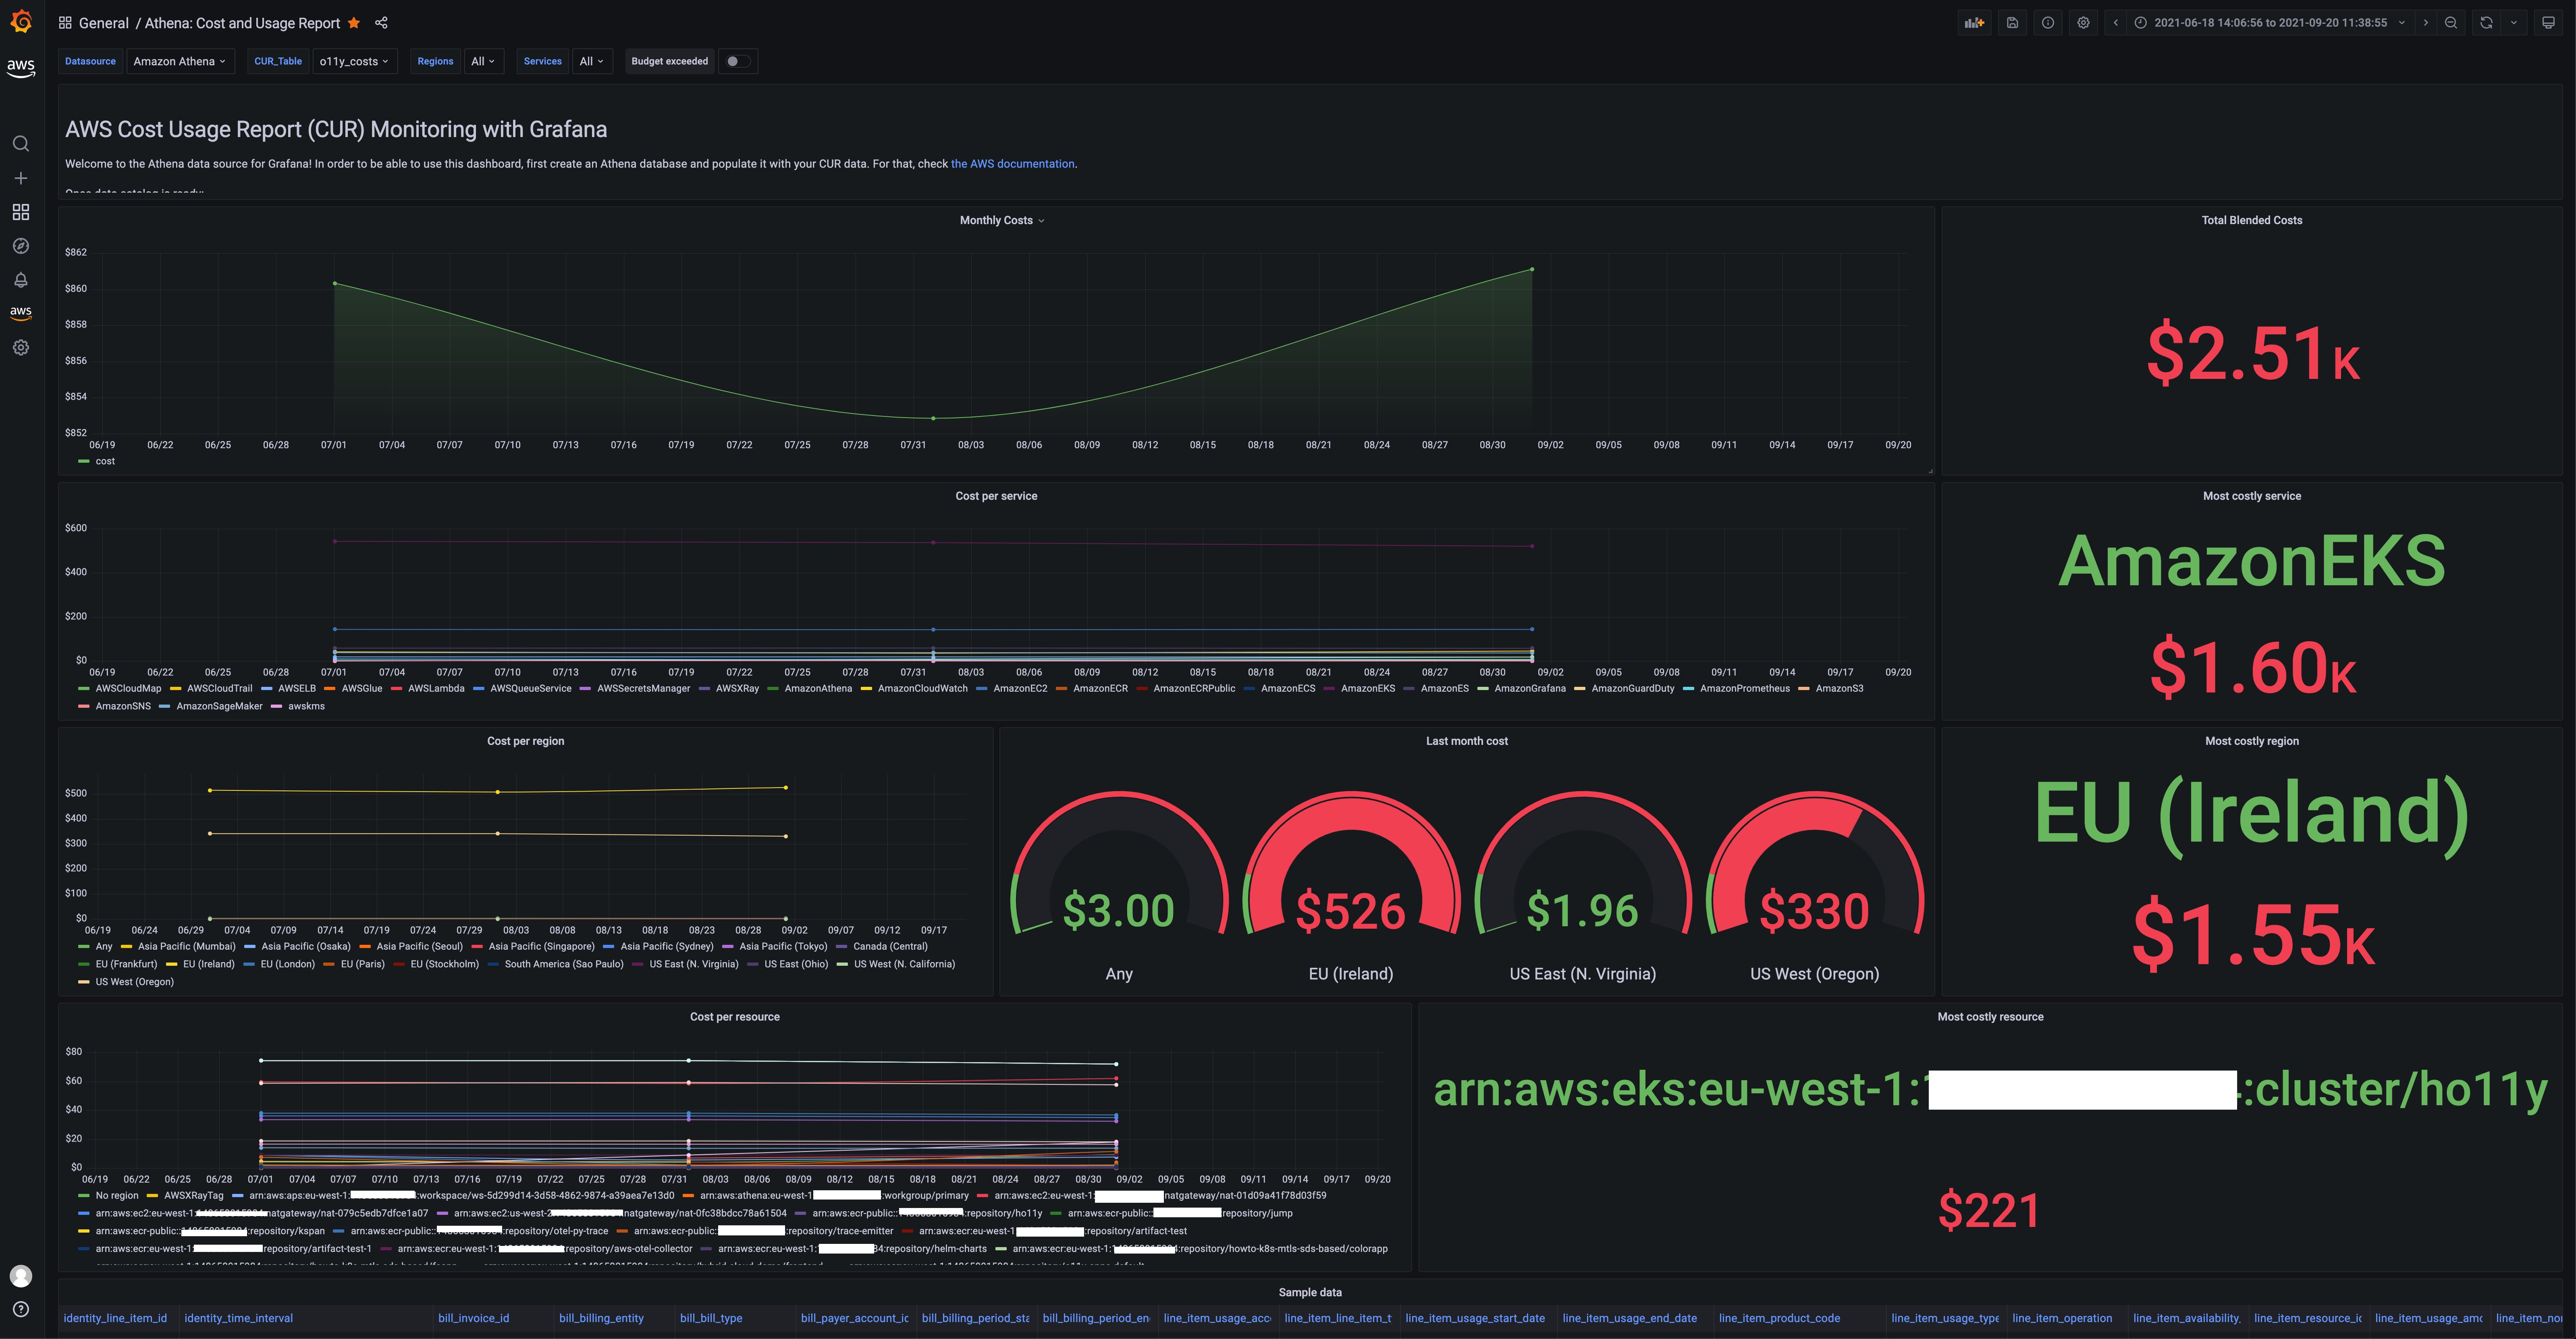
Figure 2: AWS Cost and Usage Report dashboard in Grafana
Another use case for the Athena data source is querying VPC flow logs, as is shown in the following:
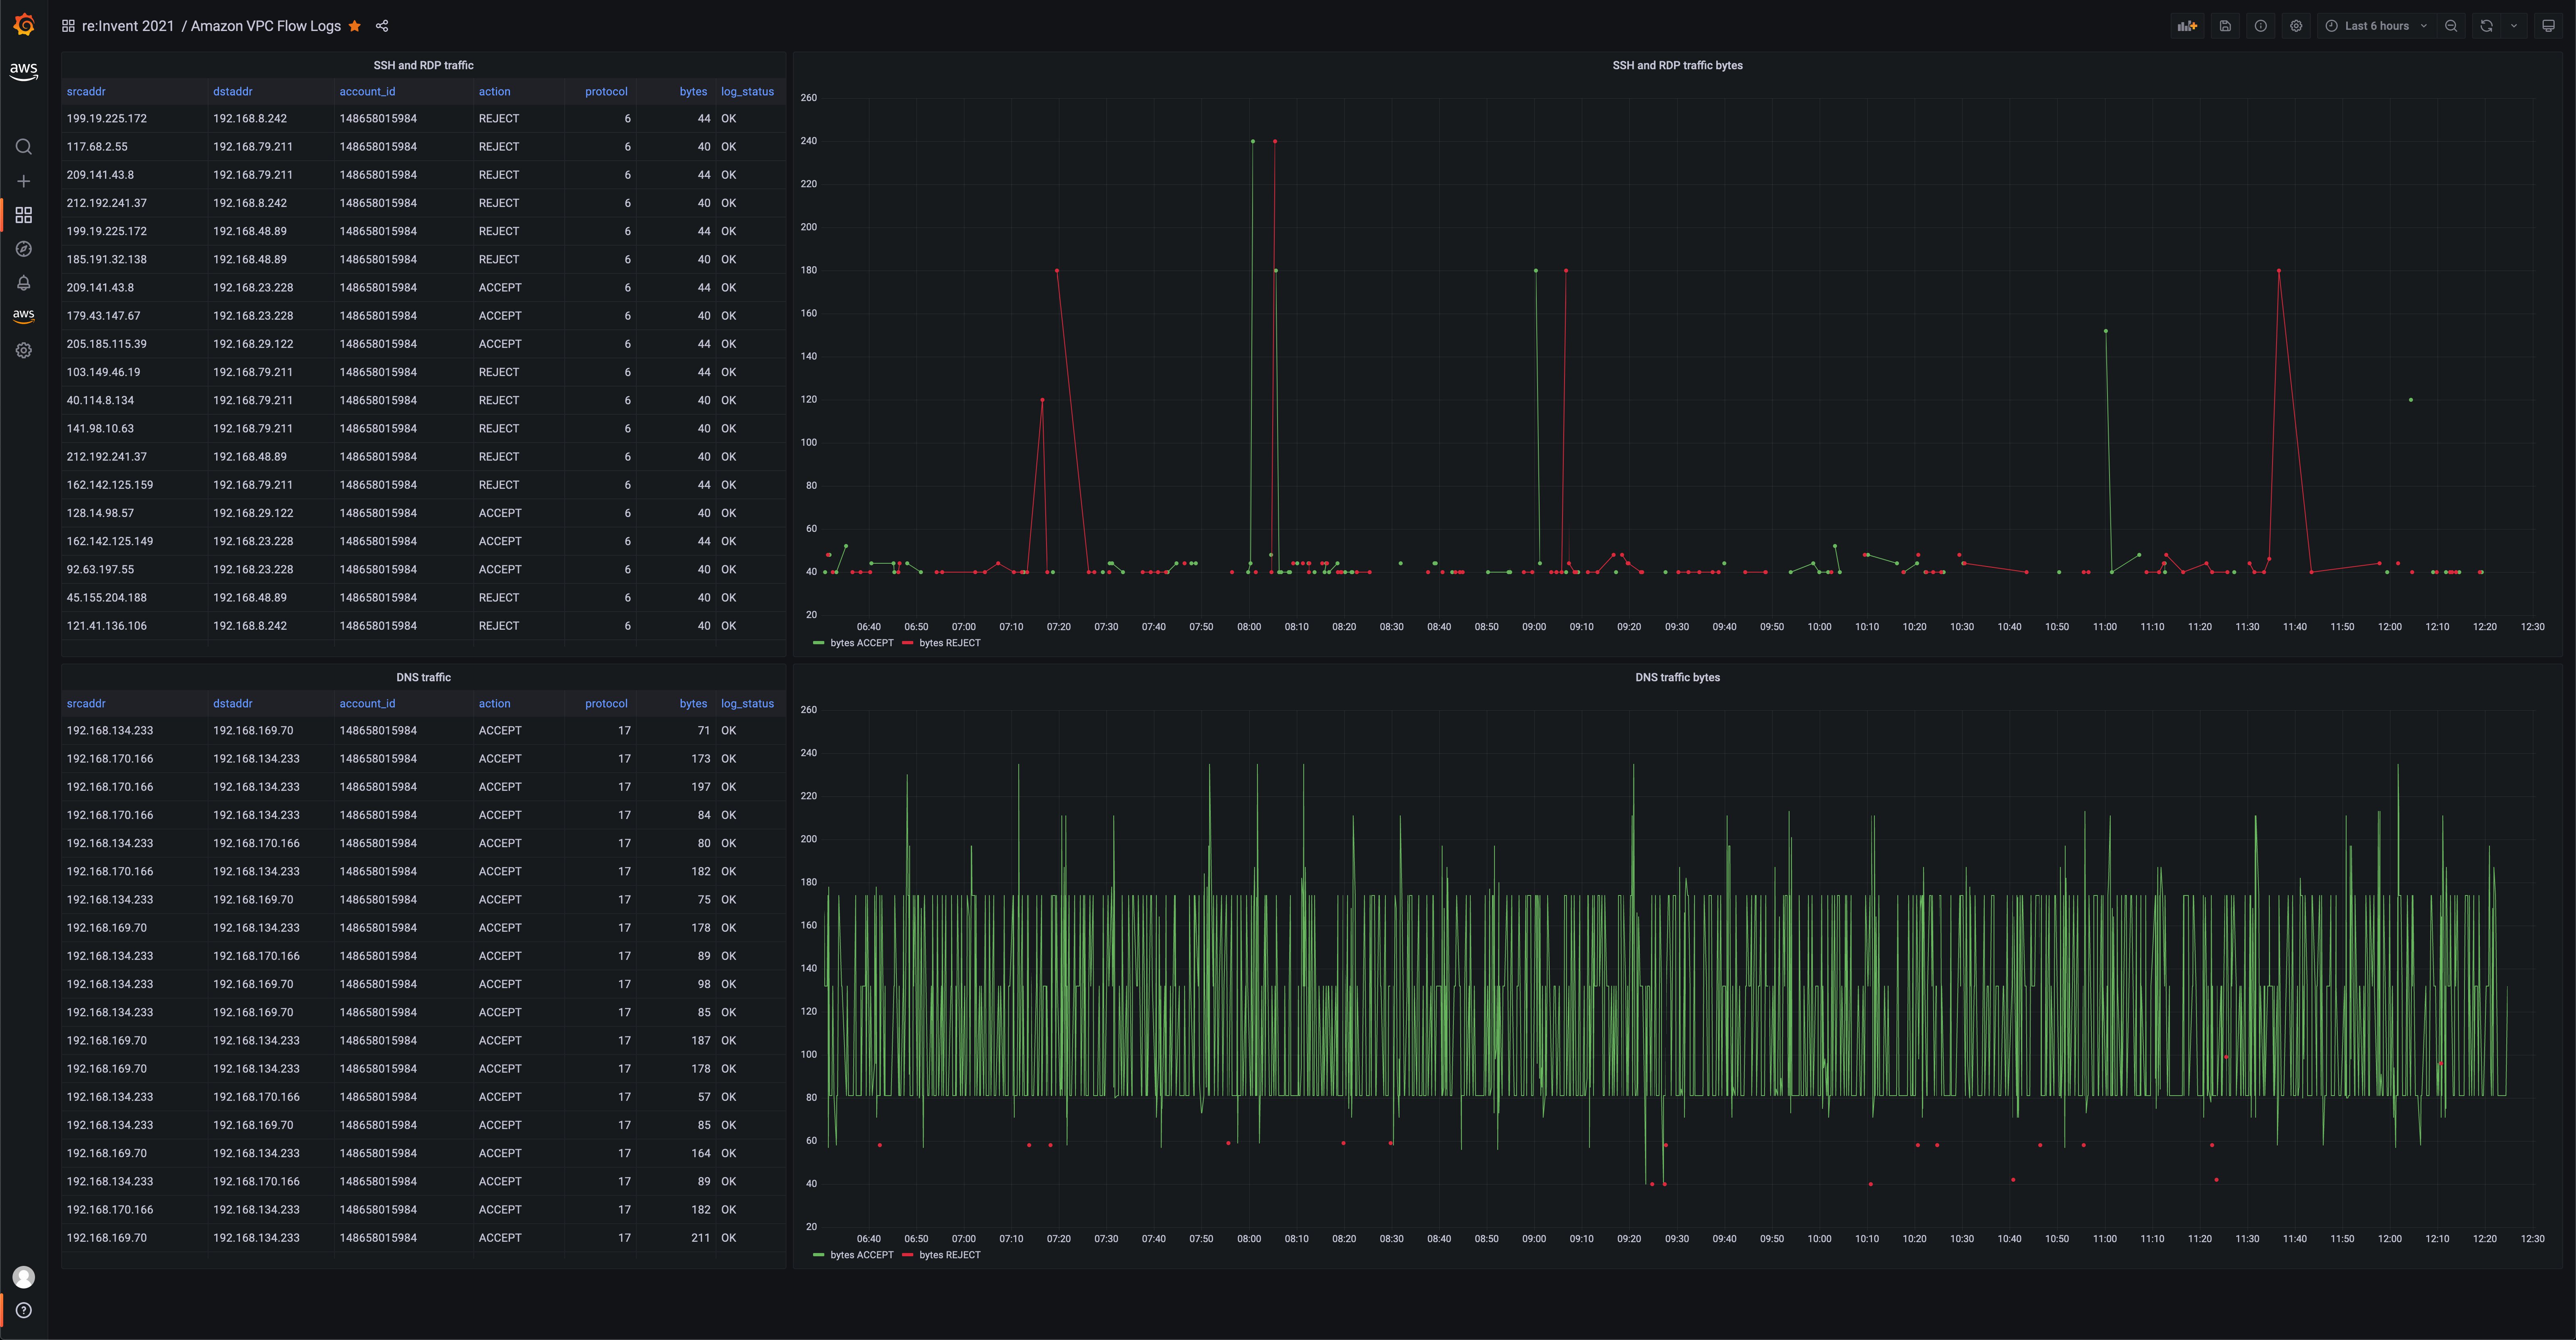
Figure 3: Grafana visualization showing VPC Flow logs query using the Athena data-source plugin
See also:
Amazon Redshift data source
Amazon Redshift is a fully managed, petabyte-scale data warehouse service in the cloud, which now is also serverless. This data source now lets you perform analytical SQL queries against all of your Redshift clusters. By default, we included the performance monitoring dashboard:
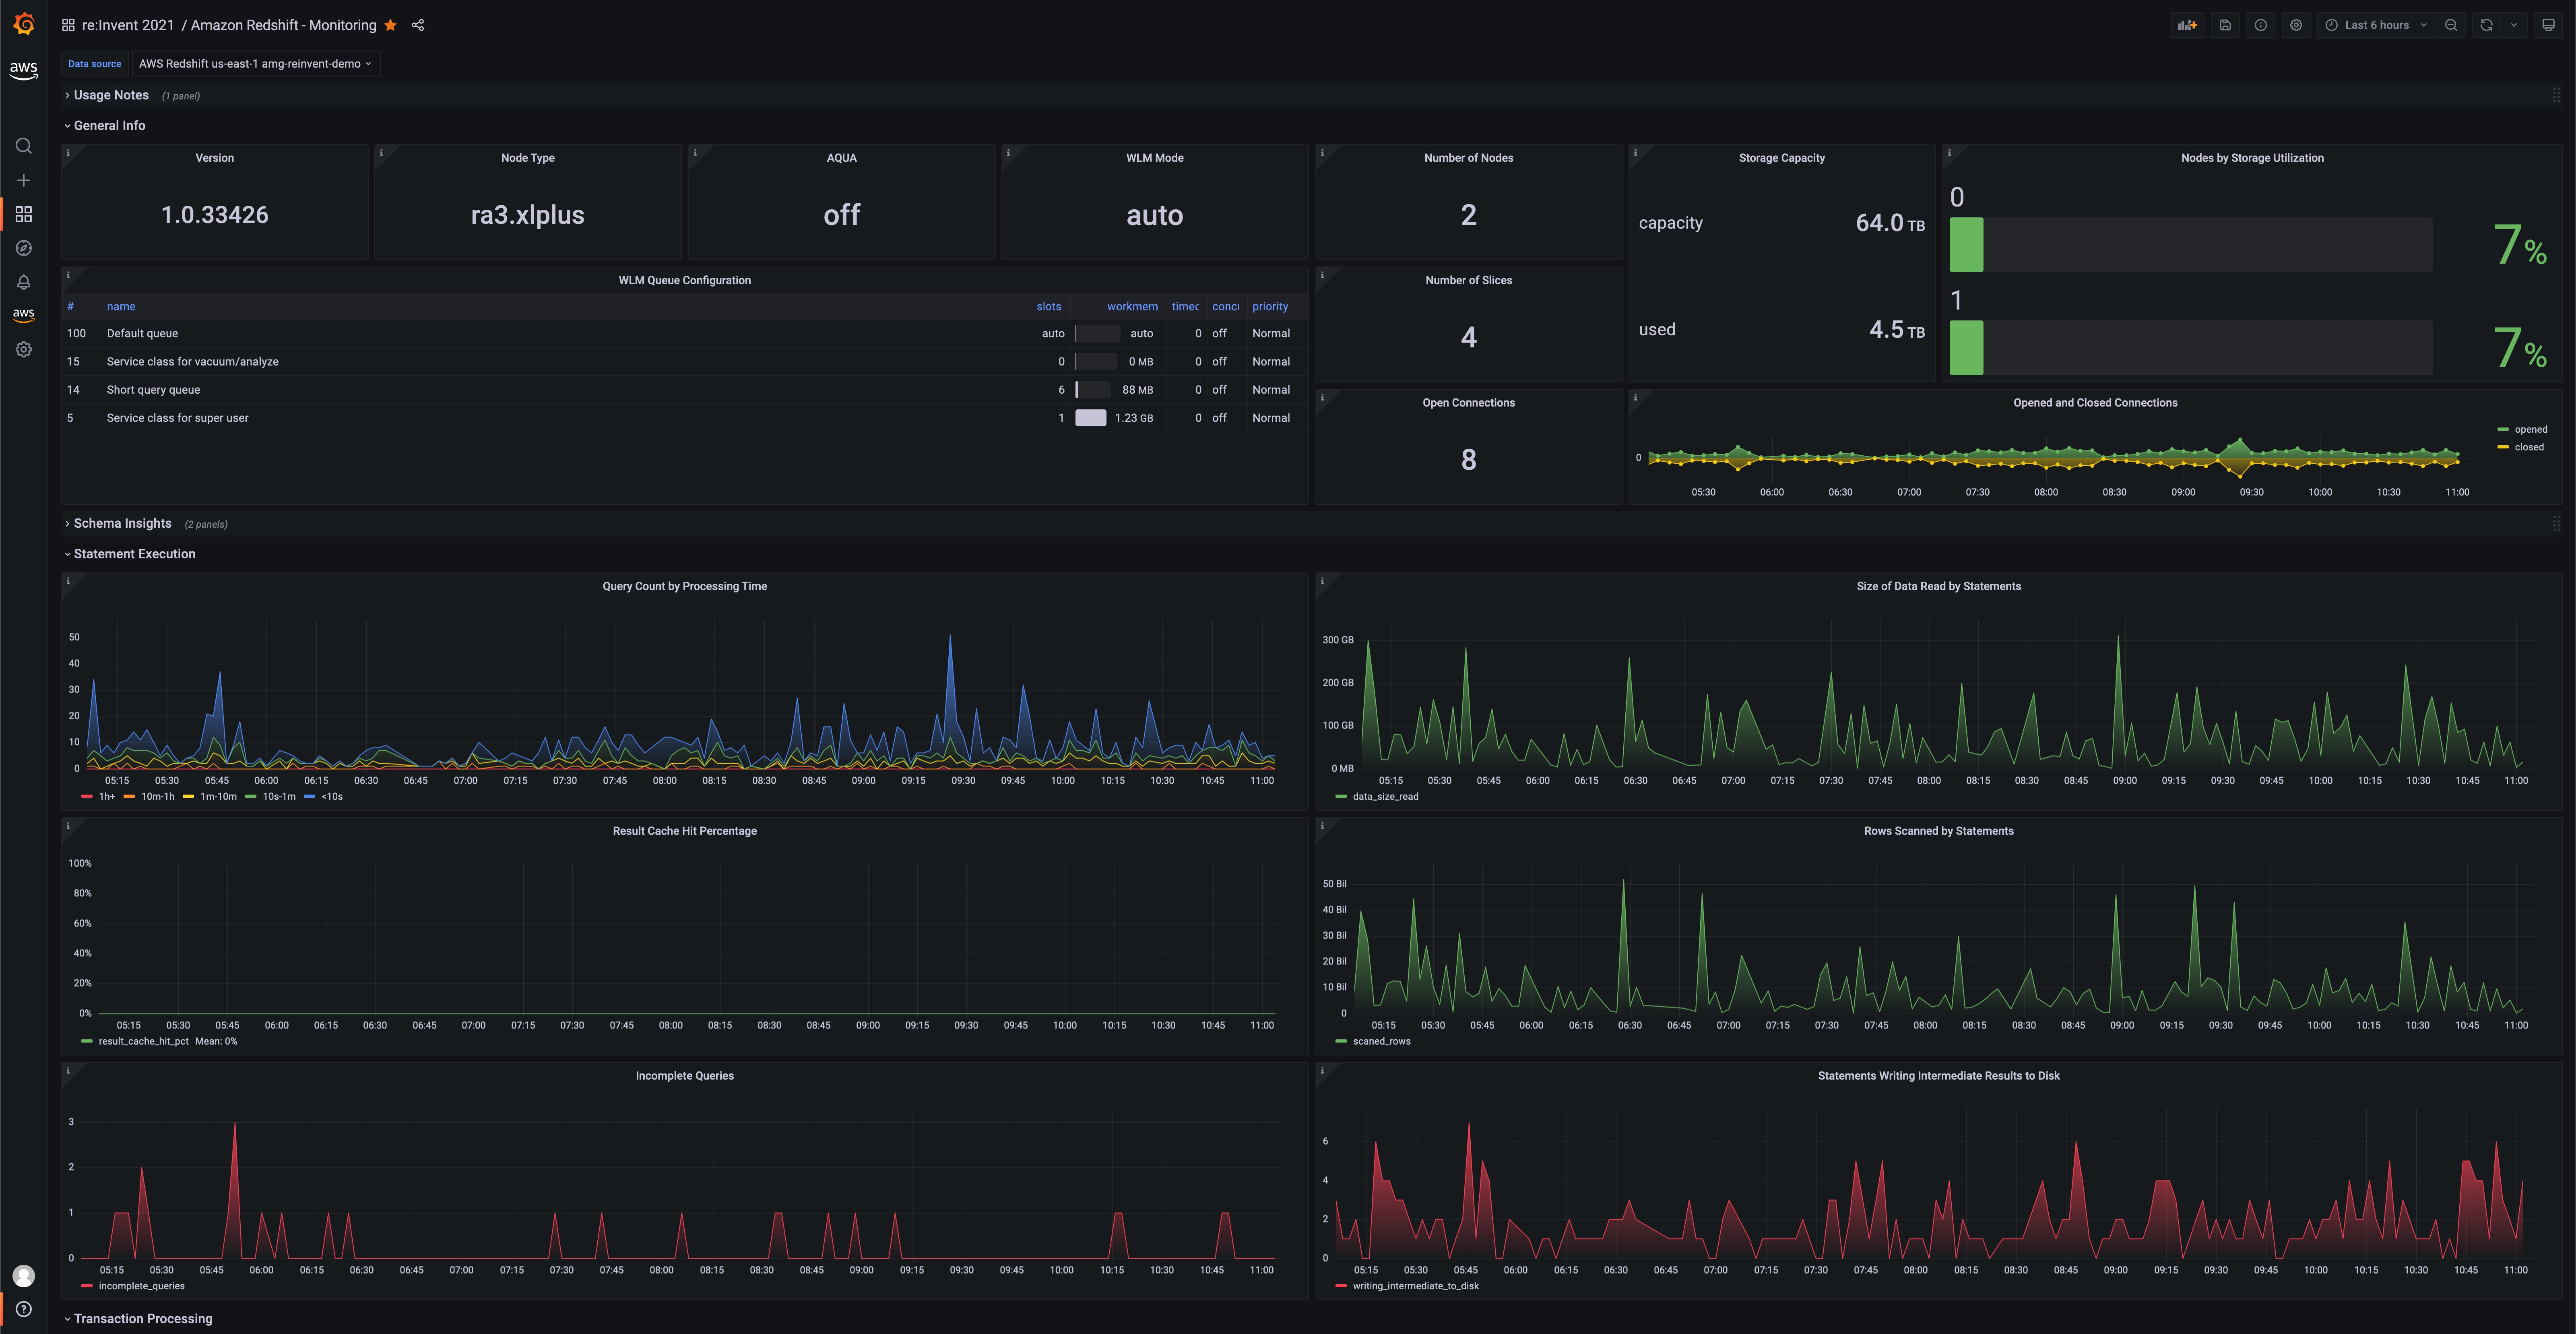
Figure 4: Grafana visualization showing the performance monitoring dashboard of a Redshift cluster
Another example dashboard that you can use to visualize contents of the Redshift sample database looks like the following:
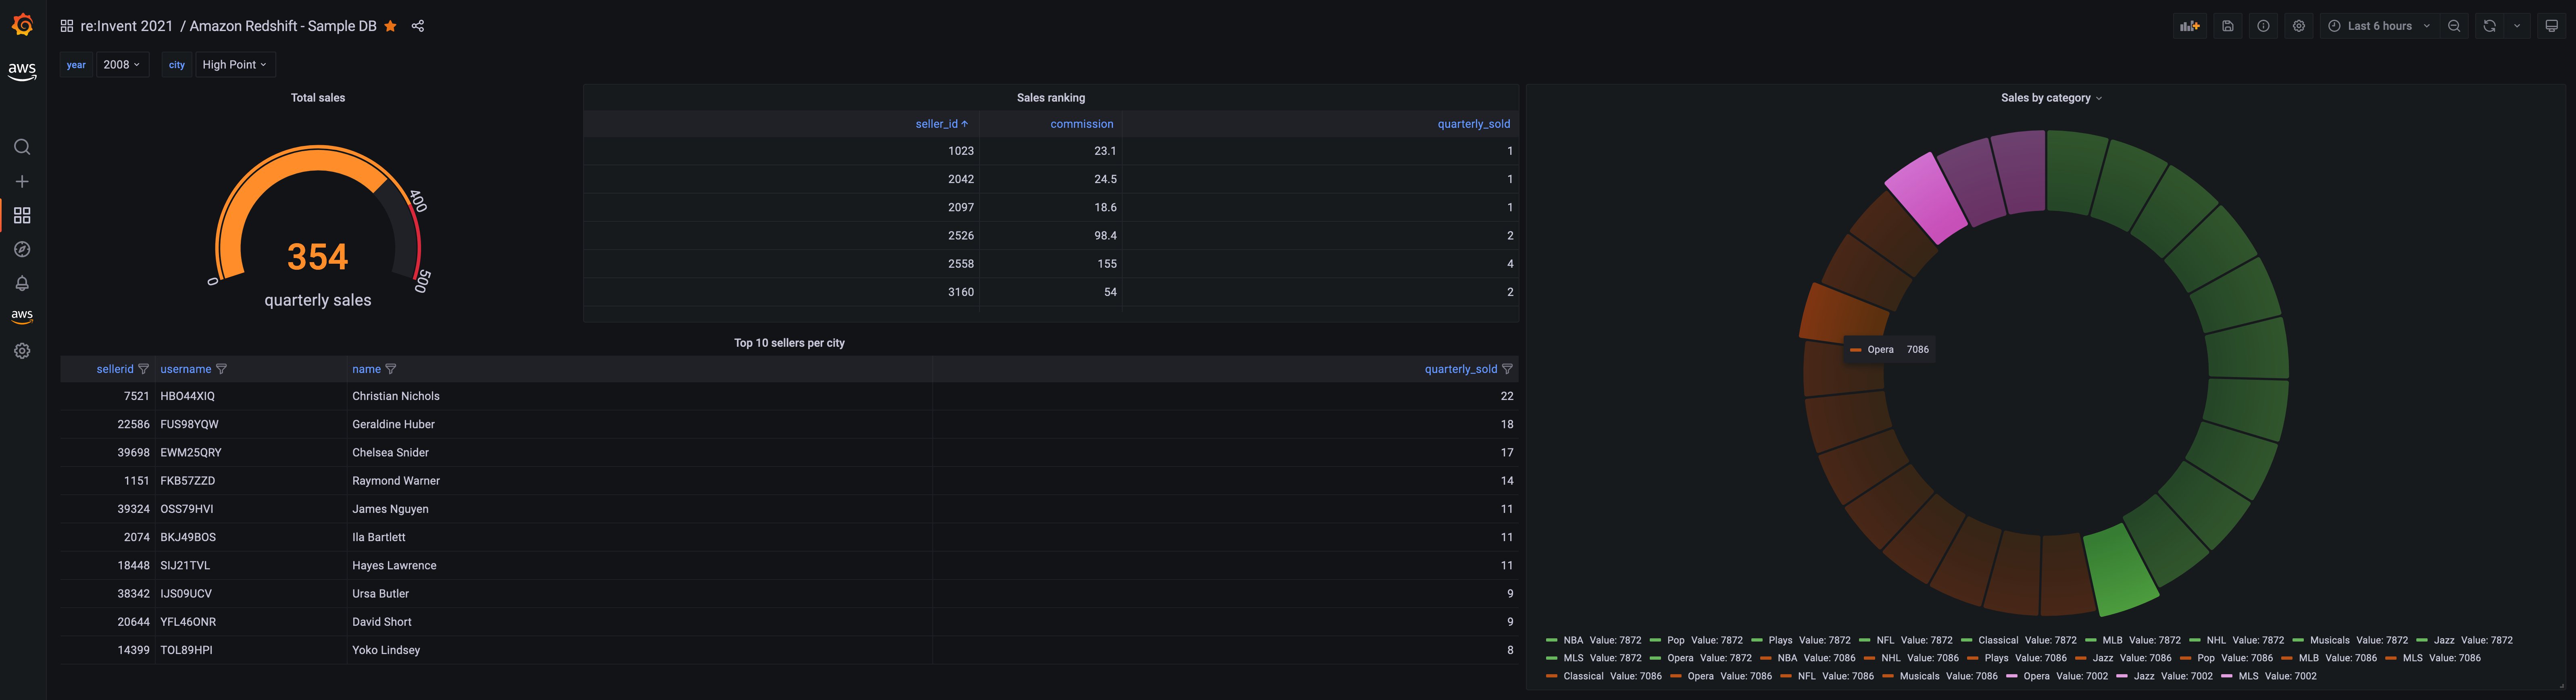
Figure 5: Grafana visualization showing sample data from a Redshift cluster using the Redshift datasource plugin
See also:
CloudWatch Metrics Insights
Amazon CloudWatch announced the preview availability CloudWatch Metrics Insights, a powerful high-performance SQL query engine that you can use to query your metrics at scale. Using the updated CloudWatch datasource plugin, you can query CloudWatch Metrics using SQL. As shown in the following image, you now have a free text area to simply type in the Metrics Insights query that you want to use to query the data.
For example, if you use the following CloudWatch Metrics Insights query that lists the top Lambda function invocations ordered by invocation count,
SELECT SUM(Invocations)
FROM SCHEMA("AWS/Lambda", FunctionName)
GROUP BY FunctionName
ORDER BY SUM() DESC
then the resulting data graphed on a time series visualization looks like the following:
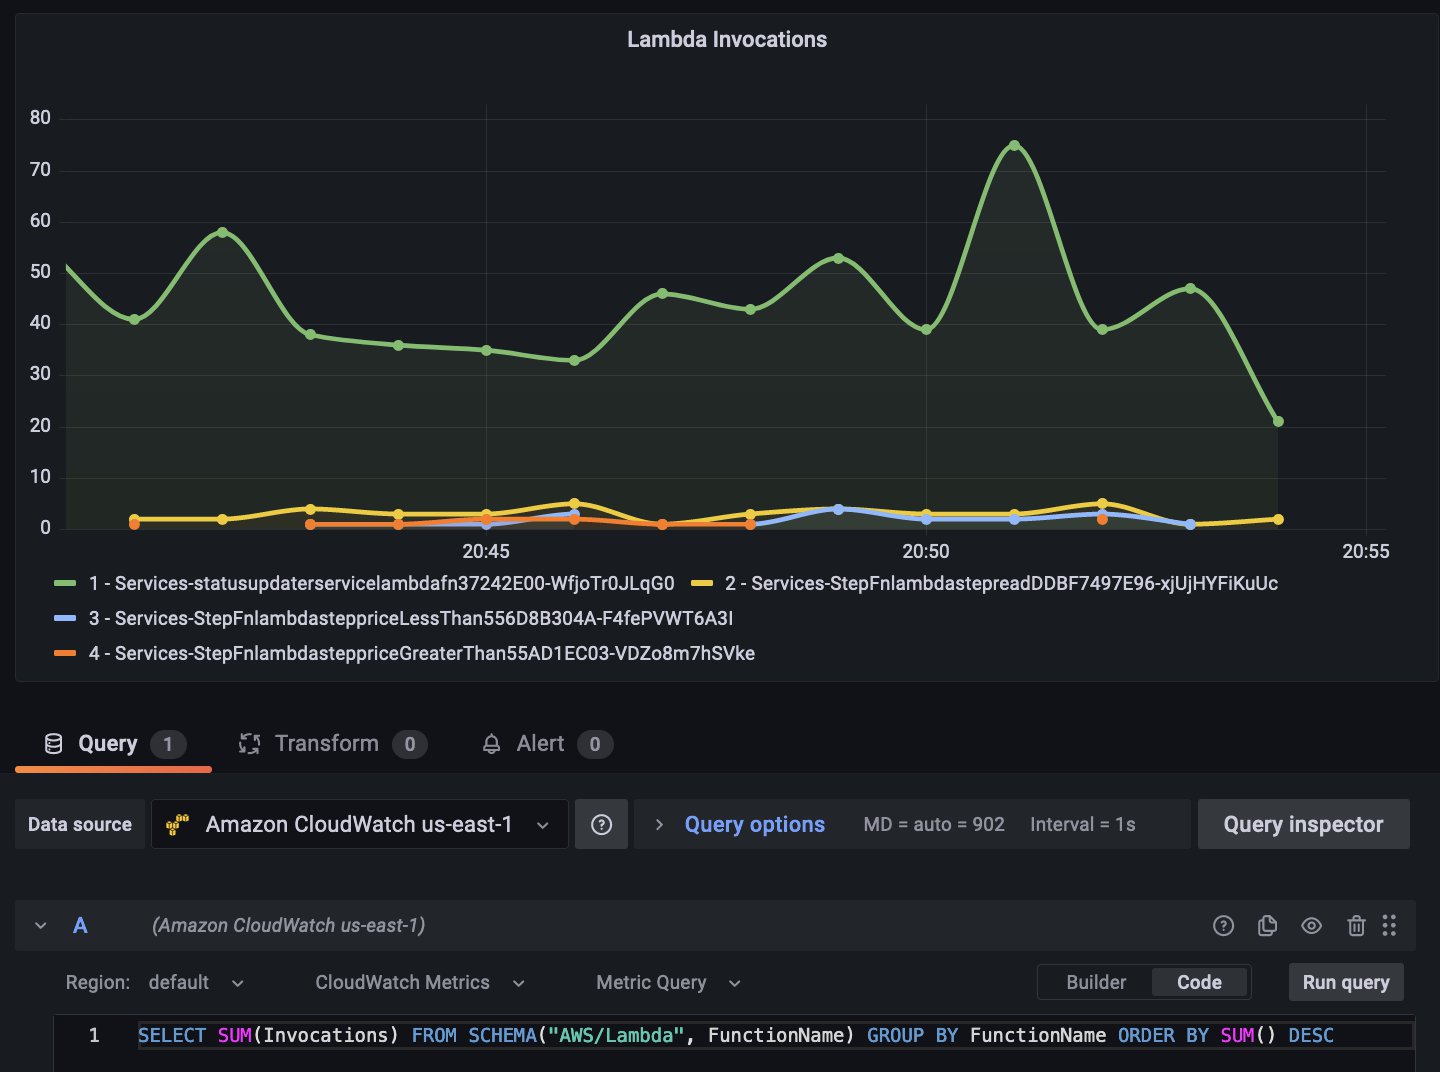
Figure 6: Grafana visualization showing Lambda invocation data using CloudWatch Metrics Insights SQL query option
Furthermore, you can use the Builder mode to construct the query easily. The following screenshot shows how the exact same query as above can be built using the Builder option with a donut visualization:
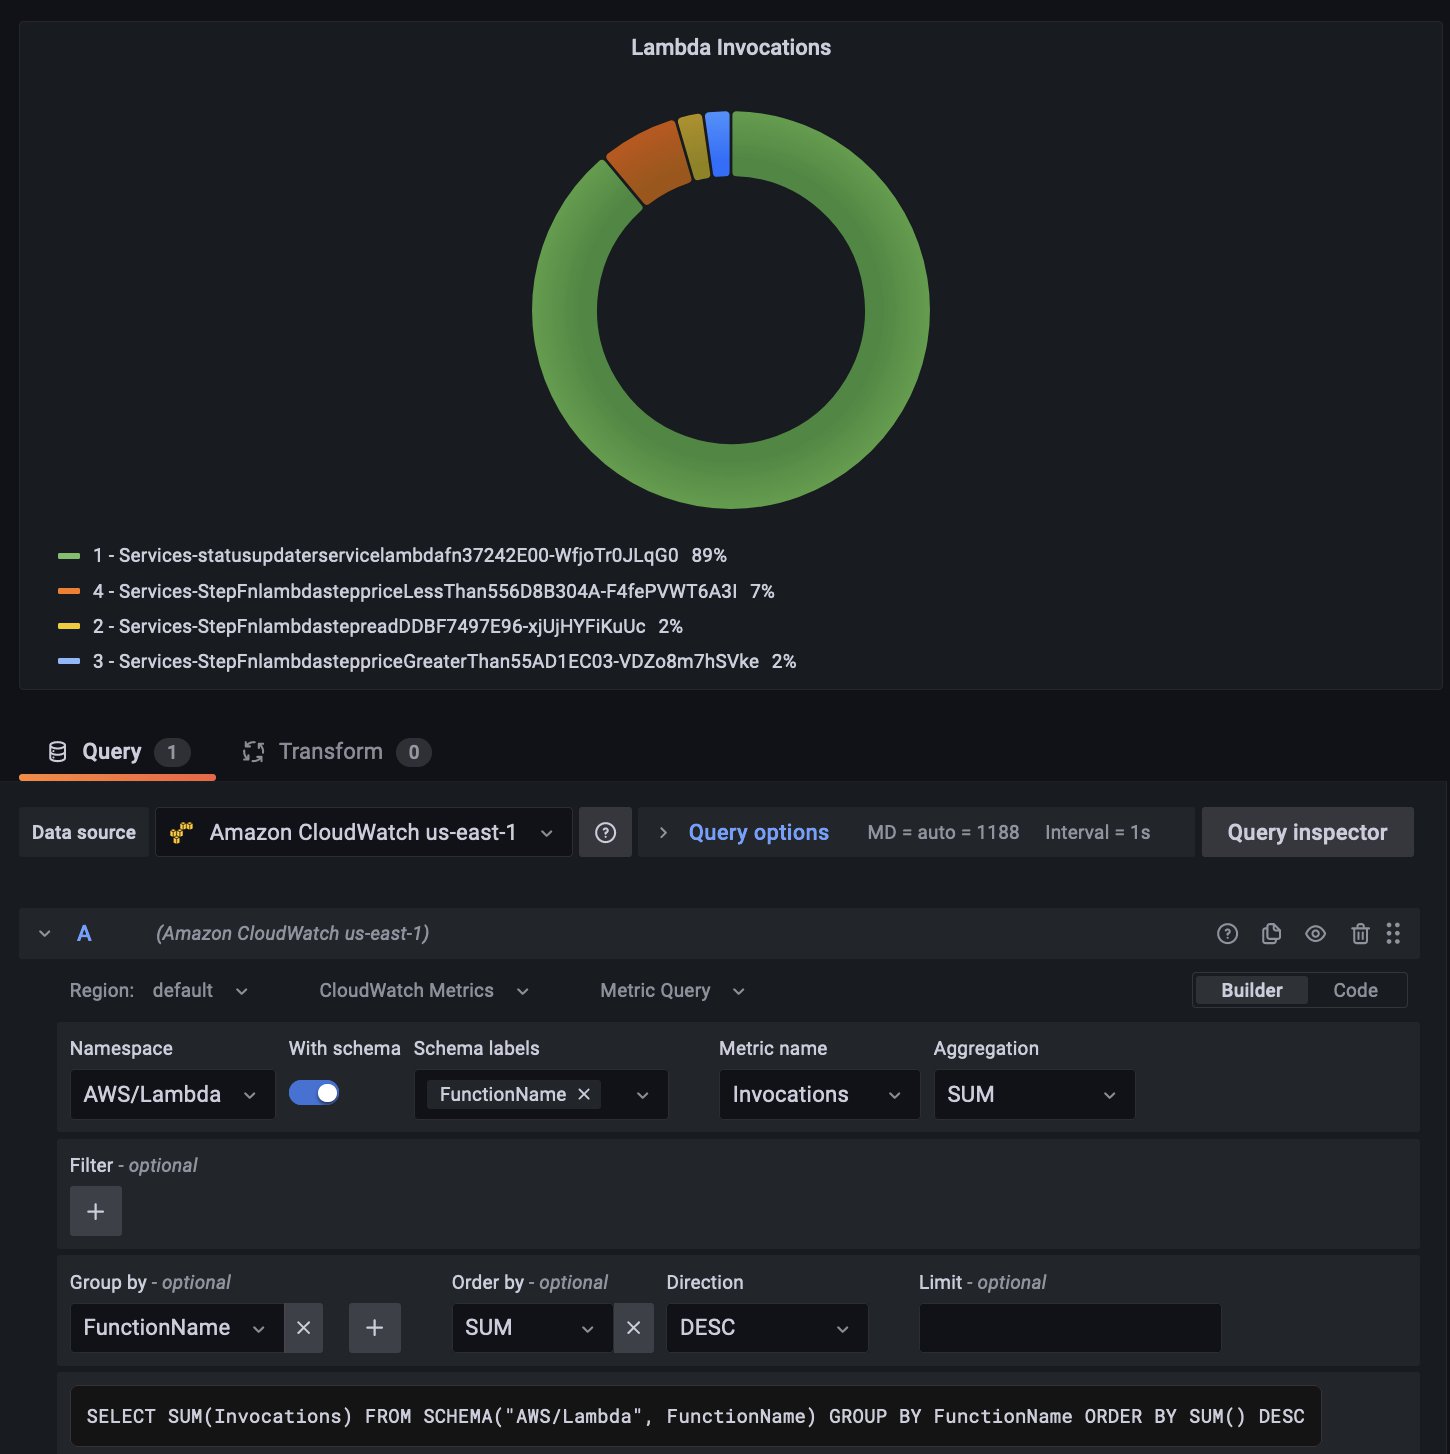
Figure 7: Grafana visualization showing Lambda invocation data using CloudWatch Metrics Insights query builder option
Learn more about CloudWatch Metrics Insights in the Amazon Managed Grafana docs, and take a look at the blog post that goes through this feature in greater detail.
IoT TwinMaker
Currently in preview, AWS IoT TwinMaker lets you build operational digital twins of physical and digital systems. IoT TwinMaker creates digital visualizations using measurements and analysis from a variety of real-world sensors, cameras, and enterprise applications to help you track your physical factory, building, or industrial plant. Also, see our Amazon Managed Grafana docs for how to use it.
What’s next
As you know, a large number of the features we deliver are based on what customers like yourself tell us. So please tell us through your AWS account contacts on what you like to see next, from features to data source and what you think we should focus on in 2022!