AWS Cloud Operations Blog
Identify operational issues quickly by using Grafana and Amazon CloudWatch Metrics Insights (Preview)
Amazon CloudWatch has recently launched Metrics Insights (Preview) – a fast, flexible, SQL-based query engine that enables you to identify trends and patterns across millions of operational metrics in real-time. With Metrics Insights, you can easily query and analyze your metrics to gain better visibility into the health and performance of your infrastructure and large scale applications. This capability is now also available in Open Source Grafana and in Amazon Managed Grafana.
For the last two years, Grafana users have been analyzing CloudWatch metrics using SEARCH expressions. Now with the Metric Insights integration in Grafana release 8.3, which was completed in partnership with the AWS and Grafana Labs, Grafana extends the metric analytics capabilities with flexible querying and on-the-fly metric aggregations in order to respond promptly to operational problems. Metrics Insights also works with Grafana Alerting (introduced in Grafana 8.0), allowing users to create alerts powered by CloudWatch Metrics Insights that quickly target problems in infrastructures as they happen.
With Metrics Insights, you can slice and dice your operational metrics with your dimensions to dive deep and identify issues to the finest granular detail. For example, you can analyze thousands of Amazon EC2 instances by CPU utilization to troubleshoot an underperforming application. You can group your metrics by InstanceId to narrow down your analysis and identify failing instances rapidly. Once the instance is isolated, you can now recover the application by rebooting problematic instances. Moreover, you can use your queries to create powerful visualizations that will stay up to date as resources are deployed or shut down, helping you proactively monitor and identify issues quickly.
Metrics Insights comes with standard SQL query language, giving you the flexibility to group your metrics in real-time based on your use cases. You can use WHERE clause in order to narrow down your analysis or use ORDER BY to sort your results. For example, DESC displays in (descending) order, to list your time series such that the highest data point will be returned first. Likewise, LIMIT clause enables you to limit the number of results that can be returned, helping you to run “TOP N” type queries.
Amazon CloudWatch plugin to query CloudWatch Metrics Insights
CloudWatch Metrics Insights is available through the GetMetricData API, which means that if you already have a CloudWatch data source plugin setup in Grafana, there’s no need for additional configuration. To use Metrics Insights in the Amazon CloudWatch plugin in Grafana, you must select the Metric Query type.
The Metric Query type has two different modes — a Builder mode and a Code editor mode.
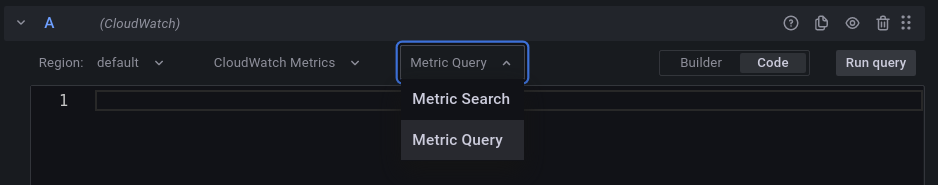
Metric Query mode in the CloudWatch plugin
CloudWatch Metrics Insights uses a dialect of SQL. The syntax is as follows:
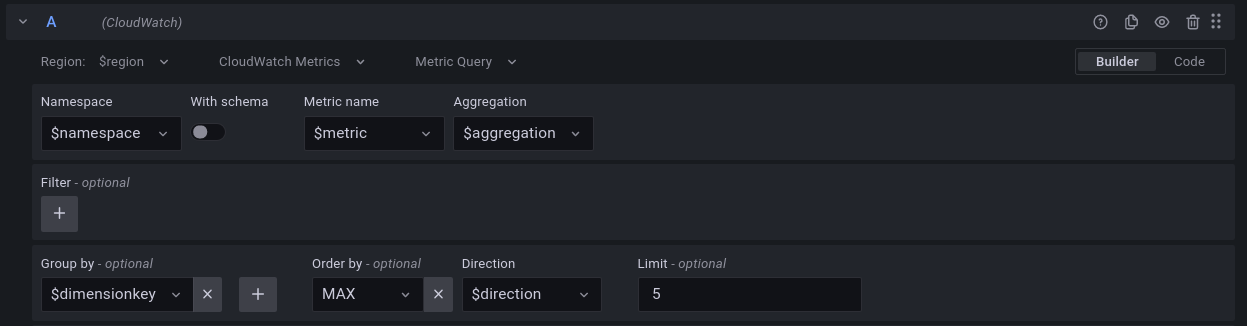
Metrics Insights makes it easy to get started. Even if you don’t know SQL, you can use the visual query builder to browse through your existing metrics and dimensions, by selecting the metrics of interest, resource names, and filters to narrow down your analysis. Then the console automatically constructs your SQL queries for you based on your selections.
Builder mode in the CloudWatch plugin
You can use the code editor in the Code mode of the CloudWatch plugin to type in your raw SQL queries anytime to dive deep and identify issues to the finest granular detail. The code editor comes with built-in autocompletion support that provides suggestions for keywords, functions, namespaces, metrics, dimension keys, and dimension values.
The following example demonstrates how to view the top five instances with the highest average CPU utilization, ordered by maximum, and in descending order. The autocompleter provides smart suggestions throughout the composition of the query.
Code mode in the CloudWatch plugin
Grafana template variables allow you to create more interactive and dynamic dashboards. Instead of hardcoding values like namespace, metric, and aggregation functions in your queries, you can use variables in their place. Variables are displayed as dropdown lists at the top of the dashboard. These dropdowns make it easy to change the data displayed in your dashboard. When using Metric Query type in the CloudWatch plugin, you can use template variables in both the Builder and the Code mode.
Template variables in the Grafana plugin
In this post, we went through the integration between OpenSource Grafana and CloudWatch Metrics Insights, how you can use Metrics Insights’ SQL based query engine on OpenSource Grafana to flexibly analyze and group your metrics at scale in real time, and quickly identify the operational issues to reduce mean-time to resolution.
To learn more about CloudWatch Metrics Insights or to get started, check out the CloudWatch Metrics Insights documentation and from Grafana.