AWS Cloud Operations Blog
How Twitch monitors its services with Amazon CloudWatch
by Alex Cioc and Steve McCurry
Twitch is the leading service and community for multiplayer entertainment and is owned by Amazon. Twitch also provides social and features and micro-transaction features that drive content engagement for its audiences. These services operate at a high transaction volume.
Twitch uses Amazon CloudWatch to monitor its business-critical services. It emits custom metrics then visualizes and alerts based on predefined thresholds for these key metrics. The high volume of transactions handled by the Twitch services makes it difficult to design a metric ingestion strategy that provides sufficient throughput of data while balancing the cost of data ingestion.
Amazon CloudWatch client-side aggregations is a new feature of the PutMetricData API service that helps customers to aggregate data on the client-side, which increases throughput and efficiency. In this blog post we’ll show you how Twitch uses client-side data aggregations to build a more effective metric ingestion architecture while achieving substantial cost reductions.
CloudWatch custom metrics overview
Amazon CloudWatch enables customers to publish their own system or application metrics as custom metrics. The recommended approach to publishing custom metrics is to deploy the CloudWatch agent on your hosts. The CloudWatch agent automatically aggregates data on the client-side and sends data to the CloudWatch PutMetricData API service.
Previously, PutMetricData only supported publishing a single data point per metric per API call. Now, you can use the client-side aggregations feature to publish arrays of values and counts (or histograms) to PutMetricData. With client-side aggregations you can send more data at lower cost, reducing the number of PutMetricData API calls. This results in lower resource utilization on your hosts.
DevOps at Twitch
Twitch has a centralized tools team that develops and manages the Twitch Telemetry platform and drives operational excellence across the organization. Twitch Telemetry provides a collection of libraries for collecting, aggregating, sending, and utilizing metrics that can be leveraged by service teams at Twitch to monitor their services.
The Twitch Rewards and Twitch Emotes services are two of the DevOps teams that use Twitch Telemetry to monitor their APIs and emit their metrics to Amazon CloudWatch.
- Twitch Rewards enables viewers of broadcasts like Overwatch League to cheer for players using Bits. The Rewards service can experience up to 1500 transactions per second (TPS).
- Twitch Emotes displays emoticons on social channel pages. The Emotes service experiences daily peaks around 10,000 TPS.

How Twitch approaches monitoring
Before Twitch Telemetry, individual services used custom tools for sending metrics to Amazon CloudWatch. One of biggest monitoring challenges Twitch services faced was efficiently scaling their metric publishing tools. As a workaround, services only published a small percentage of available data observations. This sampling approach reduced calls to the monitoring system but resulted in data loss that created less accurate metrics.
Twitch Telemetry provides agent libraries that service teams can easily integrate with their API based services to send custom metrics to Amazon CloudWatch. Services like Twitch Emote and Twitch Rewards have adopted Twitch Telemetry. Twitch Telemetry batches metric data before sending to Amazon CloudWatch.
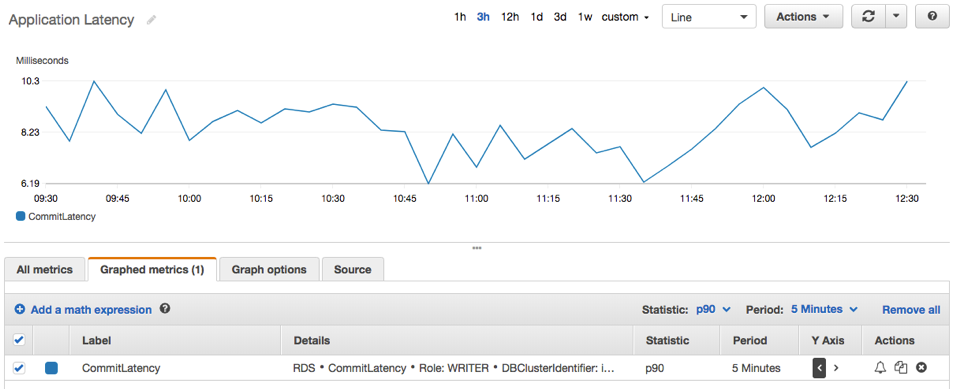
The key metrics that the DevOps teams at Twitch monitor are latency, errors, and throttling. Twitch DevOps engineers monitor the percentile statistic of the metrics which is calculated automatically by CloudWatch. The key benefit of percentile statistics is that the percentile removes the noise of outliers in the data, providing a clearer signal. This is particularly useful when the metric sample count over a period of time is high (for example, data observations for a high-volume API service).
In CloudWatch, the sample count and percentile statistics can be selected under the statistic option of the Graphed metrics tab:
Implementing Amazon CloudWatch client-side aggregations
The Twitch engineering team immediately seized the opportunity to use Amazon CloudWatch client-side aggregations to help scale their metric publishing tooling. Using client-side aggregations, Twitch reduced the number of calls to the CloudWatch PutMetricData API service, allowing them to simultaneously increase the volume of data published whilst reducing resource utilization and costs. By publishing a higher number of data observations per minute, Twitch was able to create more accurate metrics that are better suited to monitoring percentiles.
Twitch Telemetry deploys CloudWatch client-side aggregations in a modified version of the Amazon CloudWatch agent. The agent automatically aggregates data client-side, reducing the number of API calls to CloudWatch PutMetricData.
As a result of switching to client-side aggregations, the Twitch Emotes service went from 200 million PutMetricData calls per day to 2 million calls per day. This represented a 99% cost saving. Previously, the Emotes service was being sampled at a rate of 10 percent. However, after client-side aggregations was deployed the sampling was removed and all data was published to CloudWatch. Another benefit was far lower CPU utilization on the service hosts, which led to greater fleet scalability.
The graphs below show the impact that the migration to client-side aggregations on 11/30 had on the Twitch fleet.
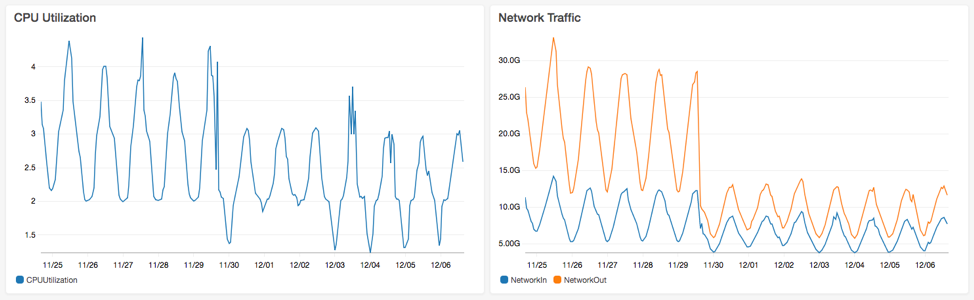
Likewise, the Twitch Rewards service went from around 450 million calls per day to PutMetricData to between 4 million and 5 million calls. This 99% reduction in call volume created proportional drop in API costs. By switching to client-side aggregations sampling was eliminated.
For just these two services, the direct savings to the business over the course of a year was substantial. Also, sampling was eliminated, allowing for more accurate metrics and fleet utilization reductions, allowing greater fleet scalability.
Conclusion
Client-side metric aggregations is a new feature of the CloudWatch PutMetricData API service that allows you to ingest metric data more efficiently. This efficiency can be used to lower the number of API calls to Amazon CloudWatch, reducing resources and costs. Client-side aggregations can be used to monitor high volume APIs by publishing metrics like latency, errors, and throttling. You can use the percentiles statistics calculated by CloudWatch to reduce noise that can lead to false alarms. The CloudWatch agent has client-side aggregations enabled by default, and is the recommended best practice for publishing custom metrics to CloudWatch.
This blog post demonstrated how Twitch monitors its services efficiently by leveraging Amazon CloudWatch client-side aggregations. You can use this feature by deploying the Amazon CloudWatch agent to publish custom metrics for your applications. The CloudWatch agent has client-side aggregations enabled by default and is the most efficient way to publish custom metrics at scale.
For more information, see the Amazon CloudWatch agent documentation, or visit our homepage to learn more about how Amazon CloudWatch can help you achieve monitoring visibility for your cloud resources and applications. Also, there is a demonstration application that publishes data to Amazon CloudWatch using client-side aggregations through the AWS SDK.
It would be great to hear your feedback.
About the Authors

Alex Cioc is a Software Development Engineer for the Builder Platform team at Twitch. He is passionate about metrics and data visualization and leads company-wide telemetry standardization initiatives. Alex has worked on high throughput services at Twitch and Amazon Video and continues focusing on scalability and deployment concerns.

Stephen McCurry is a Senior Product Manager for Amazon CloudWatch based in Dublin, Ireland. He spends his time talking with customers and using feedback to prioritize and develop new products and features. He is a builder and likes to write code to solve customer problems. He’s also an ultra runner and spends much of his spare time in the mountains.