AWS Cloud Operations Blog
Optimizing metrics ingestion with Amazon Managed Service for Prometheus
Managing metrics collection at scale in complex cloud environments presents significant challenges for organizations, particularly when it comes to controlling costs and maintaining operational efficiency. As the volume of metrics grows exponentially with the expansion of container deployments and other cloud-native workloads, customers often struggle to balance comprehensive monitoring with resource optimization. This can lead to increased operational complexity and potential overspending on monitoring infrastructure.
This blog is a part in a blog series on governance controls with Amazon Managed Service for Prometheus. In the first blog, Optimizing Queries with Amazon Managed Service for Prometheus, we explored features like Query Logging and Query Thresholds that help optimize PromQL query patterns and costs. In this blog, we’ll explore how to set up cross-account metrics ingestion and establish governance controls with Amazon Managed Service for Prometheus.
Overview
Building on the centralized observability architecture scenario introduced in our first blog post, Example Corp, a multinational company, is collecting all platform and application metrics in Prometheus format with a centralized view from multiple AWS accounts.
Example Corp maintains a central Amazon Managed Service for Prometheus workspace in their monitoring account, with managed collectors automatically scraping metrics from applications running across different AWS accounts. As shown in Figure 1, their architecture leverages AWS Identity and Access Management (IAM) roles to establish secure, permission-based connections between accounts, eliminating the need for manually managing Prometheus scrapers in each account.
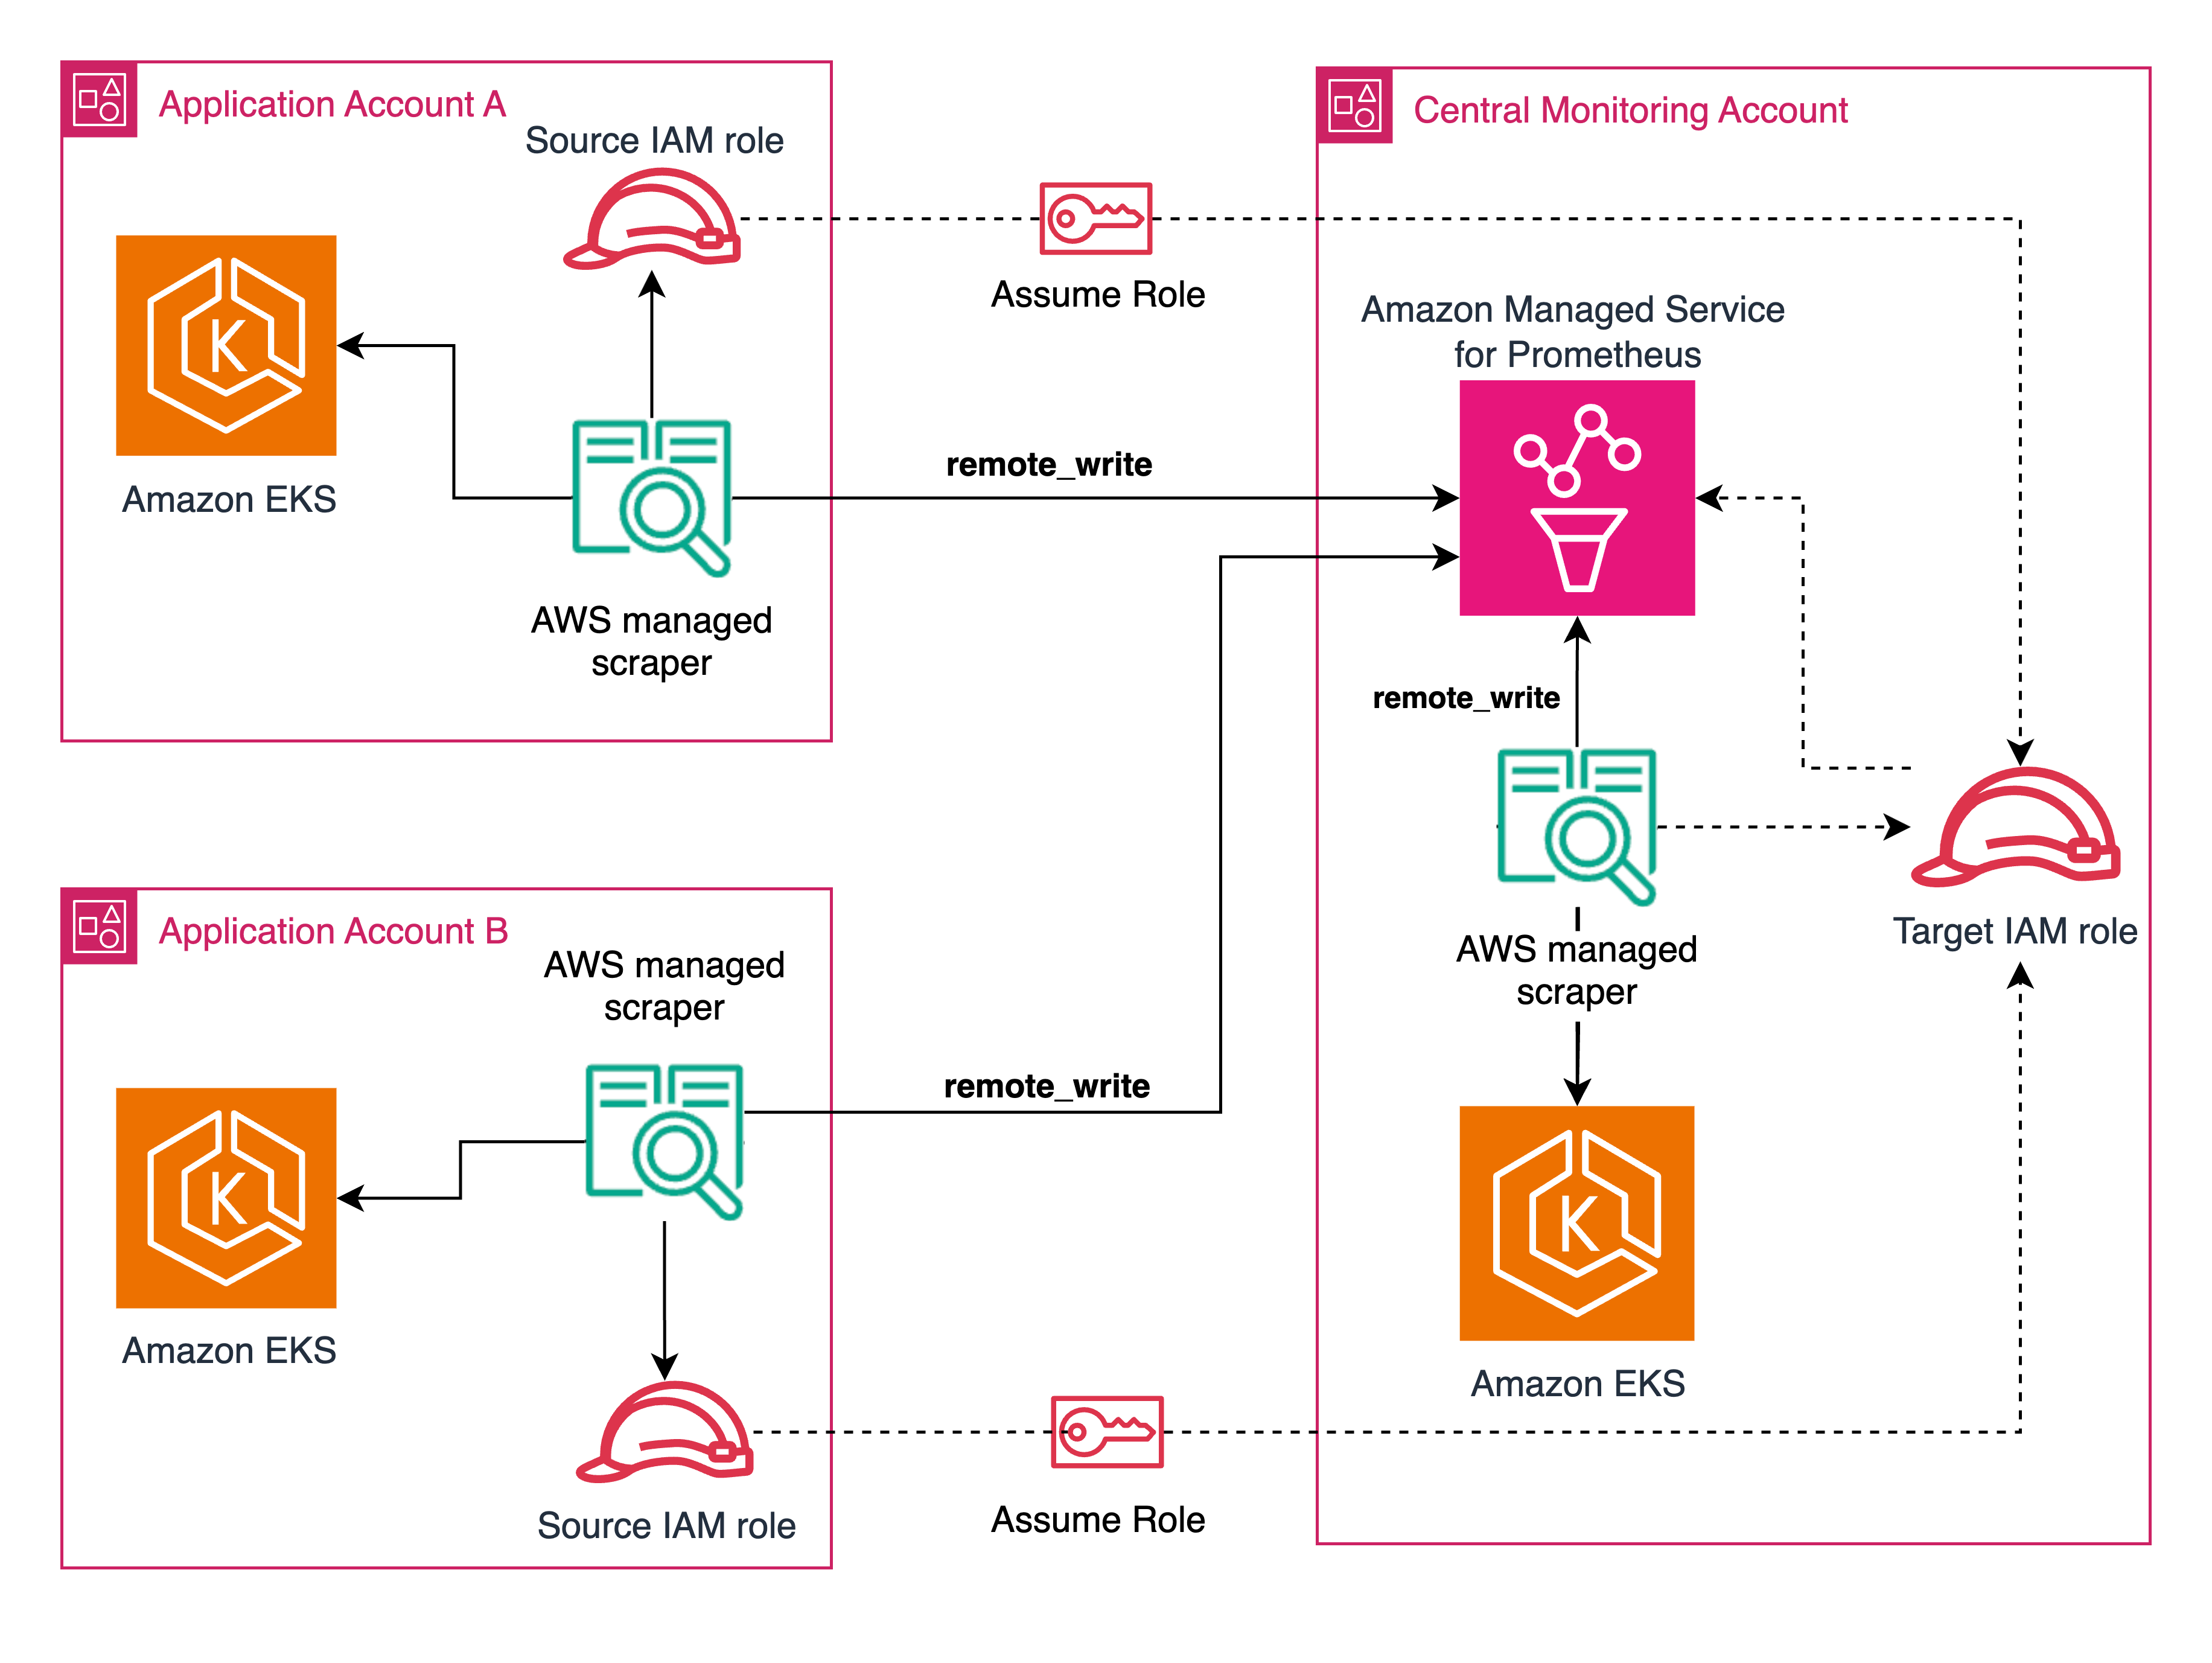
Figure 1: Cross Account scraping using AWS managed collectors
While this centralized architecture significantly reduces operational overhead, Example Corp faces a growing challenge with metric volume control. As different application teams push increasing amounts of data to the central workspace, the Example Corp needs to add controls to optimize metrics ingestion. To address this challenge, it’s crucial to first understand how to monitor the Amazon Managed Service for Prometheus workspace effectively.
Insights into ingestion
Example Corp needs to gain visibility into their ingestion. Also, they want to set up alarms for when their ingestion starts to encounter issues. Amazon Managed Service for Prometheus now allows you to view applied quota values and their utilization for your Amazon Managed Service for Prometheus workspaces using AWS Service Quotas and Amazon CloudWatch.
AWS Service Quotas allows you to quickly understand your applied service quota values and request increases in a few clicks. With Amazon CloudWatch usage metrics, you can create alarms to be notified when your Amazon Managed Service for Prometheus workspaces approach applied limits and visualize usage in CloudWatch dashboards. These metrics are essential for understanding your Amazon Managed Service for Prometheus workspace’s behavior and optimizing its performance.
Below are some key metrics available for monitoring Amazon Managed Service for Prometheus. For all the available metrics, check out the CloudWatch metrics:
- IngestionRate: Measures the volume of samples ingested per second, helping you understand your data inflow patterns
- ActiveSeries: Shows the number of unique time series currently active in your workspace
- QueryMetricsTPS: Indicates the number of queries processed per second
- RuleEvaluations: Tracks the number of alert rule evaluations
- DiscardedSamples: Tracks samples that couldn’t be ingested due to various constraints
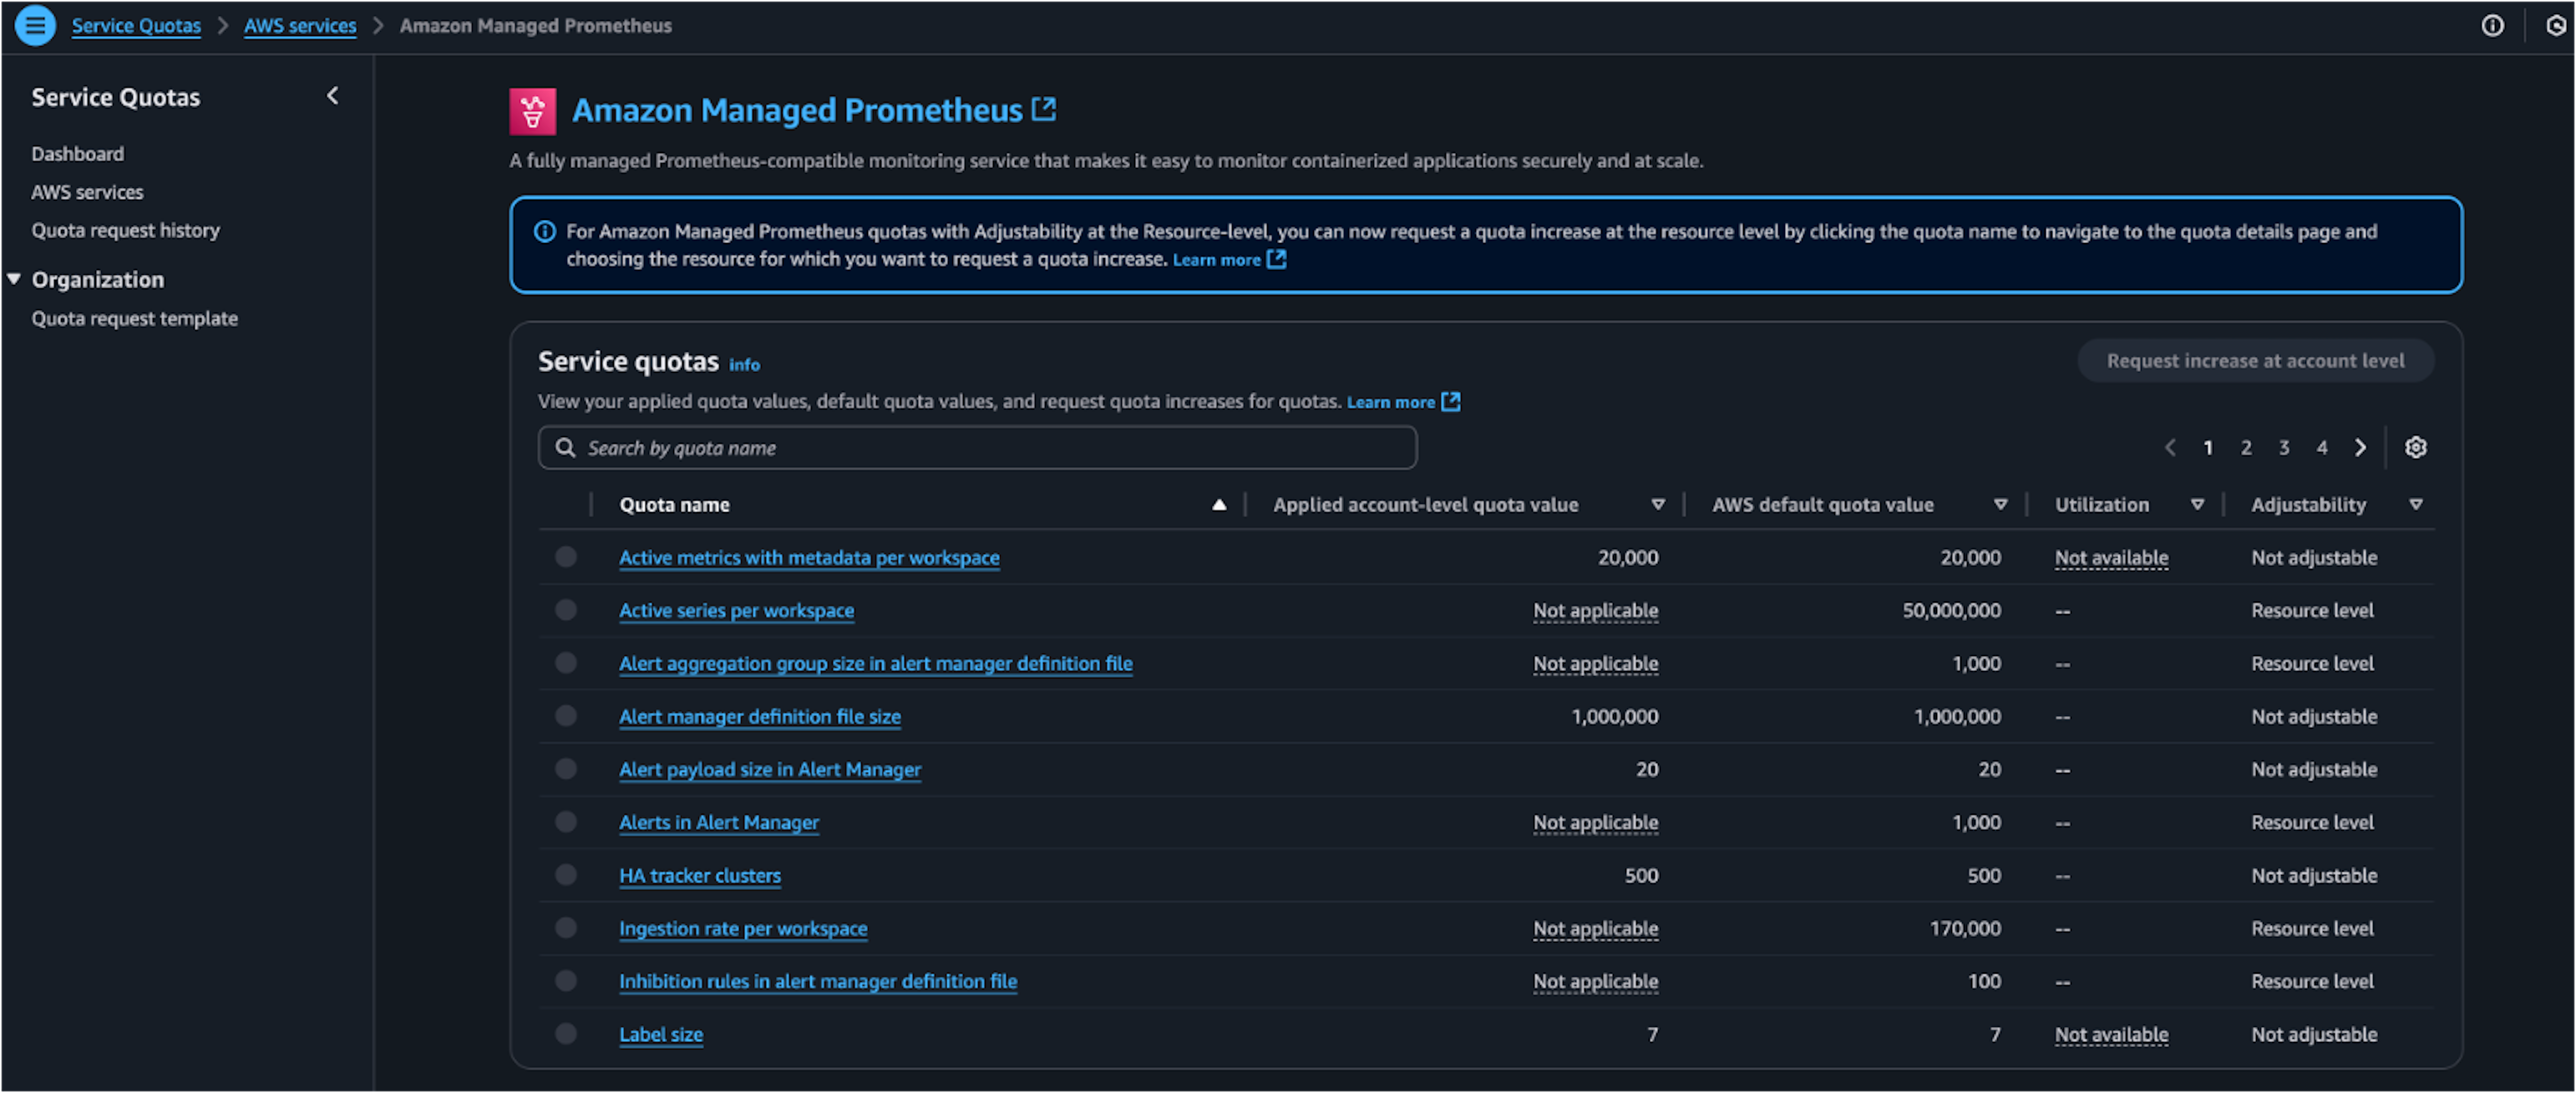 Figure 2: Amazon Managed Service for Prometheus service quotas using AWS Service Quotas
Below is an example showing the applied quotas and utilization of Amazon Managed Service for Prometheus resource ‘Active series per workspace’:
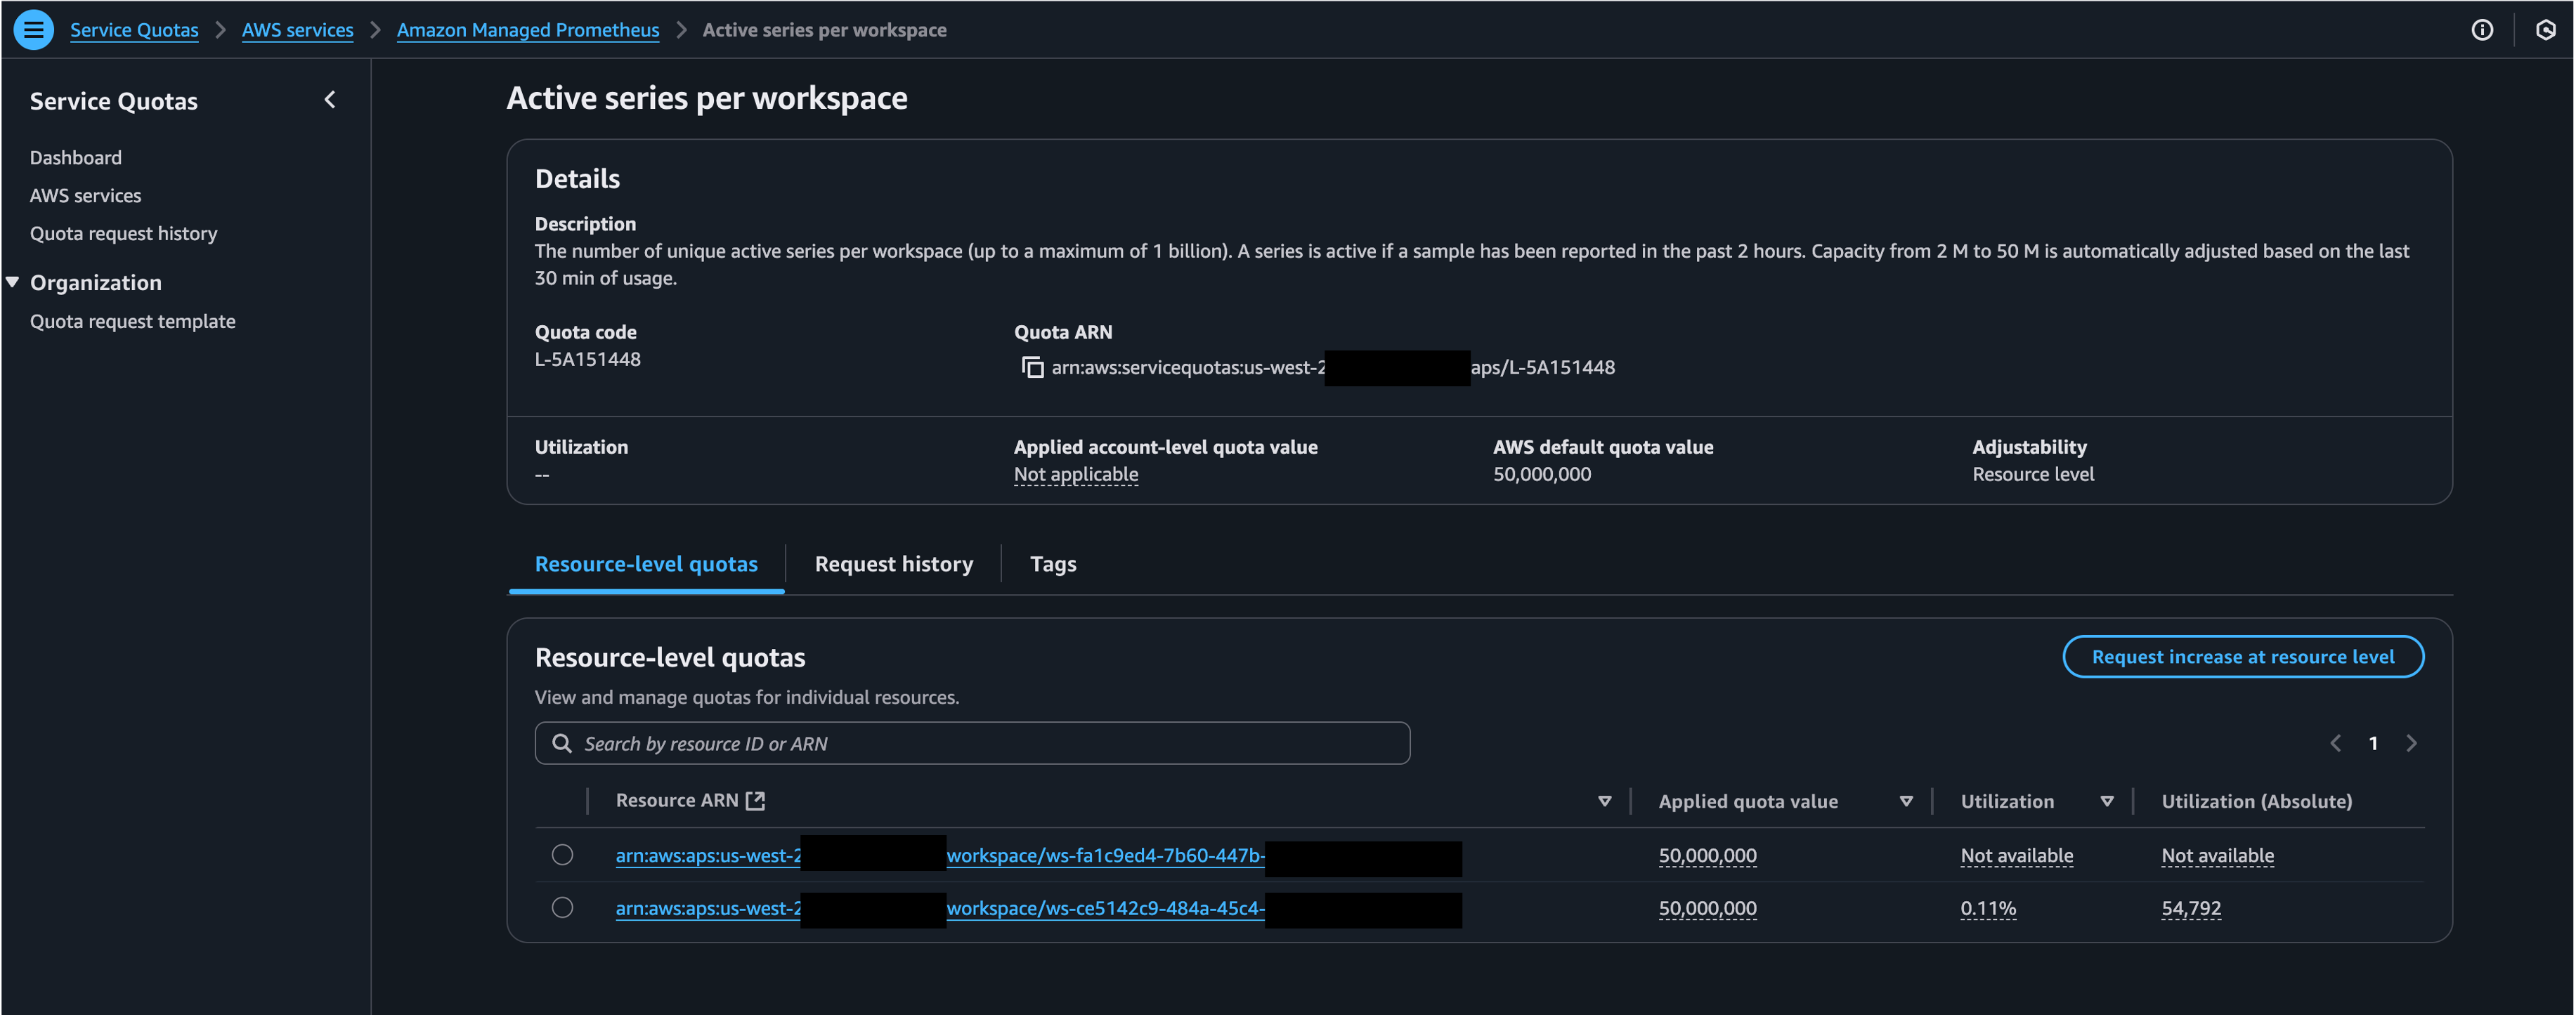
Figure 3: Quotas for Amazon Managed Service for Prometheus resource ‘Active series per workspace’ using AWS Service Quotas
With Amazon Managed Grafana, Example Corp can add CloudWatch as the data source to query, correlate and visualize metrics, logs and traces in a dashboard.
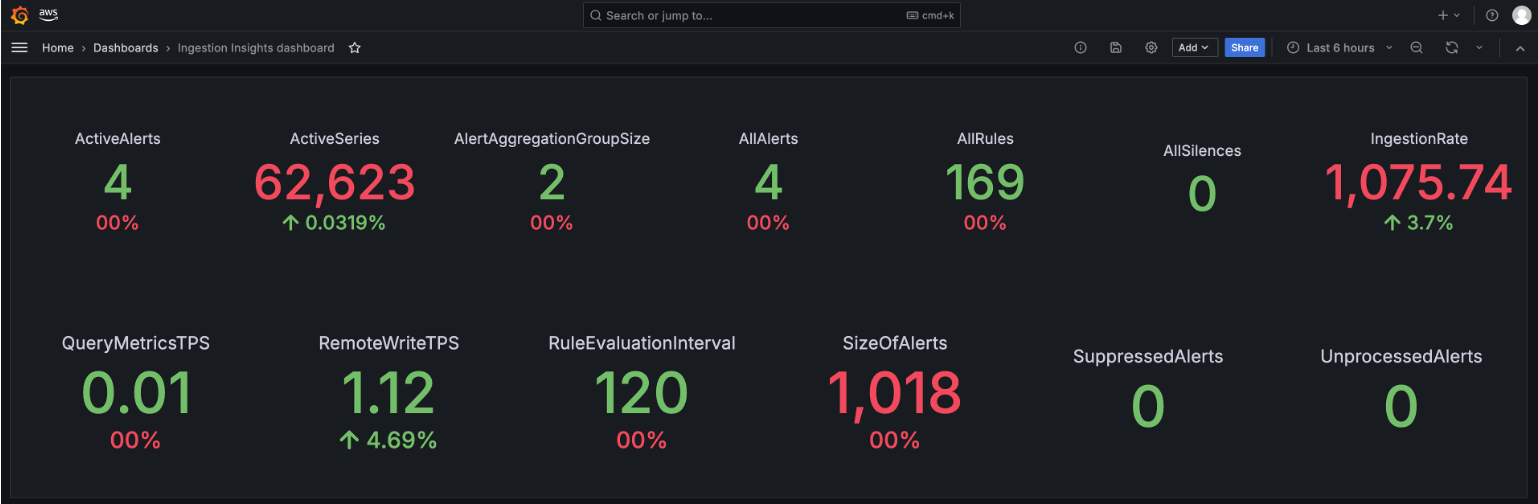 Figure 4: Amazon Managed Grafana dashboard to visualize Amazon Managed Service for Prometheus workspace resources utilization
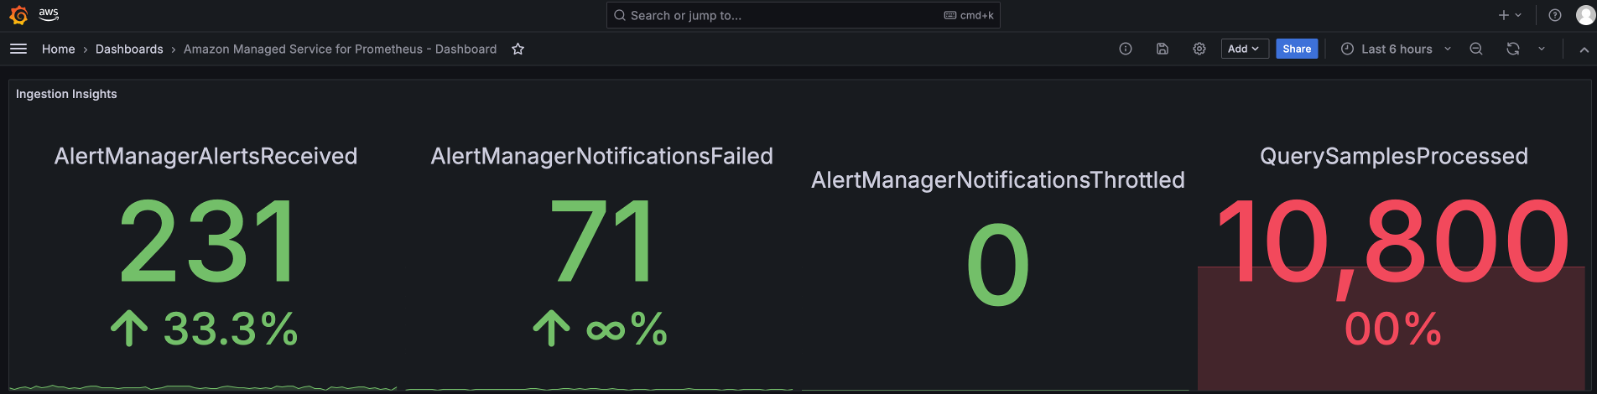
Figure 5: Insights into Amazon Managed Service for Prometheus ingestion using Amazon Managed Grafana dashboard
The DiscardedSamples metric is particularly crucial as it helps identify potential issues with your metric collection. Samples might be discarded for several reasons:
- Exceeding active series limits when applications generate more unique time series than your workspace can handle
- Reaching ingestion rate limits during traffic spikes or when multiple systems send large volumes of metrics simultaneously
- Receiving out-of-order samples or samples with timestamps outside the acceptable time window, often due to clock synchronization issues
By monitoring these metrics, Example Corp can effectively track performance, plan capacity, and manage costs across their Amazon Managed Service for Prometheus workspaces. This visibility becomes particularly important as the observability team needs to control the number of active series per label to optimize costs and maintain workspace performance. While monitoring provides insights into workspace usage, Example Corp needs more granular control over metric ingestion to ensure efficient resource utilization.
Label-based active series limits
Amazon Managed Service for Prometheus now supports label-based active series limits within workspaces. This feature enables Example Corp to manage active series volume by setting specific limits for different metric producers, whether they are applications, services, or teams sharing a workspace.
Using custom quotas based on labels, Example Corp can protect critical metrics from unexpected surges in workloads. This is particularly valuable in multi-tenant environments or when isolating metrics by application tier, as it helps maintain predictable resource consumption and cost-effectiveness.
The feature works by defining rules using key-value pairs. For example, Example Corp can set specific quotas for metrics with labels like {app=”payment-service”, environment=”prod”}. If a production payment service experiences a sudden metric spike due to a configuration error, only that specific label set’s metrics will be throttled, leaving other workloads unaffected.
This targeted approach delivers three key benefits:
- Minimizes operational risk by preventing noisy neighbors from overwhelming the workspace
- Enables teams to enforce fair usage policies without manual intervention
- Maintains high availability for mission-critical systems while optimizing costs
Configure label sets and limits
The Example Corp team can configure label sets limits with few simple steps using the AWS console:
- Open the Amazon Managed Service for Prometheus console.
- In the upper left corner of the page, choose the menu icon and then choose All workspaces.
- Choose the Workspace ID of the workspace.
- Choose the Workspace configurations tab.
- To add or modify label sets and their active series limits, choose Edit in the Label sets section. Then do the following:
- (Optional) Enter a value in Default bucket limit to set a limit on the maximum number of active time series that can be ingested in the workspace, counting only time series that don’t match any defined label set.
- To define a label set, enter an active time series limit for the new label set under Active series limit. Then, enter a label and value for one label that will be used in the label set, and choose Add label.
- (Optional) To define another label set, choose Add another label set and repeat the previous steps.
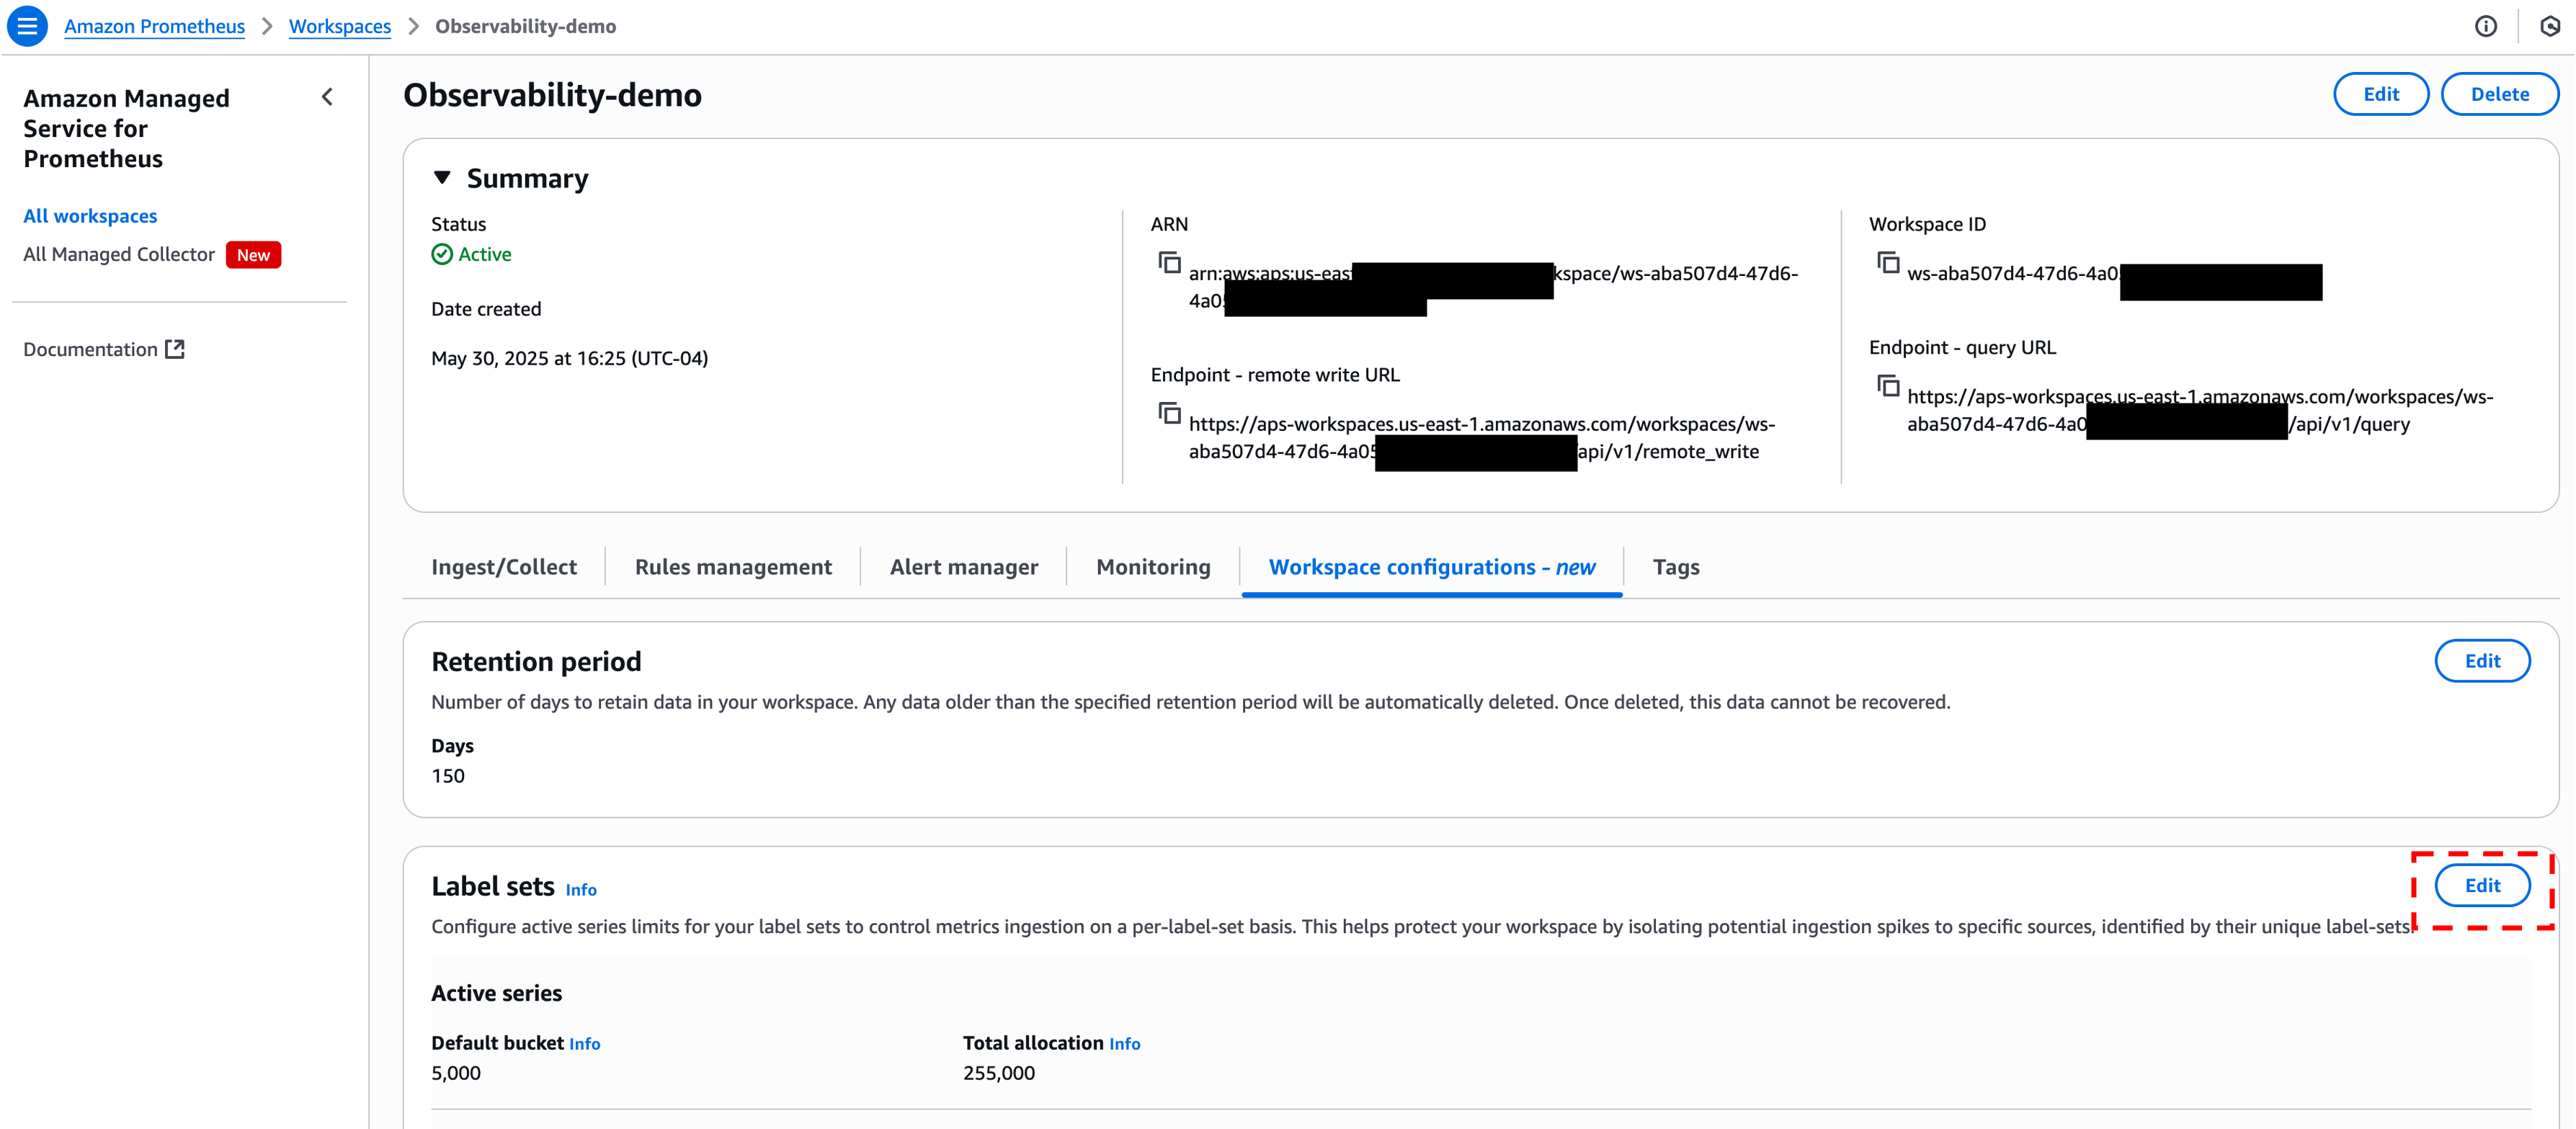
Figure 6: Modify Amazon Managed Service for Prometheus Workspace configurations
Alternatively, you can use the AWS CLI to configure the label sets limits and retention period as below:
Create a JSON file as below and replace with your appropriate values.
{
    "workspaceId": "<WORKSPACE_ID>",
    "limitsPerLabelSet": [
        {
            "limits": {
                "maxSeries":<ENTER_VALUE>
            },
            "labelSet": {
                "<KEY_NAME1>": "<KEY_VALUE1>",
                "<KEY_NAME2>": "<KEY_VALUE2>"
            }
        }
    ],
    "retentionPeriodInDays":<ENTER_VALUE>
}
aws amp update-workspace-configuration --workspace-id <WORKSPACE_ID> --cli-input-json file://"ENTER_NAME".json
Tip: Label sets let you group metrics by specific dimensions (like application, region or service), so choose labels that align with your organizational needs.
Once you’ve added all desired label sets and optional defaults, save your changes. Your workspace will now enforce these limits, helping you maintain better control over data ingestion.
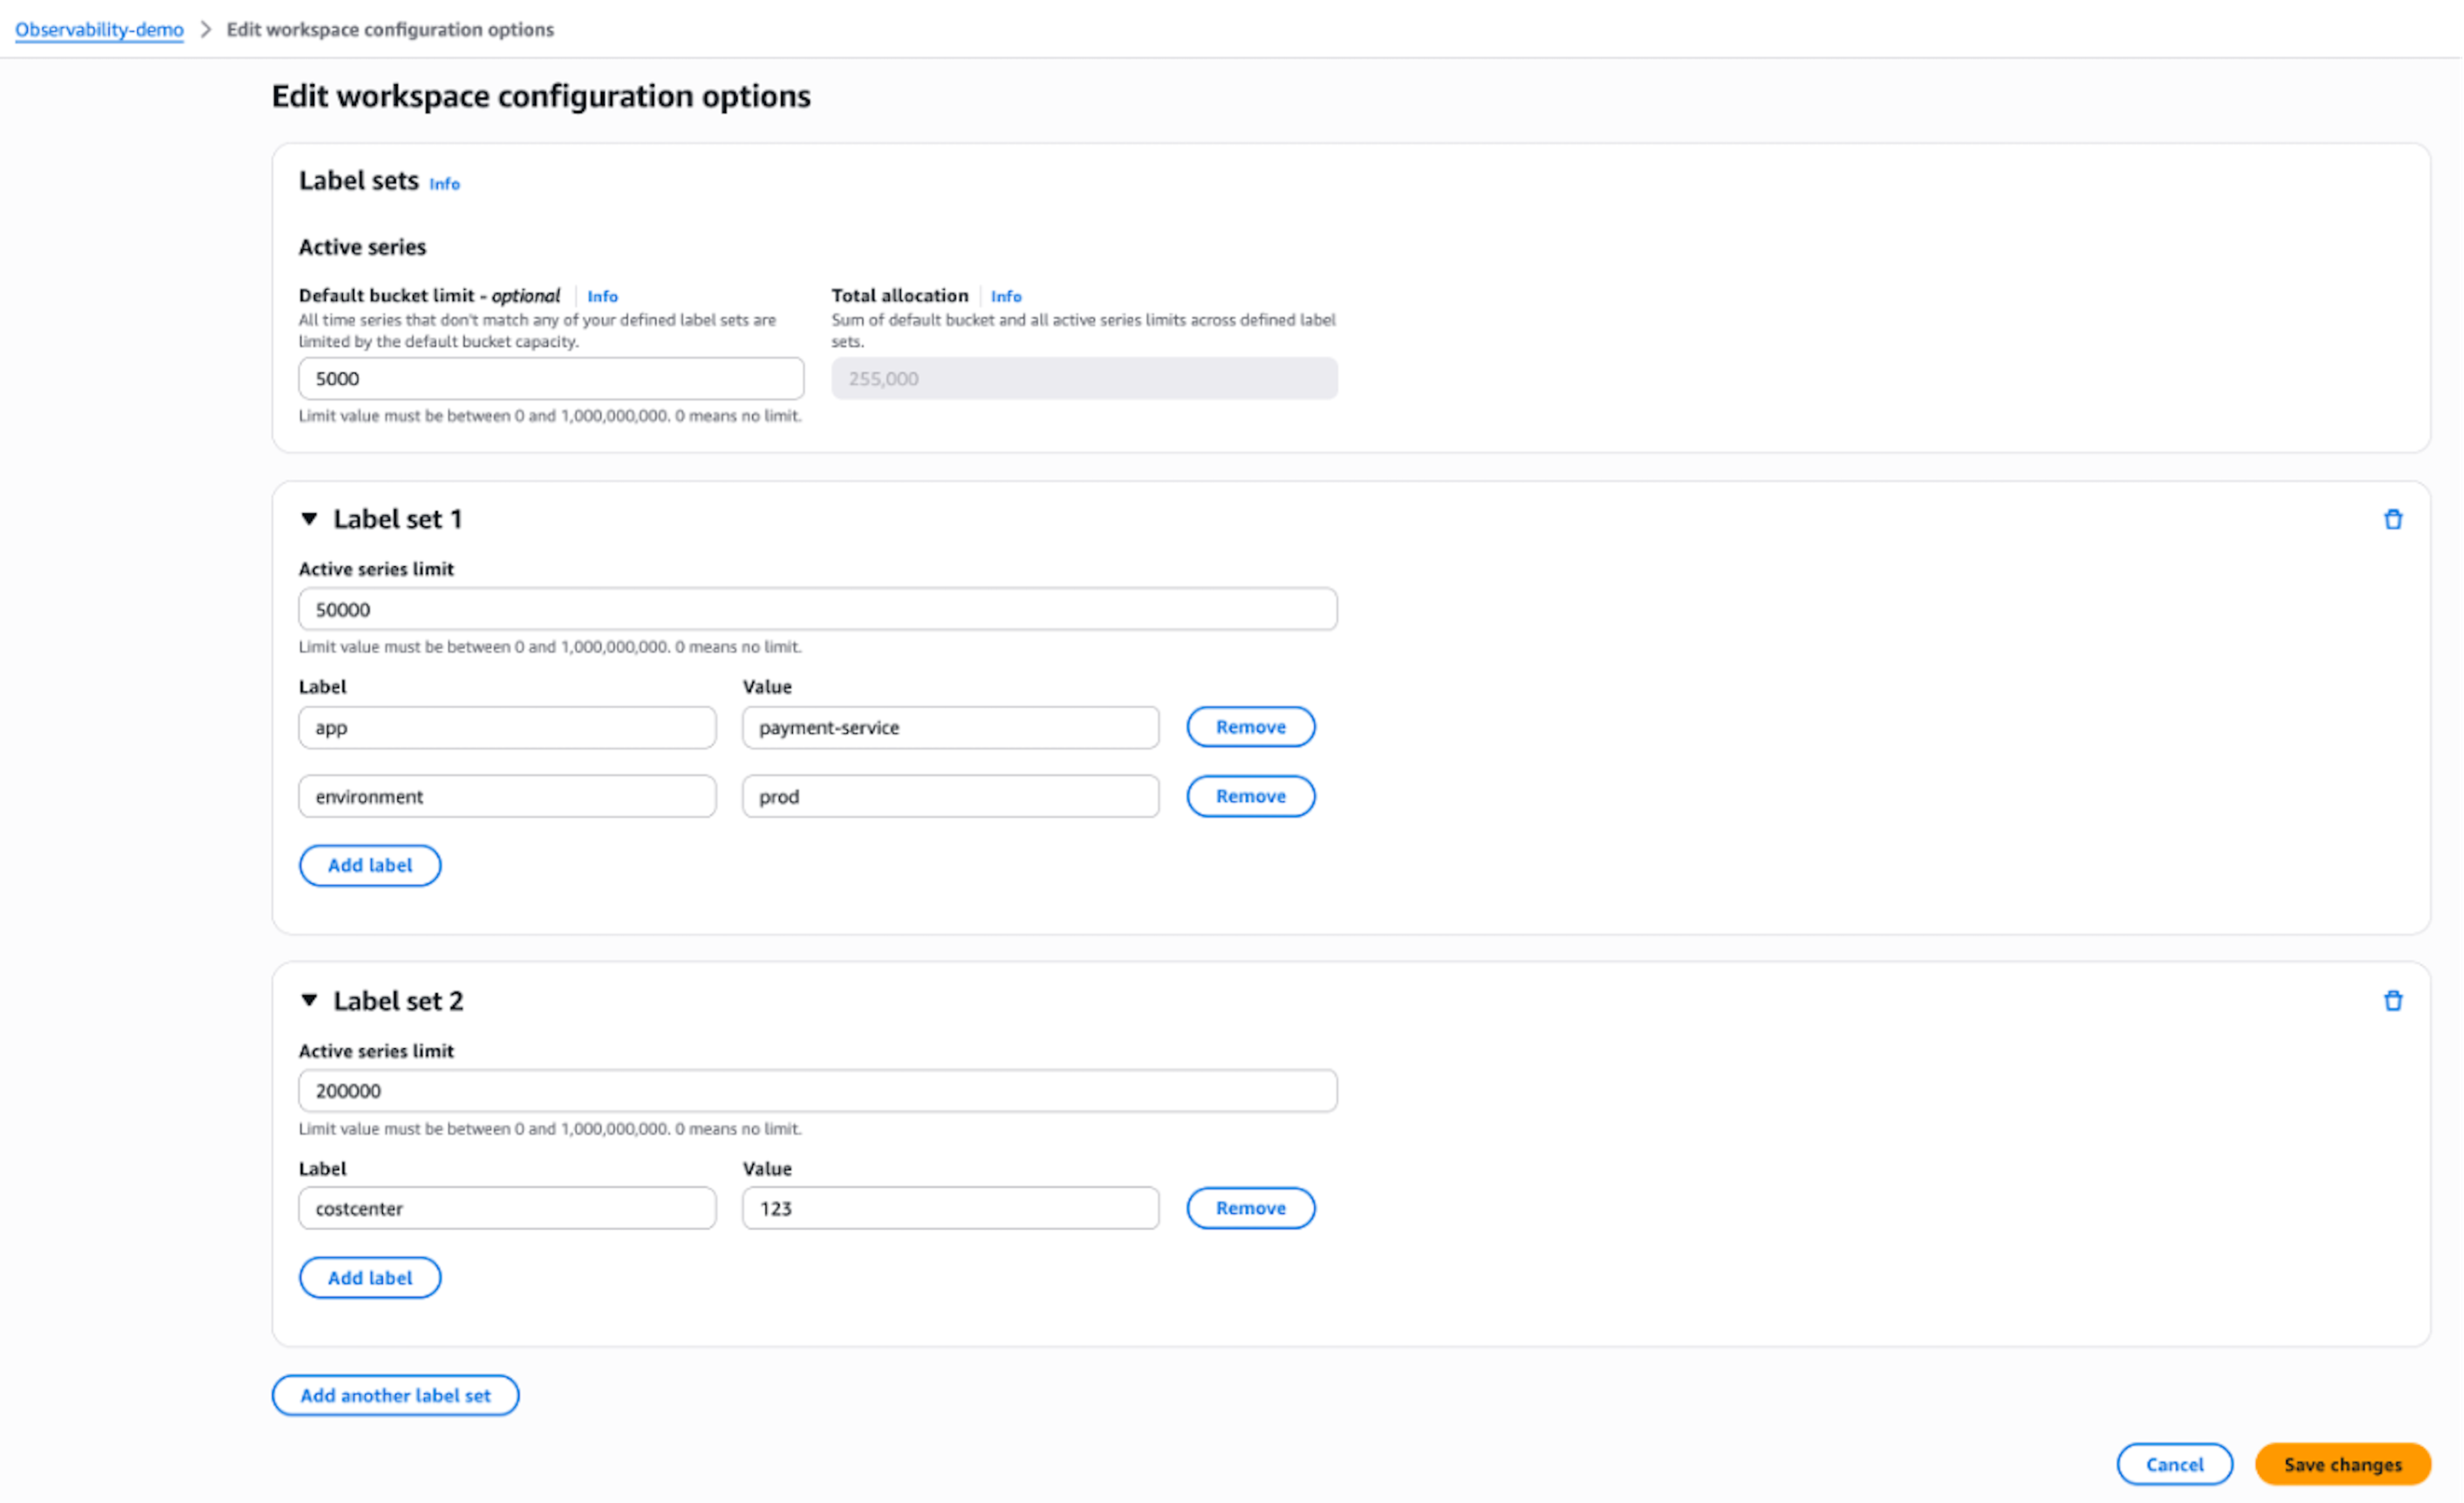
Figure 7: Configure label sets in Amazon Managed Service for Prometheus
Example Corp should also update the Scraper configuration to match the newly created/updated Label Sets. Follow below steps to update AWS Managed Collectors:
- In the left navigation, choose All Managed Collector
- Choose the ID of the Scraper
- Select Update
- Add the external_labels matching the above the Label Sets as per your needs
- When finished editing, select Update
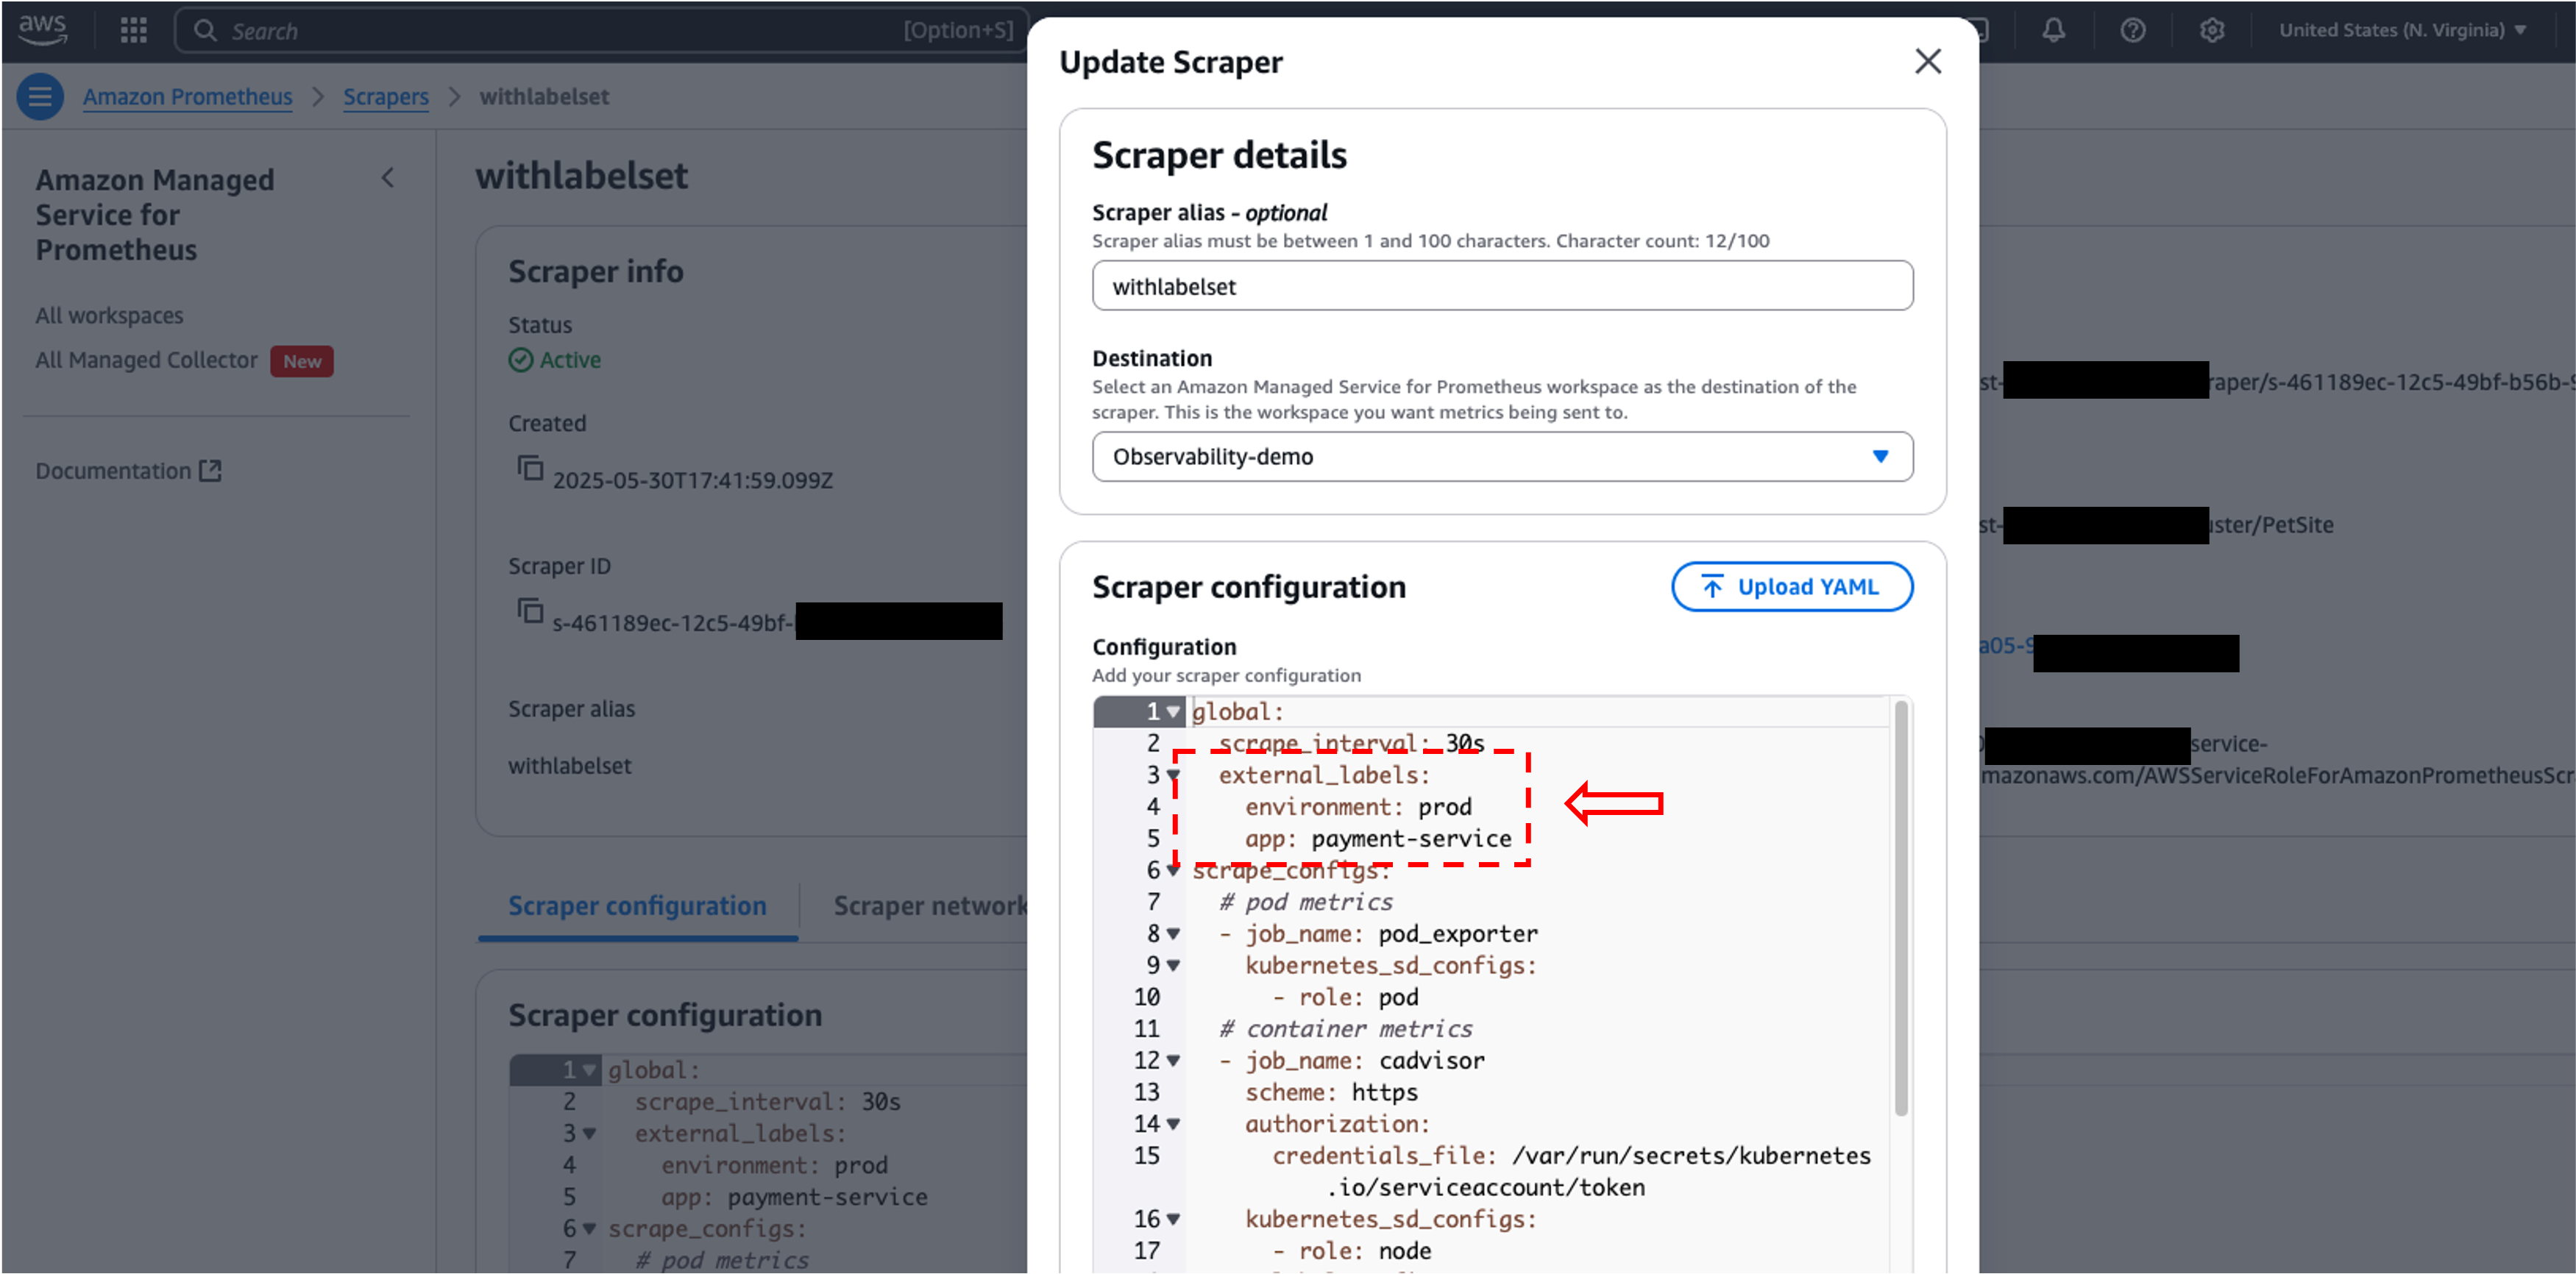
Figure 8: Update Scraper configuration in Amazon Managed Service for Prometheus
Alternatively, you can use the AWS CLI to update the scraper as below:
- Update the sample Scraper configuration with external labels matching the above label sets.
- Convert the yaml file to base64 format using any converters. As an example:
base64 -w 0 <SCRAPER>.yml - Copy the output from that command and paste it into the below command:
aws amp update-scraper --scraper-id <ENTER_VALUE> --scrape-configuration configurationBlob=<PASTE_SCRAPER_BLOB>
Understanding the Amazon CloudWatch Metrics for label sets limits
As announced earlier, there are four CloudWatch metrics under the AWS/Prometheus namespace to enhance visibility into your Amazon Managed Service for Prometheus workspace’s performance and resource usage. These metrics include:
- ActiveSeriesPerLabelSet: Tracks the current number of active time series for each user-defined label set, helping you monitor real-time usage against configured limits.
- ActiveSeriesLimitPerLabelSet: Shows the configured limit for active series per label set, enabling quick comparisons between actual usage and allowed thresholds.
- IngestionRatePerLabelSet: Measures the data ingestion rate (samples/sec) for each label set, useful for identifying high-volume metrics or potential bottlenecks.
- DiscardedSamplesPerLabelSet: Reveals how many samples were dropped due to exceeded limits, now with granular reasons: hitting a label set limit (per_labelset_series_limit), per-metric limit (per_metric_series_limit), or global user limit (per_user_series_limit).
- It’s important to note that these metrics will only be available if they have populated data points.
These metrics empower teams to proactively manage scalability, troubleshoot ingestion issues, and enforce cost controls. For example, spikes in DiscardedSamplesPerLabelSet with the per_labelset_series_limit reason signal a need to adjust label set limits, while tracking IngestionRatePerLabelSet helps optimize high-cardinality metrics. By correlating these metrics, Example Corp can gain actionable insights to balance performance, cost, and data retention, while ensuring critical metrics are prioritized, and infrastructure stays efficient.
Sample Dashboard
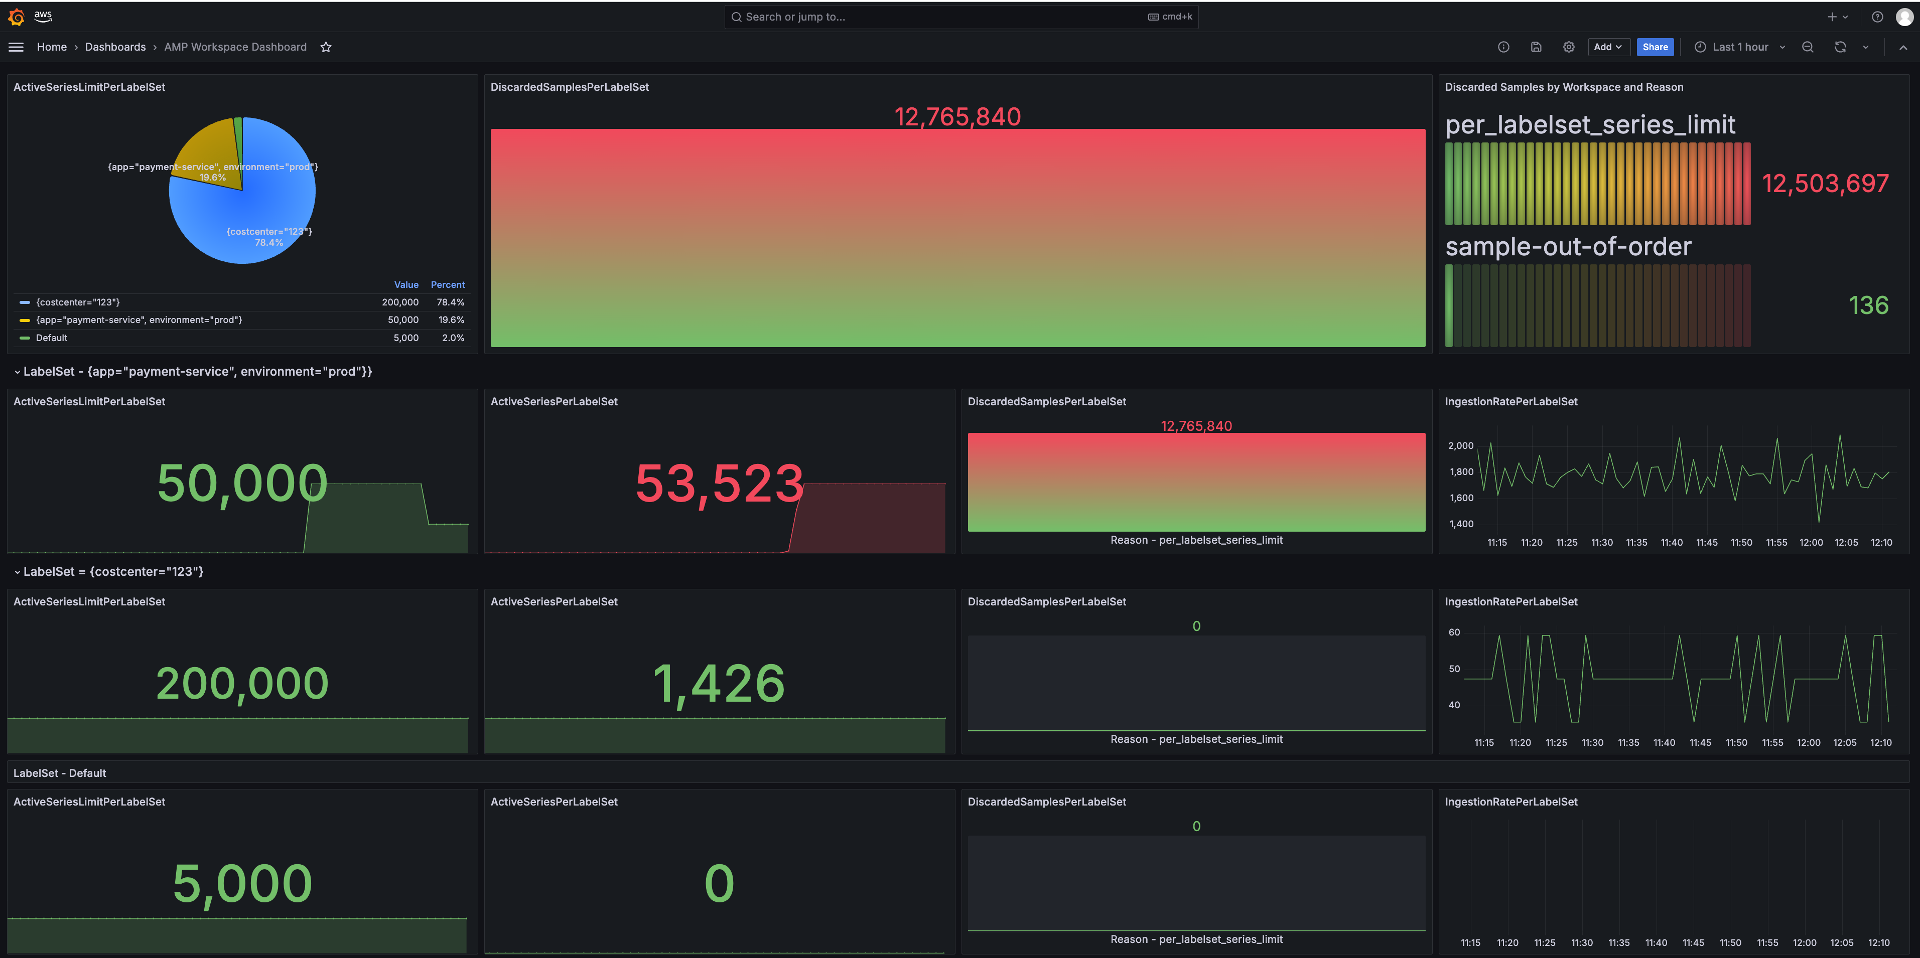
Figure 9: Visualize Amazon Managed Service for Prometheus Label Set based active series limits using Amazon Managed Grafana dashboard
You can now download this sample dashboard template from the AMP Workspace Dashboard and import it as a dashboard into your Amazon Managed Grafana. This dashboard also has the capabilities to visualize multi-account and multiple Amazon Managed Service for Prometheus workspaces use cases.
Sample queries used to build this dashboard:
Query 1 computes the average of the ActiveSeriesLimitPerLabelSet metric from the AWS/Prometheus namespace. It uses the schema () function to access metric data for the LabelSet and Workspace dimensions. The group by LabelSet clause segments the results to identify which LabelSets are consuming the most active series resources, helping in high-cardinality analysis.
SELECT AVG(ActiveSeriesLimitPerLabelSet) FROM SCHEMA("AWS/Prometheus", LabelSet,Workspace) GROUP BY LabelSet
Optionally, you could also use the Search expression as in the below query to get insights for all the label sets and their metrics across all the workspaces.
SEARCH('{AWS/Prometheus,LabelSet,Workspace}', 'Sum', 300)
Query 2 calculates the average number of DiscardSamplesPerLabelSet from the AWS/Prometheus namespace. It uses the schema () function to analyze data across the LabelSet, Reason, and Workspace dimensions. By grouping results by LabelSet, it identifies which label combinations are most frequently causing sample drops, helping diagnose issues like label churn or cardinality limits.
SELECT AVG(DiscardedSamplesPerLabelSet) FROM SCHEMA("AWS/Prometheus", LabelSet,Reason,Workspace) GROUP BY LabelSet
Query 3 computes the total of DiscardedSamples from the AWS/Prometheus namespace. It groups the results by the Reason dimension to categorize why samples were discarded. This helps identify root causes such as high cardinality, remote write rejections, or ingestion throttling affecting Prometheus data reliability.
SELECT SUM(DiscardedSamples) FROM "AWS/Prometheus" GROUP BY Reason
Query 4 calculates the average of ActiveSeriesPerLabelSet from the AWS/Prometheus namespace, scope to the LabelSet and Workspace dimensions. It filters the data to only include timeseries with the specific LabelSet. Replace LabelSet name as per your needs. This helps monitor the time series activity for a specific application, enabling targeted analysis of its metric cardinality and usage.
SELECT AVG(ActiveSeriesPerLabelSet) FROM SCHEMA("AWS/Prometheus", LabelSet,Workspace) WHERE LabelSet = '{app="payment-service", environment="prod"}'
Query 5 calculates the average of IngestionRatePerLabelSet. This helps assess the metric ingestion rate for a specific application to identify high-volume metric sources and potential ingestion bottlenecks.
SELECT AVG(IngestionRatePerLabelSet) FROM SCHEMA("AWS/Prometheus", LabelSet,Workspace) WHERE LabelSet = '{app="payment-service", environment="prod"}'
Query 6 calculates the total of ResourceCount from the AWS/Usage namespace for the ‘Prometheus’ service. It groups the results by the Resource dimension to break down usage across different Prometheus-related resource types. This helps monitor the overall Prometheus resource consumption for cost and capacity management.
SELECT SUM(ResourceCount) FROM "AWS/Usage" WHERE Service = 'Prometheus' GROUP BY Resource
Conclusion
In this blog, we explored how effectively managing metric ingestion at scale is critical for organizations like Example Corp, where uncontrolled data growth can lead to operational inefficiencies and escalating costs. We showed how Amazon Managed Service for Prometheus addresses these challenges with its new label-based active series limits, empowering teams to enforce granular controls over metric ingestion. By setting custom quotas tied to specific labels, organizations can proactively mitigate risks like noisy neighbor disruptions, ensure equitable resource allocation, and safeguard mission-critical systems from unexpected metric surges. We also demonstrated how these features not only enhance cost predictability by preventing resource overconsumption but also streamlines observability management in multi-tenant or tiered application architectures. With label-based throttling, teams maintain flexibility to isolate and prioritize workloads while sustaining high availability and operational resilience.
Check out the latest Amazon Managed Service for Prometheus announcement, Amazon Managed Service for Prometheus service quotas and Amazon Managed Service for Prometheus label-based active series limits. These updates give you a comprehensive view of health, performance, and quota utilization across your workspaces.
To learn more about AWS Observability, checkout the AWS Observability Best Practices Guide.
To get hands-on experience with AWS Observability services, check out the One Observability Workshop.