AWS Public Sector Blog
How artificial intelligence helps monitor forest dryness
Krishna Rao is an Earth scientist currently pursuing his Ph.D. in the Remote Sensing Ecohydrology Group at Stanford University. He works on developing technologies to measure forest health and understand its impacts on Earth processes across scales. The group studies how ecosystems and the carbon cycle respond to variations in water availability and how they will shift under future climate. Rao received an AWS Cloud Credit for Research grant, which enabled him to develop a forest dryness monitoring tool using remote sensing and deep learning.

A burned hill in the distance left behind by the Soberanes Fire. Big Sur, California, 2016. Image by author.
Forest wildfire risk is increasing in the western United States. In the past five decades, large wildfire frequency and the area destroyed have risen by more than four and six times, respectively. The increased risk posed by wildfires has prompted scientists to try to assess wildfire risk to help inform whether to move people to safety before disastrous wildfires occur. In this study, we used vast amounts of data with deep learning to produce dynamic forest dryness maps of the western US for the first time ever. These maps may eventually lead to improved wildfire risk assessments.
Wildfire risk and the role of forest dryness
In wildfire risk assessments, forest dryness—an important predictor of wildfire ignition and spread—is estimated using meteorological indicators such as prior precipitation and temperature. Researchers refer to forest dryness as live fuel moisture content because it indicates the amount of water in fuels, like trees and shrubs, relative to their dry biomass. Lower the live fuel moisture content, drier the fuels, greater the risk of wildfires, and vice-versa.
However, meteorological indicators do not always represent true forest dryness. Just like the plants on your balcony, different plants have unique strategies to respond to drought. Some might be able to conserve water by closing their stomata (pores on leaves) while others might not. Some might be able to gain more water by growing deeper roots, while others might not. However, mapping what species grow where and how each of them respond to water stress is difficult. Thus, fire models often ignore these effects. This may lead to incorrect estimations of forest dryness, ultimately introducing errors in our wildfire risk assessments. How can we do better?
When we saw the US Forest Service collecting thousands of forest dryness measurements across the western US, we saw an opportunity. Using those measurements, we directly estimated forest dryness using a neural network.
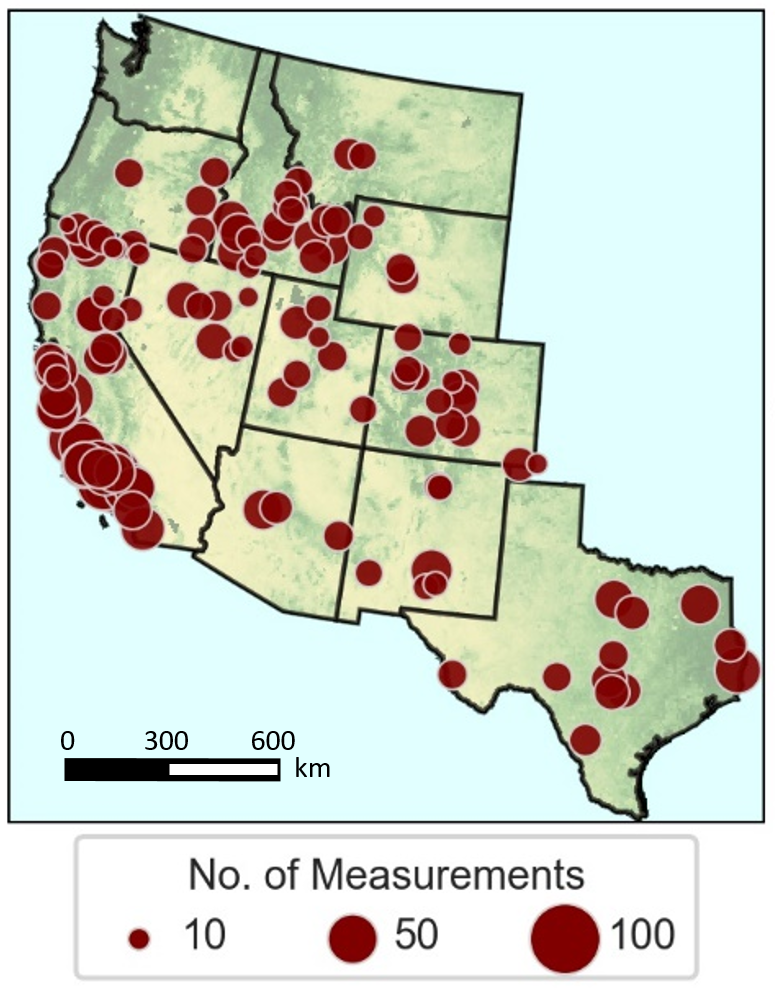
Forest dryness measurements conducted by the United States Forest Service between 2016-2019.
Forest dryness sensed from space
Although observing forest browning and greening is common, observing forest dryness (and wetness) is challenging because we cannot see the water inside the trees. While some models exist to estimate forest dryness, they fail to scale because they need to know the geometry of vegetation canopies. As a result, scientists have been able to estimate forest dryness of only 5-17 species of vegetation. By letting a neural network figure out the effects of canopy geometry using various remotely-sensed inputs, we were able to map forest dryness over the entire western US by validating 56 different species.
We used a four-layered neural network based on a long-short term memory (LSTM) model trained using Amazon Elastic Compute Cloud (Amazon EC2). We combined microwave backscatter from Sentinel-1 satellite and optical reflectance from Landsat-8 satellite (available on the Registry of Open Data on AWS) with variables related to canopy geometry, like canopy height and land cover. Several different versions of the model were trained at the same time on the p3.16xlarge instance using eight GPUs. This let us analyze feature importance by selectively training models on a subset of inputs. We could also perform cross-validation (out-of-sample testing) at a much faster pace. As a result, we were able to map forest dryness quickly and effectively.
On cross-validation, we found that our landscape-scale forest dryness mapping effort was as accurate as other smaller scale analyses. The vast amounts of ground-data available for model training, combined with the modifications performed to the LSTM model based on domain-knowledge yielded this result. Further, the availability of satellite data and large computational power on the cloud accelerated our model development. Check out more technical details of the model.
With dynamic, wall-to-wall maps of forest dryness now available, we plan to test the sensitivity of wildfire occurrence and size to forest dryness. In the process, we will quantify the value of these forest dryness maps for wildfire risk forecasting.
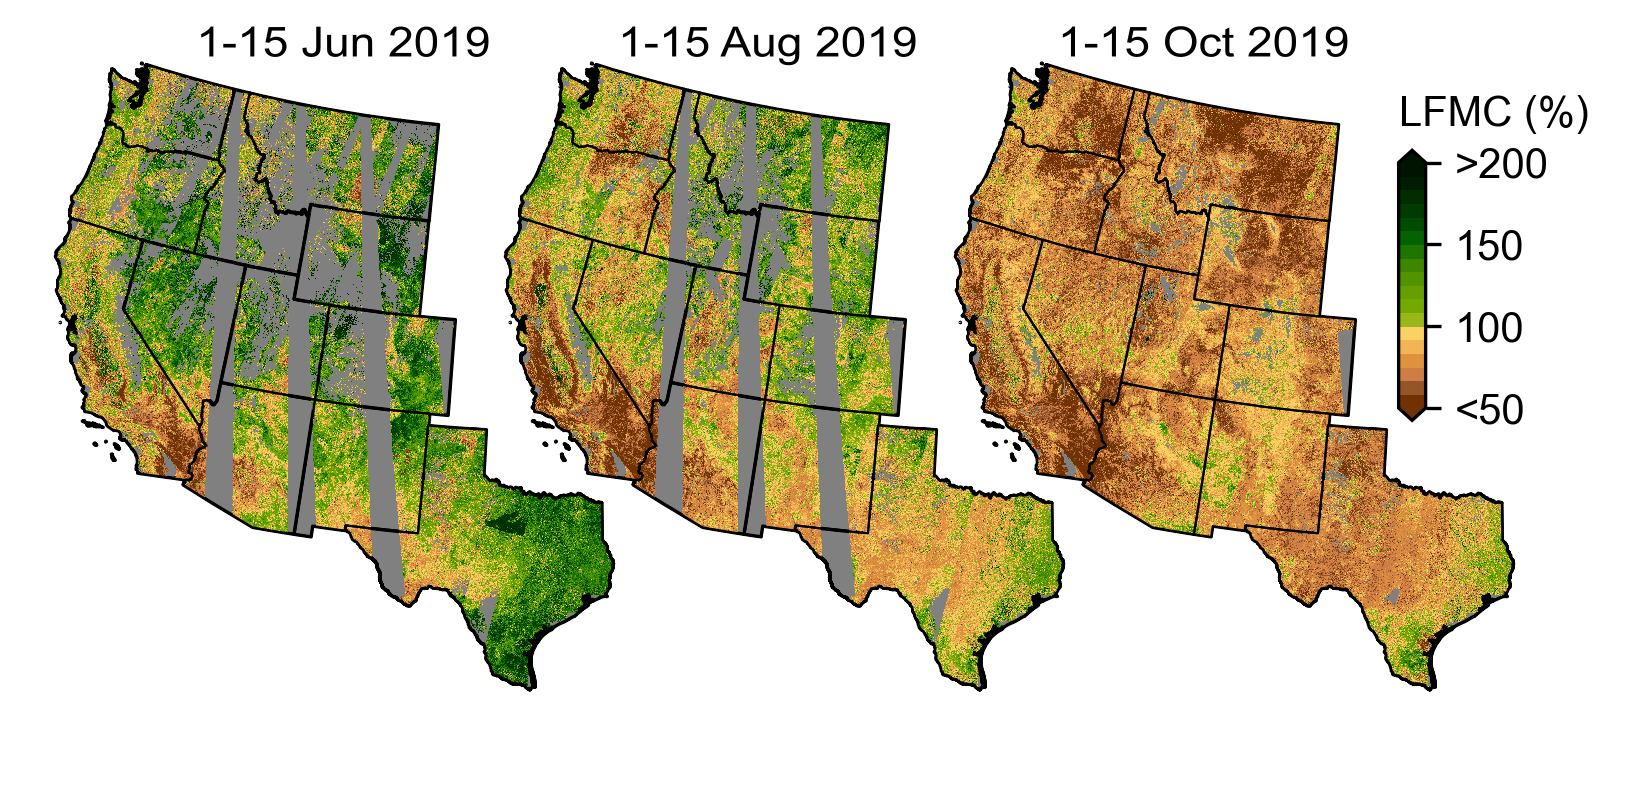
Forest dryness mapped using our LSTM model. Forest dryness is displayed as a percentage of water in trees relative to their dry biomass.
Explore the dynamics of forest dryness in your local neighborhood in the western US using the web app, and learn more about the AWS Cloud Credit for Research program.
The content and opinions in this post are those of the third-party author and AWS is not responsible for the content or accuracy of this post.