AWS Security Blog
Analyze AWS Network Firewall logs using Amazon OpenSearch dashboard
Amazon CloudWatch and Amazon OpenSearch Service have launched a new dashboard that simplifies the analysis of AWS Network Firewall logs. Previously, in our blog post How to analyze AWS Network Firewall logs using Amazon OpenSearch Service we demonstrated the required services and steps to create an OpenSearch dashboard. The new dashboard removes these extra steps and streamlines the entire process. In this post, I show you how to build and use the new OpenSearch Service dashboards to analyze Network Firewall logs more efficiently.
Network Firewall is a managed security service that protects Amazon Virtual Private Cloud (Amazon VPC) VPCs by monitoring and filtering network traffic. Network Firewall provides stateful inspection, which gives you information that you can use to create custom rules to control incoming and outgoing traffic. It automatically scales, offers high availability, and integrates with other AWS security services, in addition to helping to block unexpected traffic, prevent unauthorized access, and filter traffic based on domains and IP addresses.
Analyzing Network Firewall logs provides you with insight into the traffic entering or leaving your VPC and helps you troubleshoot issues and understand your security posture over time. This analysis is crucial for maintaining effective security controls.
Network Firewall generates three types of logs from its stateful engine:
- Flow logs: These capture standard network traffic flow information based on your stateless rules
- Alert logs: These show traffic that matches stateful rules configured with
DROP,ALERT, orREJECTactions - TLS logs: These provide details about TLS inspection events (requires TLS inspection configuration)
Prerequisites
This post assumes that you’re familiar with the fundamentals of AWS networking concepts and services such as Amazon VPC, subnets, routing tables, and other services such as Network Firewall, Amazon CloudWatch, and OpenSearch Service.
To analyze Network Firewall logs using OpenSearch Service, you must have:
- An active Network Firewall in your VPC
- CloudWatch log groups configured for:
- Flow logs, for example
/inspection-nwfw-flow-logs - Alert logs, for example
/inspection-nwfw-alert-logs
- Flow logs, for example
If you haven’t deployed Network Firewall in your VPC, you can use one of the available Network Firewall deployment architecture templates to create a firewall. After creating a firewall, configure CloudWatch log groups for the firewall flow and alert logs and configure stateful logging. Fine-tune your firewall policy and rule configuration and make sure that you’re routing traffic symmetrically through the firewall. Verify that your CloudWatch log groups are receiving firewall logs. You can do this by navigating to the AWS Management Console for CloudWatch, selecting your log group, and viewing the log streams under the Log streams tab.
With the firewall in the routed path and publishing metrics and log events, you can proceed with creating a Network Firewall OpenSearch dashboard.
Scenario
In this post, I show you how to set up a centralized architecture, single Availability Zone deployment as shown in Figure 1. Then, you will create an OpenSearch dashboard for your firewall to monitor and analyze traffic.
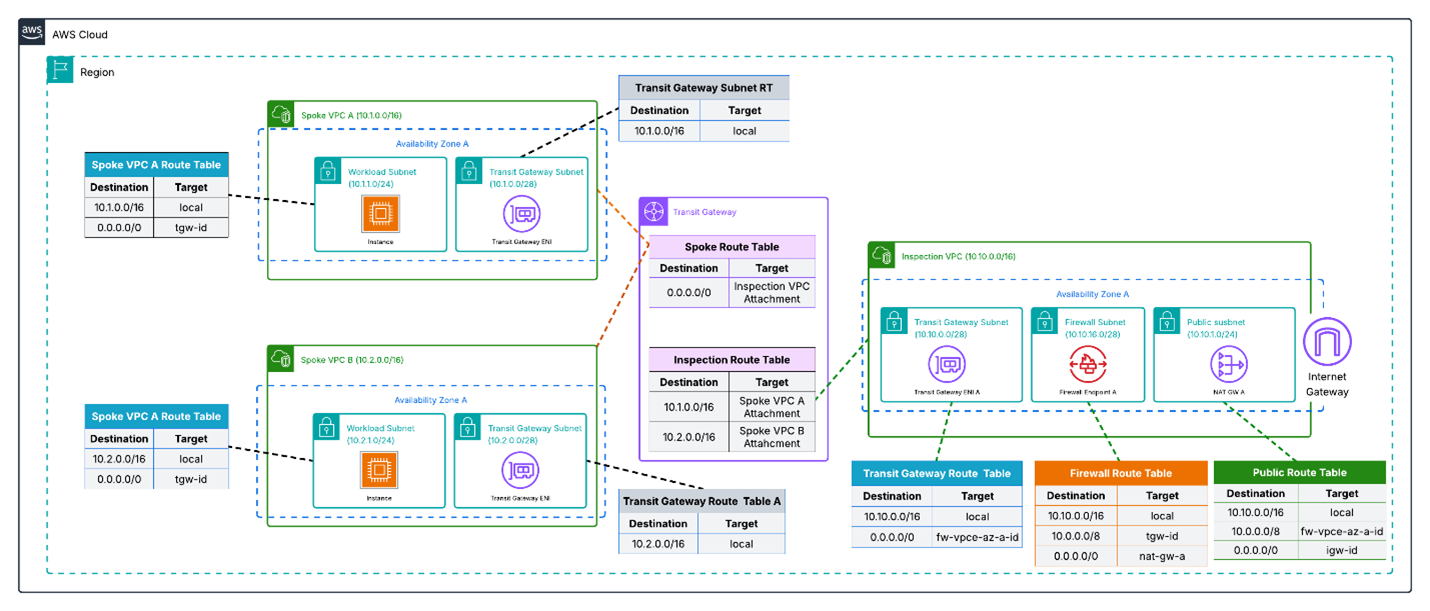
Figure 1: Network Firewall centralized architecture, single Availability Zone deployment
Solution deployment
To analyze Network Firewall logs in OpenSearch Service, you first need to create an OpenSearch integration.
To create an OpenSearch Service integration:
- Open the Amazon CloudWatch console.
- Choose Settings in the navigation pane.
- Choose the Logs tab.
- Scroll down to find OpenSearch integration and choose Create integration.
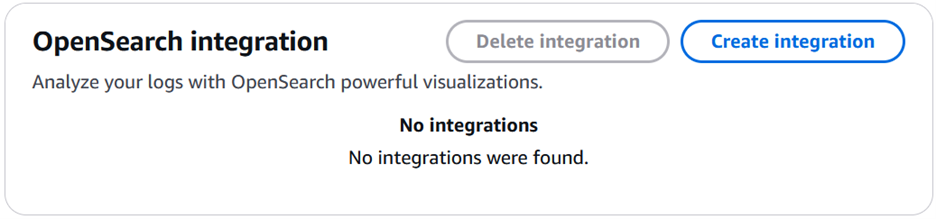
Figure 2: Create an OpenSearch integration
- There are three items to be configured under OpenSearch collection:
- Enter a name for Integration name. For example,
CW-AOS-Integration01. - KMS key ARN – optional is optional. If you leave that empty, your data will be encrypted by default with a key that AWS owns and manages. You also have an option to create and use an AWS Key Management Service (AWS KMS) key.
- For Data retention, select a number between 1 and 30 depending on your retention policy. For example, select 10 to retain logs for 10 days.
- Enter a name for Integration name. For example,
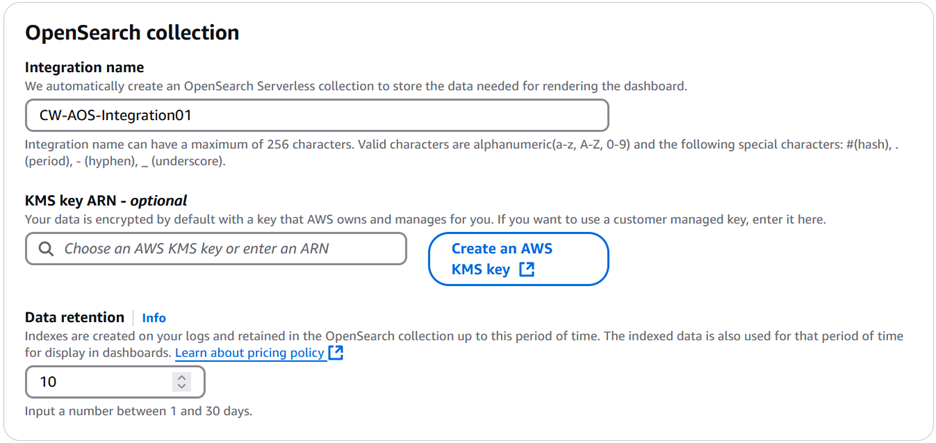
Figure 3: Configure an OpenSearch collection
- Next, you need to configure AWS Identity and Access Management (IAM) permissions.
- For the IAM role for writing to OpenSearch collection, you can either create a new role or use an existing role. If you choose Create new role, then you need to provide an IAM role name. For example,
CWLogQueryOS. This role must have permissions to read from all log groups in the account. See Permissions that the integration needs for an example of the permission that the integration needs. - IAM roles and users who can view dashboards defines who can view the dashboards. Select either:
- Allow all roles and users in this account to view dashboards.
- Specify roles and users who can view dashboards. By choosing Specify roles…, you can select the IAM roles and users who can view the dashboard.
- Choose Confirm integration setup to create the integration. It might take 1–5 minutes for the integration to be created.
- For the IAM role for writing to OpenSearch collection, you can either create a new role or use an existing role. If you choose Create new role, then you need to provide an IAM role name. For example,
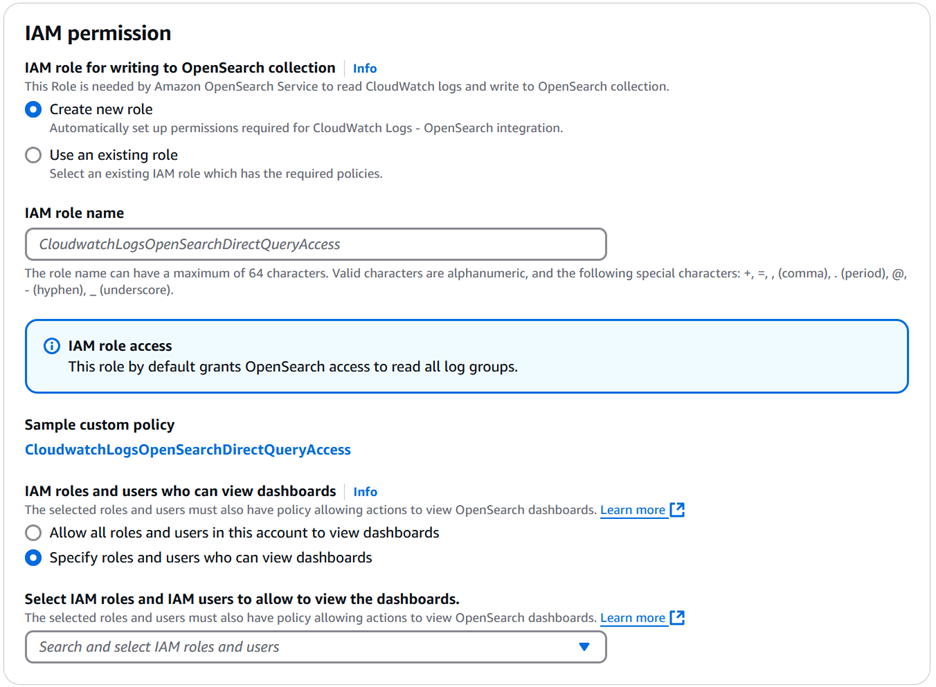
Figure 4: Configure IAM permissions
After you receive notification of successful creation of the OpenSearch integration, you can create an OpenSearch dashboard.
To create an OpenSearch dashboard:
- Navigate to Amazon CloudWatch console and choose Logs insights in the navigation pane.
- In Logs Insights, choose the Analyze with OpenSearch tab.
- Choose Create dashboard.
- Under Select dashboard type, select AWS Network Firewall.
- Enter a name for the dashboard, such as
InspectionFirewall.
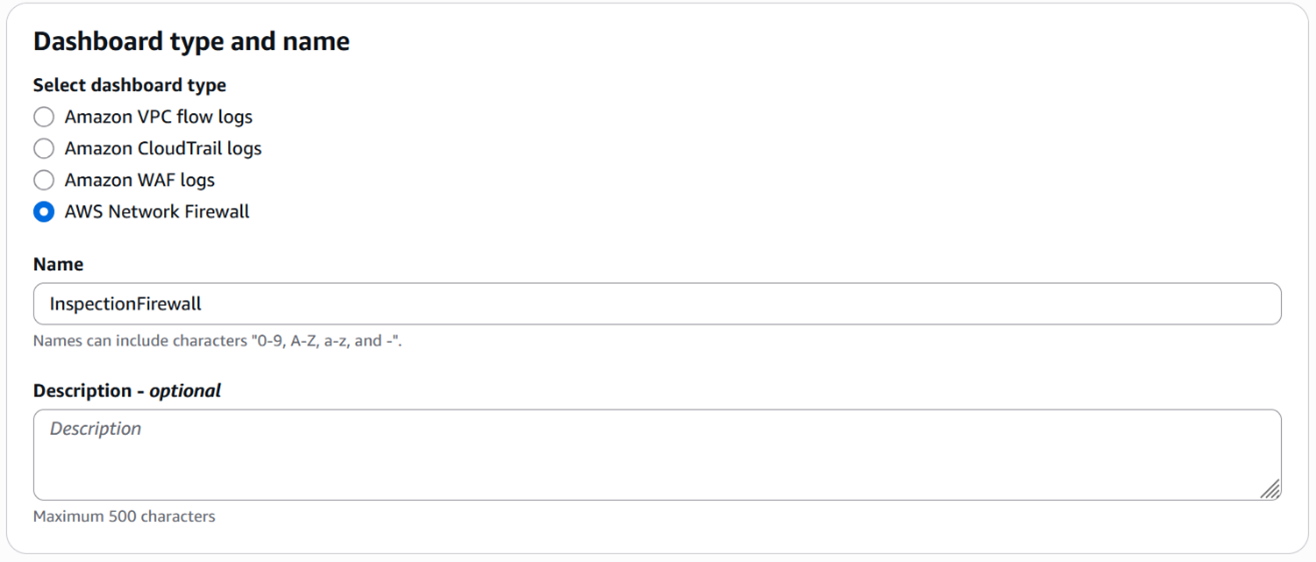
Figure 5: Select the dashboard type and enter a name
- Under Dashboard data configuration, select Every 5 minutes.
- Under Select log groups, select Inspection-nwfw-alert-logs and Inspection-nwfw-flow-logs.
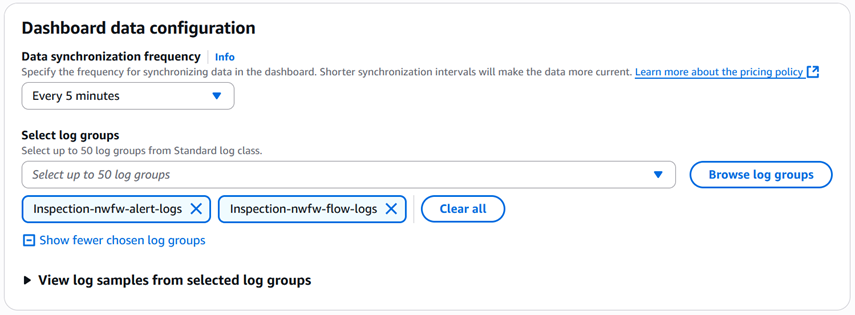
Figure 6: Select data synchronization frequency and log groups
- Choose Create dashboard. If you have multiple firewalls in your environment, repeat steps 1–8 to create a dashboard for each Firewall.
- Choose Select a dashboard and select and select a dashboard to view.
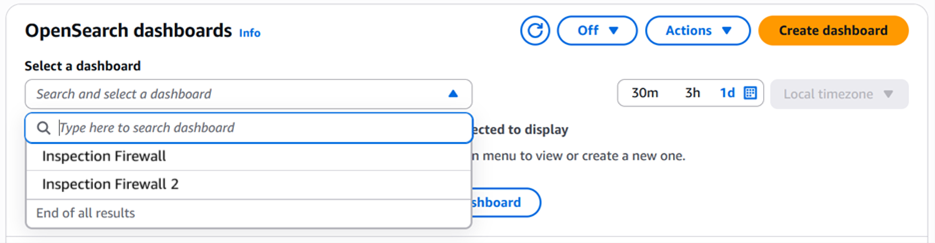
Figure 7: View a list of existing firewalls in OpenSearch dashboards
Dashboard overview
Your new OpenSearch dashboard, similar to Figure 8, provides you with visual insight into some of your firewall events such as:
- Top talkers
- Top protocols
- Alert log analysis
- Firewall engines
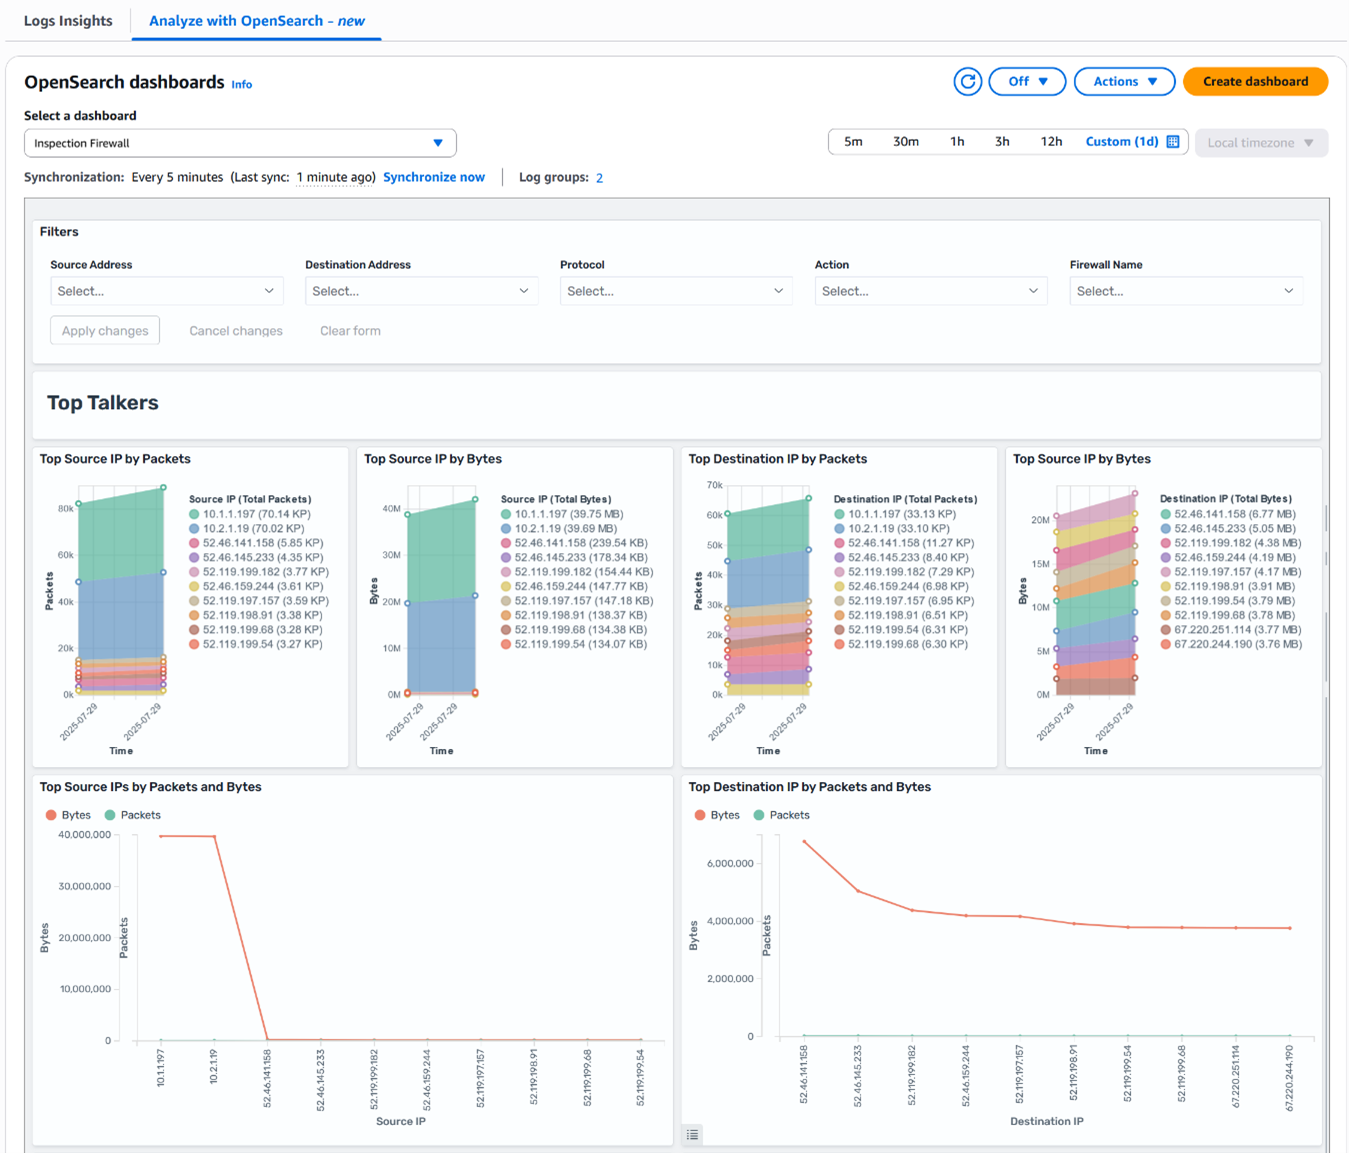
Figure 8: Network Firewall OpenSearch dashboard
As shown in Figure 9, you can refine your analysis to focus on a specific traffic pattern or security event by using the filters at the top of the dashboard to focus on traffic based on:
- Source or destination addresses
- Protocols
- Actions
- Firewall names
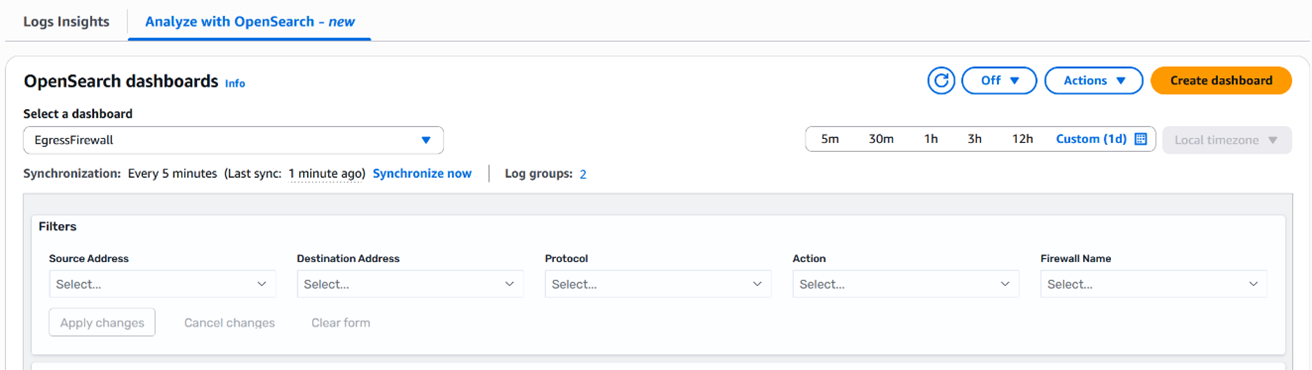
Figure 9: Network Firewall OpenSearch dashboard filters
To dive deep into a widget:
- Hover your cursor over a widget in the dashboard to reveal the options menu icon (…) in the top right corner of the widget.
- Choose the options menu icon (…) to maximize the widget or open the Inspect view, as shown in Figure 10.
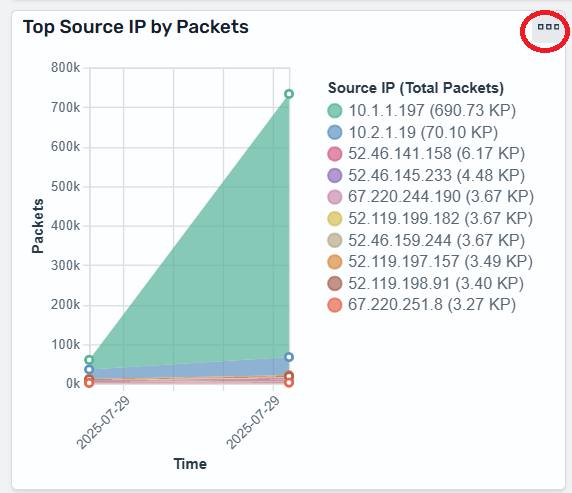
Figure 10: Top Source IP by Packets widget showing the options menu icon (…)
Figure 11 shows the Inspect window for the Top Source IP by Packets widget. In this window, you can get information by selecting Statistics, Request, or Response.
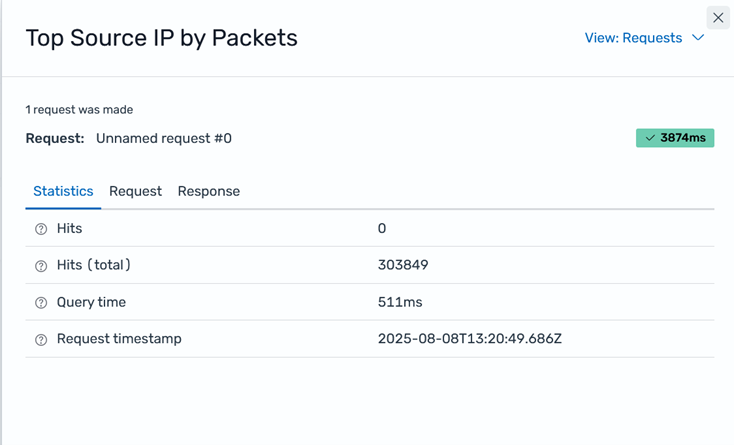
Figure 11: Inspect window for Top Source IP by Packets widget
This window might look different depending on the widget you choose. Some widget options menus provide more information than others and include an option to download the information in CSV format. For example, you can use the Top Source IPs by Packets and Bytes widget to view data and download it in CSV format, as shown in Figure 12.
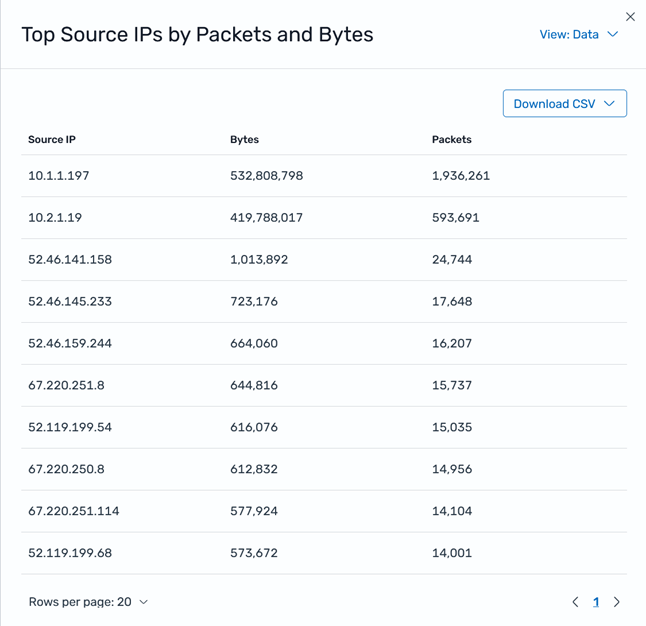
Figure 12: Inspect window for Top Source IPs by Packets and Bytes widget
When using the Top Source IPs by Packets and Bytes, you can use the View menu to switch the view from Data to Requests to access more information, as shown in Figure 13.
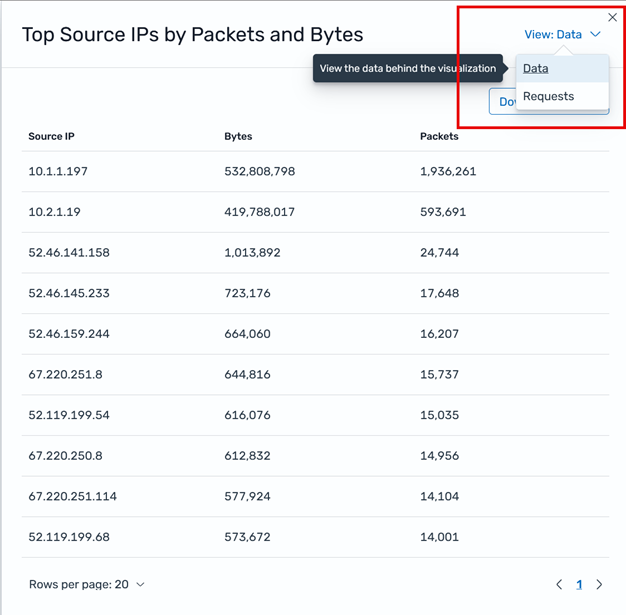
Figure 13: Switch the Inspect window view for Top Source IPs by Packets and Bytes widgets between Data and Requests
Example use cases
The following are some examples of how you can use the Network Firewall OpenSearch dashboard to facilitate monitoring and troubleshooting:
- Identify unusual traffic patterns:
- Use the Top Source IPs by Packets and Bytes widget
- Look for unexpected spikes or outliers
- Monitor security rule effectiveness:
- Analyze the Alert Log Analysis section
- Track which rules are triggering most frequently
- Troubleshoot connectivity issues:
- Use filters to isolate traffic for specific IP ranges
- Examine flow logs for blocked connections
- Verify compliance:
- Review TLS logs to verify encryption standards
- Use filters to focus on traffic to and from sensitive resources
Cost considerations
You will incur charges for AWS Network Firewall and the OpenSearch services used. For more information, see AWS Network Firewall Pricing and Amazon CloudWatch Pricing.
Conclusion
By building Amazon OpenSearch Service dashboards for AWS Network Firewall logs to transform complex security data into actionable insights, you can monitor and analyze your network security posture more effectively. By combining the robust security features of Network Firewall with the powerful visualization capabilities offered by OpenSearch Service, you gain real-time visibility into network traffic patterns, can quickly identify potential security threats, and streamline your troubleshooting workflows. This solution reduces the mean time to detect security incidents and improves operational efficiency through visual analytics to support data-driven decision making. Whether you’re focusing on threat detection, compliance monitoring, or security optimization, these dashboards can provide the visibility and insights needed to strengthen your overall security posture.
If you have feedback about this post, submit comments in the Comments section below. If you have questions about this post, contact AWS Support.