Networking & Content Delivery
How to analyze AWS Network Firewall logs using Amazon OpenSearch Service – Part 2
In part 1 of this blog-post series, we walked you through steps to configure Amazon OpenSearch Service to receive logs from AWS Network Firewall using Amazon Kinesis Data Firehose. In this part 2, we cover steps to generate test alerts, validating them and configure dashboards in Amazon OpenSearch Service to visualize and analyze log data.
Generate test alerts
- To generate Network Firewall alert logs, use testmynids.org which provides testing for the detection of malicious events by network intrusion detection systems (NIDS) with test files and scripts that simulate test NIDS activities.
- Connect to the Web server EC2 instance created as part of the CloudFormation stack using Session Manager. To do this, go to the EC2 Instances Console, select Web server instance, and select Connect.

Figure 01 – EC2 instance connection
- Then, choose Session Manager and select Connect. This will open a browser tab with terminal access to the Web server.
- Run the following commands
-
sudo yum install -y nc # installing ncat<br /> curl -sSL https://raw.githubusercontent.com/3CORESec/testmynids.org/master/tmNIDS -o /tmp/tmNIDS && chmod +x /tmp/tmNIDS && /tmp/tmNIDS -h<br />/tmp/tmNIDS -99
-
Validation
- While this command is running, go to Network Firewall, select Network Firewall → Monitoring, and check Stateful Received Packets, Passed Packets, and Dropped Packets.
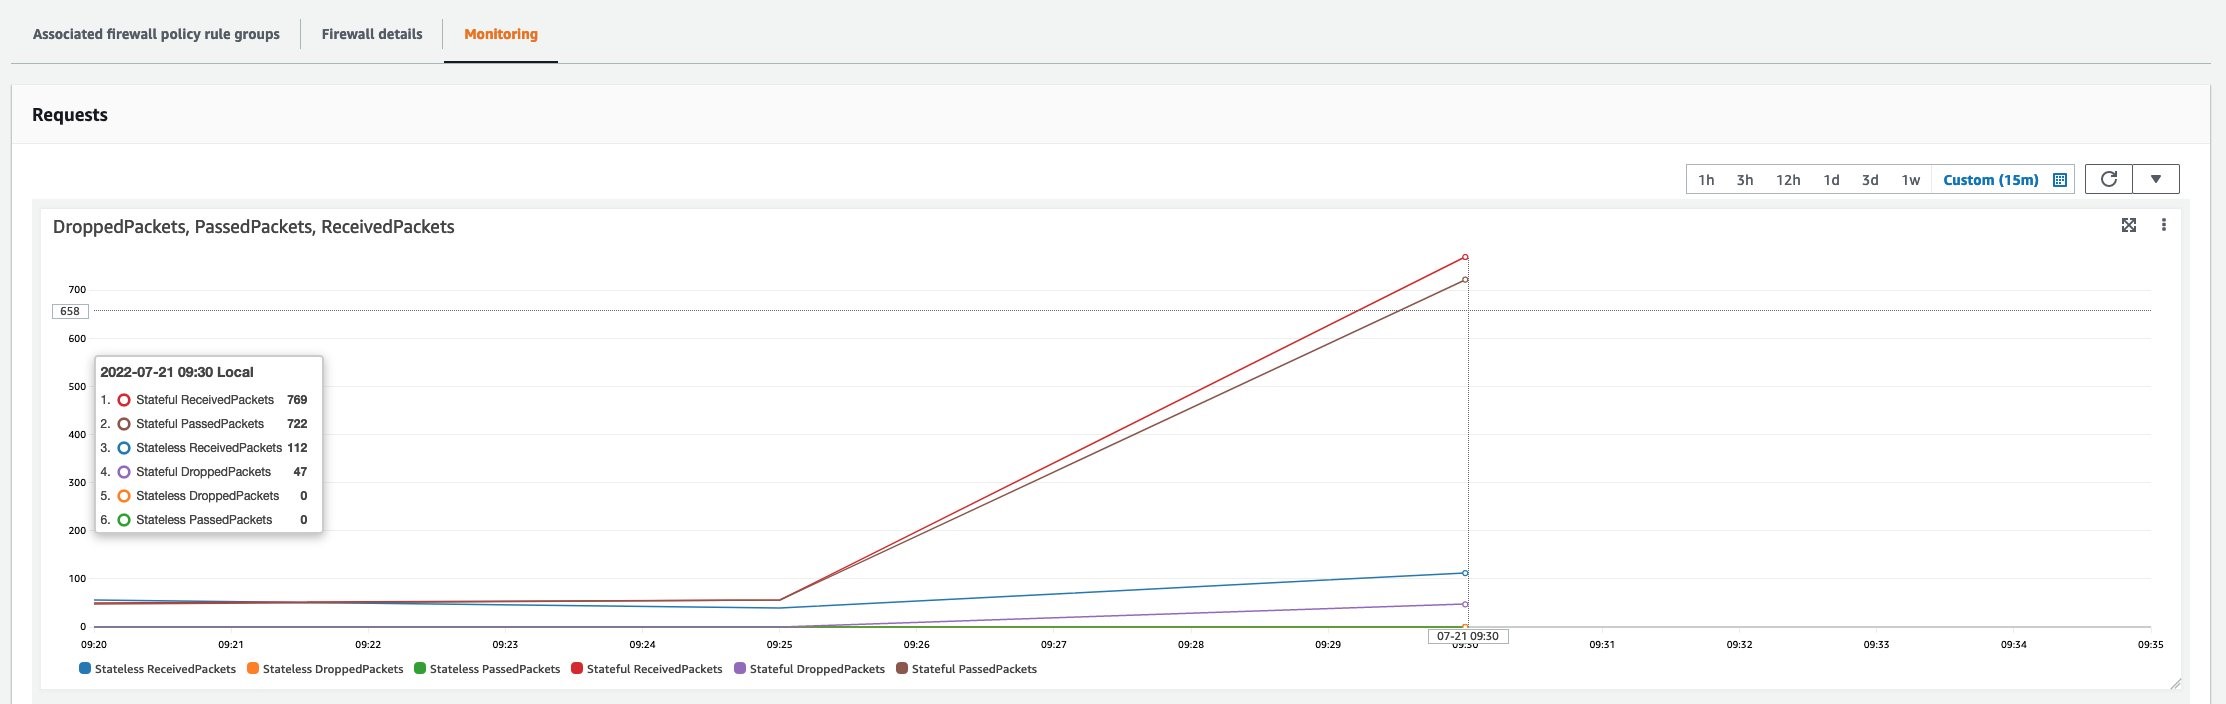
Figure 02 – Monitoring in AWS Network Firewall
- Moreover, look at the Monitoring of Kinesis Data Firehose delivery stream by navigating to Amazon Kinesis delivery streams → select required delivery stream → Monitoring.

Figure 03 – Monitoring in Kinesis Data Firehose
- As a last step, confirm data reception to the required index at Amazon OpenSearch Dashboard → Discover.
Figure 04 – Amazon OpenSearch index configuration
- There will be a prompt to create an index pattern.
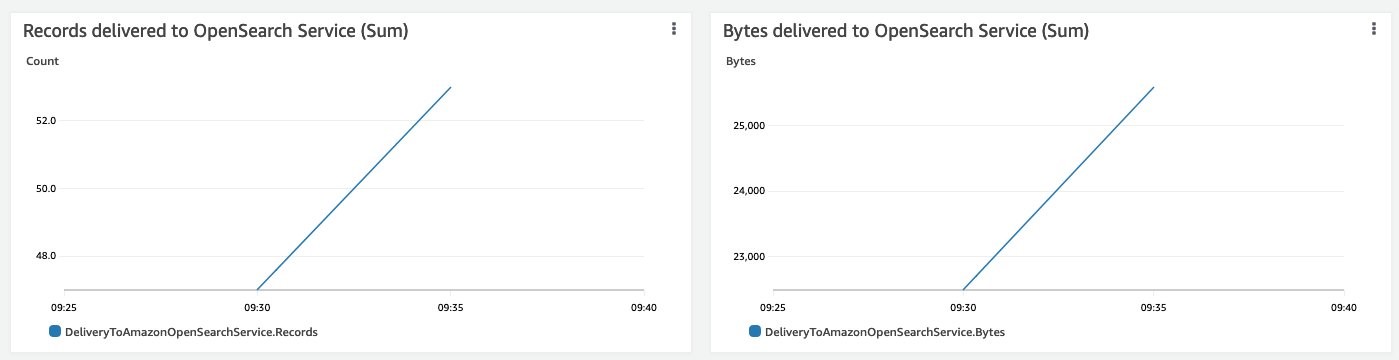
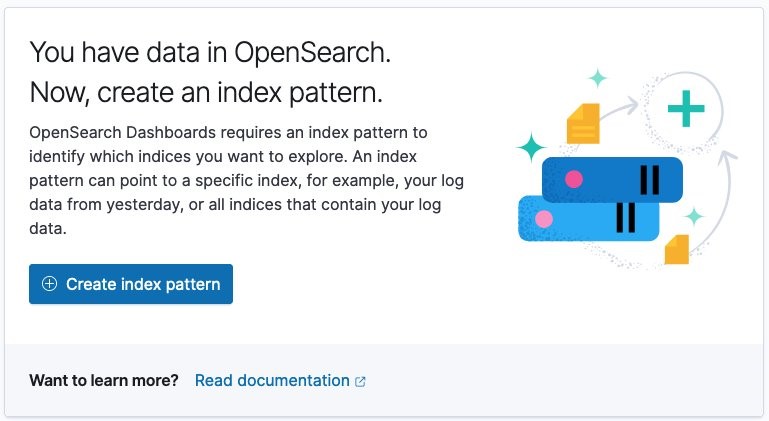
Figure 06 – Amazon OpenSearch index configuration welcome page
- Set the index pattern with an index name configured in Kinesis Data Firehose delivery stream (anf-index) and select Next step.

Figure 07 – Amazon OpenSearch index pattern configuration

Figure 08 – Amazon OpenSearch Bar Chart

Figure 09 – Amazon OpenSearch Discovered Dashboard
- Set timestamp as Time field and Create index pattern:
- Once again, go to Amazon OpenSearch Dashboard → Discover.
- This confirms that you’re receiving Network Firewall logs to the Amazon OpenSearch Service domain. Now you can start creating dashboards and charts on log data.
Creating dashboard to analyze Logs
You can create visualizations to look at different metrics, and then combine them to create a dashboard that gives you the complete analysis of logs. Here we describe how to create Tag Cloud and Pie Chart visualizations.
Tag Cloud visualization
- Log in to Amazon OpenSearch service, select the Visualize option from the menu, and then select Create visualization. Select the Tag Cloud visualization.

Figure 10 – Amazon OpenSearch Tag Cloud Visualization
- Select the index that was created for logs, and then configure the visualization options. In the Data section, under the Metrics option, select Tag size and leave the default Count under the Aggregation. In the Buckets, select Add -> Tags from the dropdown -> Significant Terms in the Aggregation dropdown. -> event.app_proto.keyword under the Field dropdown. In the Size dropdown, enter a value based on how many words you want to see in the visualization.

Figure 11 – Amazon OpenSearch Visualization metrics and buckets configuration
- In the Options section, you can change the Orientations and Font size of the words. Apply your changes by selecting Update.

Figure 12 – Amazon OpenSearch Visualization orientation and font size configuration
- You’ll see the visualization similar to this based on the data in the index.

Figure 13 – Amazon OpenSearch Tag Cloud Dashboard
- Select Save, give a name in the Title, and give some Description of the visualization to save the visualization.
Pie Chart visualization
- Select the Visualize option from the menu and then select Create visualization. Select the Pie.
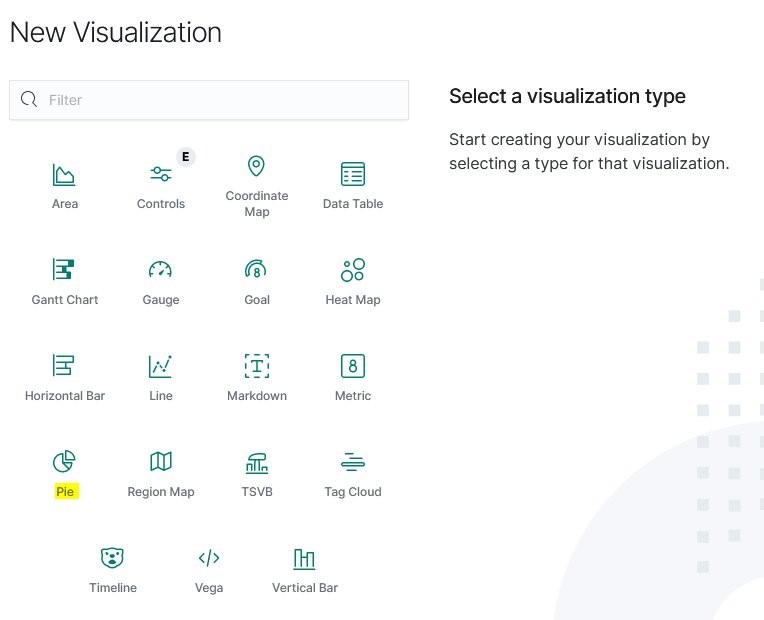
Figure 14 – Amazon OpenSearch Pie Visualization
- Select the same index and then configure the visualization options. In the Data section, under the Metrics option, select Slice size, and select Sum under Aggregation dropdown and netflow.bytes under the Field dropdown. In the Buckets, select Add, select Split slices from the dropdown, select Terms in the Aggregation dropdown, and then select event.src_port under the Field dropdown. In the Size dropdown, enter a value based on how many values you want to see in the visualization. Select Add again, select Split slices from the dropdown, select Terms in the Aggregation dropdown, and then select event.dest_port under the Field dropdown. In the Size dropdown, enter a value based on how many values you want to see in the visualization.

Figure 15 – Amazon OpenSearch Visualization metrics configuration

Figure 16 – Amazon OpenSearch Visualization buckets configuration

Figure 17 – Amazon OpenSearch Visualization additional buckets configuration
- In the Options section, you can change the Pie settings and Label settings. Apply your changes by selecting Update.

Figure 18 – Amazon OpenSearch Visualization pie and label settings
- Select Save, provide a name in the Title, and give some Description to save the visualization.
Dashboard
You can combine visualizations that show all of the relevant information about logs. Select Dashboard from the menu and then select Create dashboard. Select Add an existing to add visualizations to the dashboard. The panel will show the visualizations and select all of the necessary visualizations. Once done, all of the selected ones will be added to the dashboard. The size of the visualizations and some more formatting changes can be completed here to arrange the visualizations properly in the dashboard. Once done, select Save to save the dashboard and provide a Title and Description.
In the following sample dashboard, there are multiple visualizations, such as Pie chart, Donut chart, Horizontal and Vertical bar charts, and Tag Cloud. These focus on different metrics such as Source and Destination by Bytes Transferred and Flow count by different dimensions. These include application protocol, Source and destination IPs, Protocol, Source and Destination ports, and TCP flags.
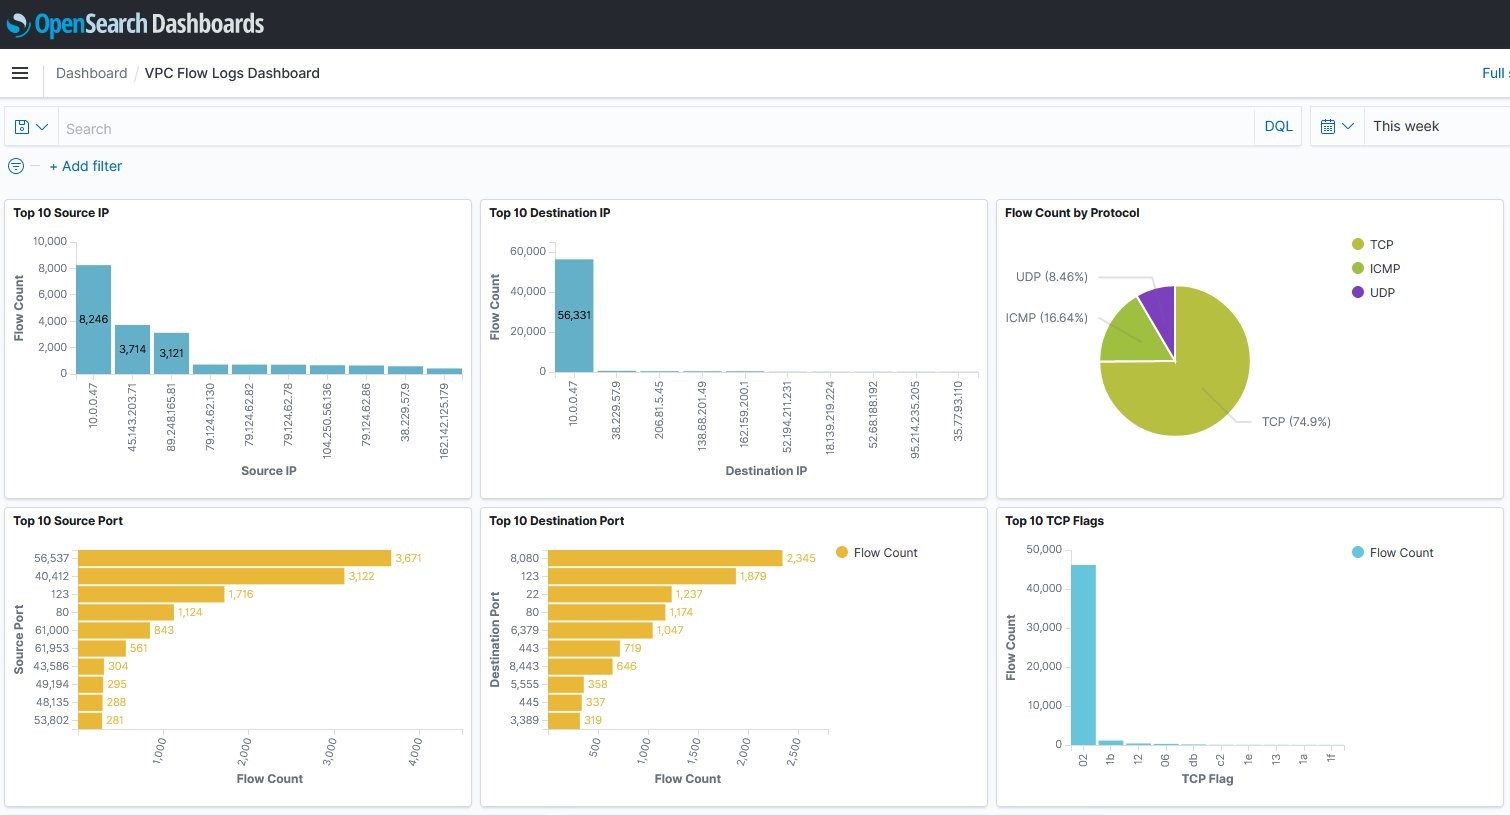

Figure 20 – Amazon OpenSearch Dashboard
Clean up
- First, clean up Network Firewall by navigating to AWS CloudFormation Stacks, select the stack that you have created earlier, and Delete.
- Next, go to Network Firewall rule groups and delete the two Suricata Stateful rule groups that you created.
- Next, delete the Kinesis Data Firehose delivery stream by navigating to Delivery streams, selecting the delivery stream that you have created, and Delete.
- Then, go to IAM Roles and delete the Service role created by Kinesis Data Firehose delivery stream. Find the Service role required by filtering via the Kinesis Data Firehose delivery stream name.
- Then, go to S3 buckets and delete the bucket that you created to store the failed data of the delivery stream.
- Lastly, clean up Amazon OpenSearch Service domain by navigating to Domains, selecting the domain that you have created, and Delete.
Conclusion
Altogether, this two-part blog series demonstrated the steps involved in analyzing AWS Network Firewall We walked through how to setup Amazon OpenSearch Service Index-specific permission for Kinesis Data Firehose Service role. Furthermore, we demonstrated how to configure rules in Network Firewall and generate test alerts. Moreover, we demonstrated how to create a dashboard and visualize different metrics in Amazon OpenSearch Service. You can also get hands-on experience with AWS Services using Network Firewall Workshop and Amazon OpenSearch Service Workshops.
About the authors:

Prakash Srinivasan
Prakash is a Solutions Architect with Amazon Web Services. He is a passionate builder and helps customers to modernize their applications and accelerate their Cloud journey to get the best out of Cloud for their business. In his spare time, he enjoys watching movies and spend more time with family. He is based out of Denver, Colorado and you can connect with him on Linkedin at linkedin.com/in/prakash-s

Sagar Gandha
Sagar is an experienced Sr. Technical Account Manager, adept at assisting large customers in the Enterprise Support. He offers expert guidance on best practices, facilitates access to subject matter experts, and delivers actionable insights on optimizing AWS spend, workloads, and events. When not at work, Sagar loves spending quality time with his family (wife Anitha and son Adrit) trying out new eateries, watching movies, and socializing with friends.