AWS Security Blog
How to Monitor Host-Based Intrusion Detection System Alerts on Amazon EC2 Instances
September 9, 2021: Amazon Elasticsearch Service has been renamed to Amazon OpenSearch Service. See details.
To help you secure your AWS resources, we recommend that you adopt a layered approach that includes the use of preventative and detective controls. For example, incorporating host-based controls for your Amazon EC2 instances can restrict access and provide appropriate levels of visibility into system behaviors and access patterns. These controls often include a host-based intrusion detection system (HIDS) that monitors and analyzes network traffic, log files, and file access on a host. A HIDS typically integrates with alerting and automated remediation solutions to detect and address attacks, unauthorized or suspicious activities, and general errors in your environment.
In this blog post, I show how you can use Amazon CloudWatch Logs to collect and aggregate alerts from an open-source security (OSSEC) HIDS. I use a CloudWatch Logs subscription to deliver the alerts to Amazon Elasticsearch Service (Amazon ES) for analysis and visualization with Kibana – a popular open-source visualization tool. To make it easier for you to see this solution in action, I provide a CloudFormation template to handle most of the deployment work. You can use this solution to gain improved visibility and insights across your EC2 fleet and help drive security remediation activities. For example, if specific hosts are scanning your EC2 instances and triggering OSSEC alerts, you can implement a VPC network access control list (ACL) or AWS WAF rule to block those source IP addresses or CIDR blocks.
Solution overview
The following diagram depicts a high-level overview of this post’s solution.
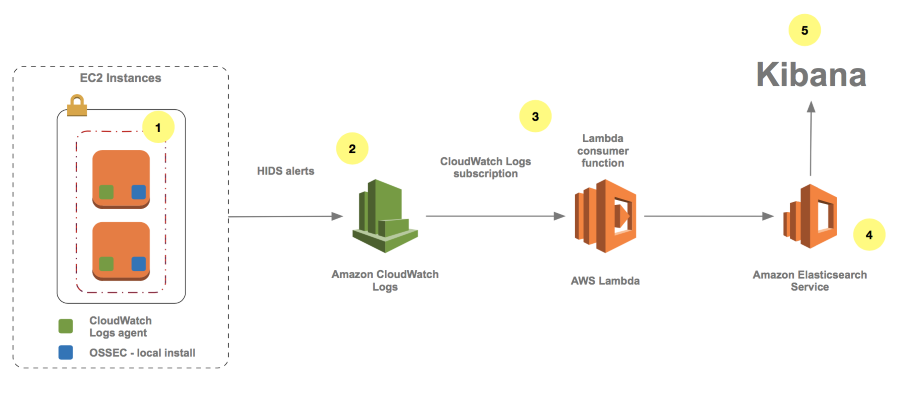
Here is how the solution works:
- On the target EC2 instances, the OSSEC HIDS generates alerts that the CloudWatch Logs agent captures. The HIDS performs log analysis, integrity checking, Windows registry monitoring, rootkit detection, real-time alerting, and active response. For more information, see Getting started with OSSEC.
- The CloudWatch Logs group receives the alerts as events.
- A CloudWatch Logs subscription is applied to the target log group to forward the events through AWS Lambda to Amazon ES.
- Amazon ES loads the logged alert data.
- Kibana visualizes the alerts in near-real time. Amazon ES provides a default installation of Kibana with every Amazon ES domain.
Deployment considerations
For the purposes of this post, the primary OSSEC HIDS deployment consists of a Linux-based installation for which the alerts are generated locally within each system. Note that this solution depends on Amazon ES and Lambda in the target region for deployment. You can find the latest information about AWS service availability in the Region table. You also must identify an Amazon Virtual Private Cloud (VPC) subnet that has Internet access and DNS resolution for your EC2 instances to provision the required components properly.
To simplify the deployment process, I created a test environment AWS CloudFormation template. You can use this template to provision a test environment stack automatically into an existing Amazon VPC subnet. You will use CloudFormation to provision the core components of this solution and then configure Kibana for alert analysis. The source code for this solution is available on GitHub.
This post’s template performs the following high-level steps in the region you choose:
- Creates two EC2 instances running Amazon Linux with an AWS Identity and Access Management (IAM) role for CloudWatch Logs access. Note: To provide sample HIDS alert data, the two EC2 instances are configured automatically to generate simulated HIDS alerts locally.
- Installs and configures OSSEC, the CloudWatch Logs agent, and additional packages used for the test environment.
- Creates the target HIDS Amazon ES domain.
- Creates the target HIDS CloudWatch Logs group.
- Creates the Lambda function and CloudWatch Logs subscription to send HIDS alerts to Amazon ES.
After the CloudFormation stack has been deployed, you can access the Kibana instance on the Amazon ES domain to complete the final steps of the setup for the test environment, which I show later in the post.
Although out of scope for this blog post, when deploying OSSEC into your existing EC2 environment, you should determine the desired configuration, including target log files for monitoring, directories for integrity checking, and active response. This typically also requires time for testing and tuning of the system to optimize it for your environment. The OSSEC documentation is a good place to start to familiarize yourself with this process. You could take another approach to OSSEC deployment, which involves an agent installation and a separate OSSEC manager to process events centrally before exporting them to CloudWatch Logs. This deployment requires an additional server component and network communication between the agent and the manager. Note that although Windows Server is supported by OSSEC, it requires an agent-based installation and therefore requires an OSSEC manager to be present. Review OSSEC Architecture for additional information about OSSEC architecture and deployment options.
Deploy the solution
This solution’s high-level steps are:
- Launch the CloudFormation stack.
- Configure a Kibana index pattern and begin exploring alerts.
- Configure a Kibana HIDS dashboard and visualize alerts.
1. Launch the CloudFormation stack
You will launch your test environment by using a CloudFormation template that automates the provisioning process. For the following input parameters, you must identify a target VPC and subnet (which requires Internet access) for deployment. If the target subnet uses an Internet gateway, set the AssignPublicIP parameter to true. If the target subnet uses a NAT gateway, you can leave the default setting of AssignPublicIP as false.
First, you will need to stage the Lambda function deployment package in an S3 bucket located in the region into which you are deploying. To do this, download the zipped deployment package and upload it to your in-region bucket. For additional information about uploading objects to S3, see Uploading Object into Amazon S3.
You also must provide a trusted source IP address or CIDR block for access to the environment following the creation of the stack and an EC2 key pair to associate with the instances. For information about creating an EC2 key pair, see Creating a Key Pair Using Amazon EC2. Note that the trusted IP address or CIDR block also is used to create the Amazon ES access policy automatically for Kibana access. We recommend that you use a specific IP address or CIDR range rather than using 0.0.0.0/0, which would allow all IPv4 addresses to access your instances. For more information about authorizing inbound traffic to your instances, see Authorizing Inbound Traffic for Your Linux Instances.
After you have confirmed the input parameters (see the following screenshot and table for more details), create the CloudFormation stack.
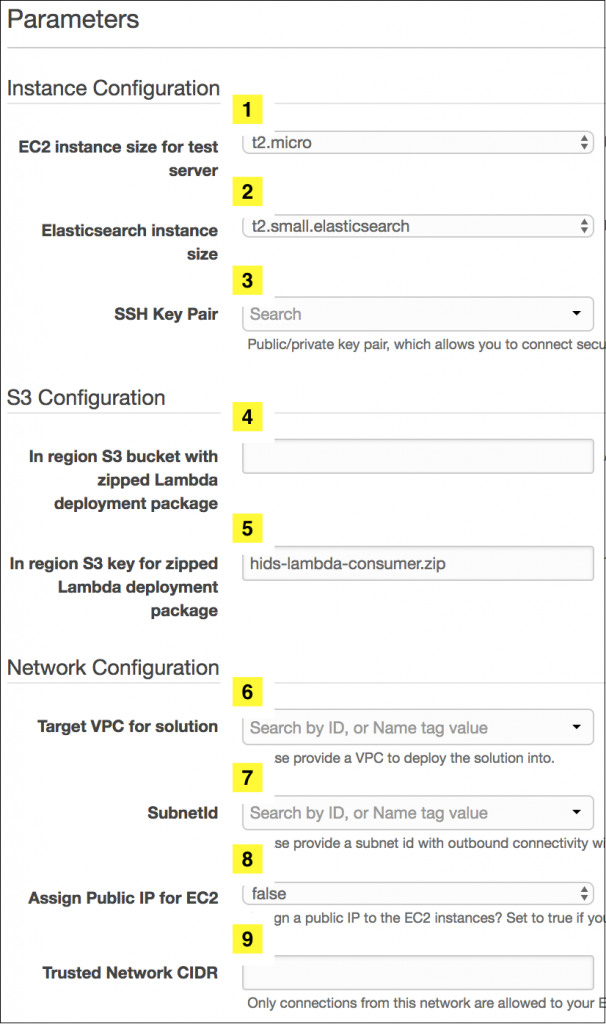
| Input parameter | Input parameter description |
| 1. HIDSInstanceSize | EC2 instance size for test server |
| 2. ESInstanceSize | Amazon ES instance size |
| 3. MyKeyPair | A public/private key pair that allows you to connect securely to your instance after it launches |
| 4. MyS3Bucket | In-region S3 bucket with the zipped deployment package |
| 5. MyS3Key | In-region S3 key for the zipped deployment package |
| 6. VPCId | An Amazon VPC into which to deploy the solution |
| 7. SubnetId | A SubnetId with outbound connectivity within the VPC you selected (requires Internet access) |
| 8. AssignPublicIP | Set to true if your subnet is configured to connect through an Internet gateway; set to false if your subnet is configured to connect through a NAT gateway |
| 9. MyTrustedNetwork | Your trusted source IP or CIDR block that is used to whitelist access to the EC2 instances and the Amazon ES endpoint |
To finish creating the CloudFormation stack:
- Enter the input parameters and choose Next.
- On the Options page, accept the defaults and choose Next.
- On the Review page, confirm the details, select the I acknowledge that AWS CloudFormation might create IAM resources check box, and then choose Create. (The stack will be created in approximately 10 minutes.)
After the stack has been created, note the HIDSESKibanaURL on the CloudFormation Outputs tab. Then, proceed to the Kibana configuration instructions in the next section.
2. Configure a Kibana index pattern and begin exploring alerts
In this section, you perform the initial setup of Kibana. To access Kibana, find the HIDSESKibanaURL in the CloudFormation stack outputs (see the previous section) and choose it. This will bring you to the Kibana instance, which is automatically provisioned to your Amazon ES instance. The source IP you provided in the CloudFormation input parameters is used to automatically populate the Amazon ES access policy. If you receive an error similar to the following error, you must confirm that your Amazon ES access policy is correct.
For additional information about securing access to your Amazon ES domain, see How to Control Access to Your Amazon Elasticsearch Service Domain.
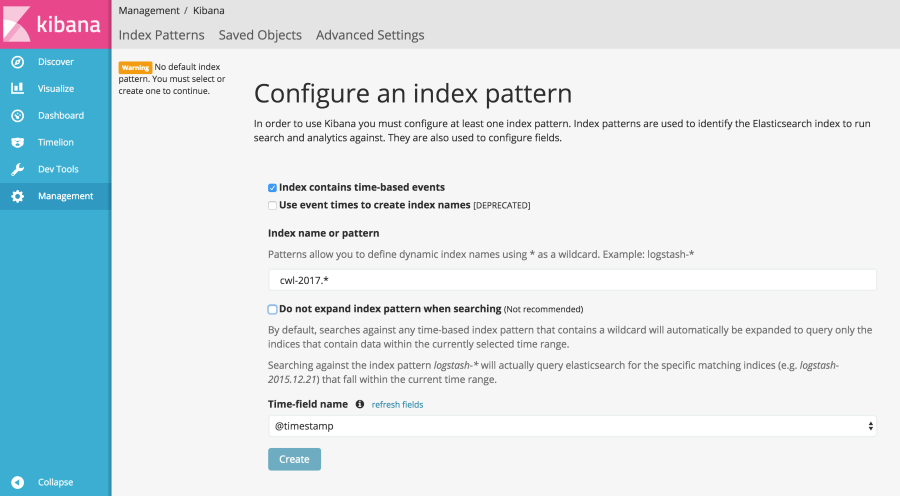
The OSSEC HIDS alerts now are being processed into Amazon ES. To use Kibana to analyze the alert data interactively, you must configure an index pattern that identifies the data you wish to analyze in Amazon ES. You can read additional information about index patterns in the Kibana documentation.
In the Index name or pattern box, type cwl-2017.*. The index pattern is generated within the Lambda function as cwl-YYYY.MM.DD, so you can use a wildcard character for the month and day to match data from 2017. From the Time-field name drop-down list, choose @timestamp, and then choose Create.
In Kibana, you should now be able to choose the Discover pane and see alerts being populated. To set the refresh rate for the display of near-real-time alerts, choose your desired time range in the top right (such as Last 15 minutes).
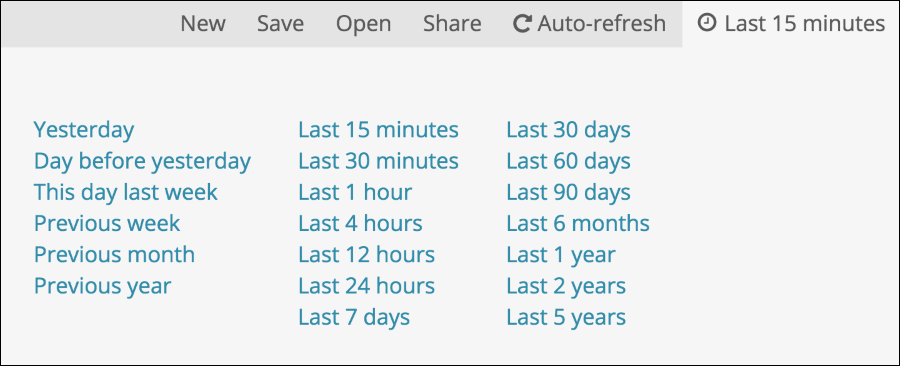
Choose Auto-refresh, and then choose an interval, such as 5 seconds.

Kibana should now be configured to auto-refresh at a 5-second interval within the timeframe you configured. You should now see your alerts updating along with a count graph, as shown in the following screenshot.
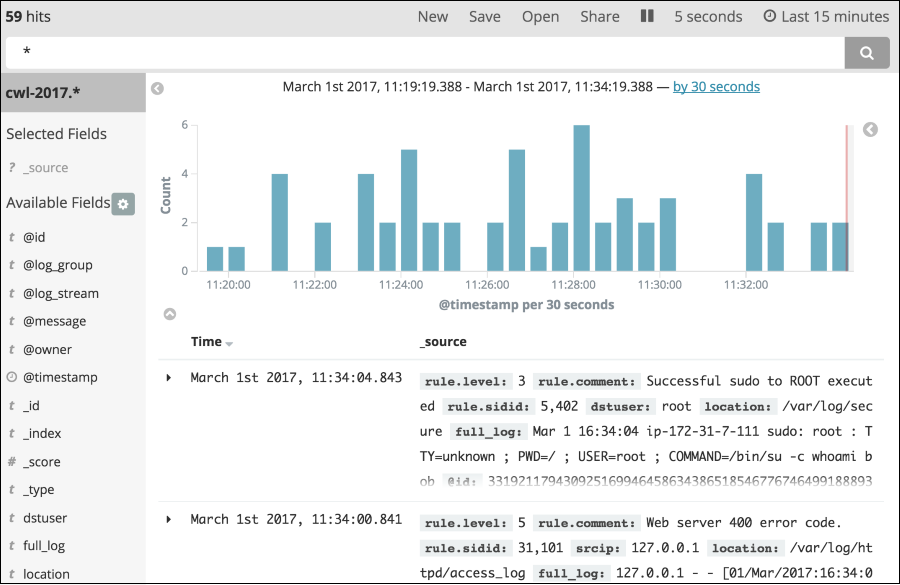
The EC2 instances are automatically configured by CloudFormation to simulate activity to display several types of alerts, including:
- Successful sudo to ROOT executed – The Linux sudo command was successfully executed.
- Web server 400 error code – The server cannot process the request due to an apparent client error (such as malformed request syntax, too large size, invalid request message framing, or deceptive request routing).
- SSH insecure connection attempt (scan) – Invalid connection attempt to the SSH listener.
- Login session opened – Opened login session on the system.
- Login session closed – Closed login session on the system.
- New Yum package installed – Package installed on the system.
- Yum package deleted – Package deleted from the system.
Let’s take a closer look at some of the alert fields, as shown in the following screenshot.
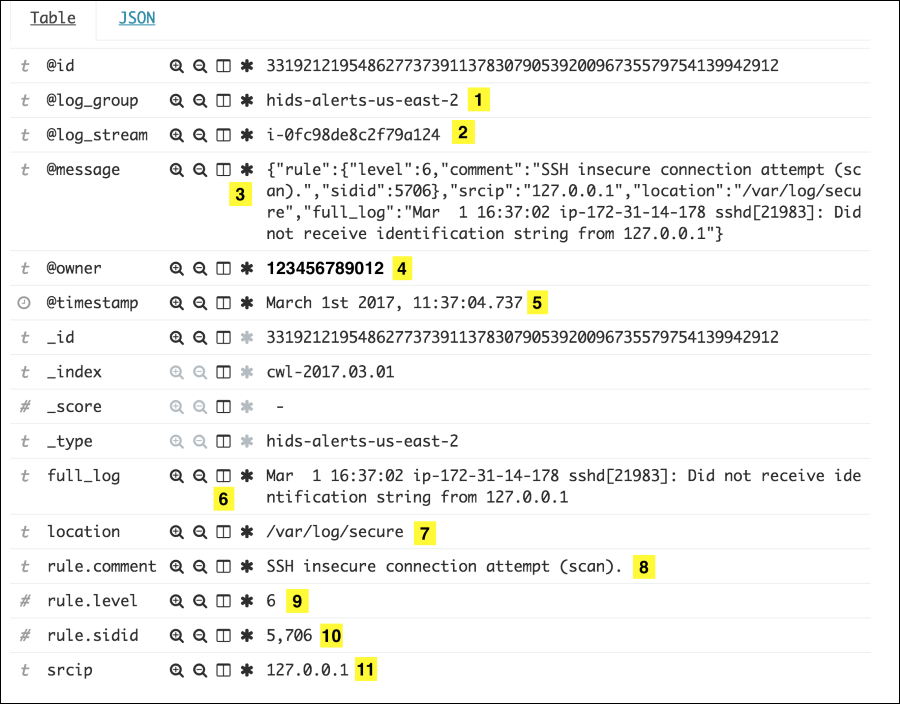
The numbered alert fields in the preceding screenshot are defined as follows:
- @log_group – The source CloudWatch Logs group
- @log_stream – The CloudWatch Logs stream name (InstanceID)
- @message – The JSON payload from the source alerts.json OSSEC log
- @owner – The AWS account ID where the alert originated
- @timestamp – The time stamp applied by the consumer Lambda function
- full_log – The log event from the source file
- location – The source log file path and file name
- rule.comment – A brief description of the OSSEC rule that was matched
- rule.level – The OSSEC rule classification from 0 to 16 (see Rules Classification for more information)
- rule.sidid – The rule ID of the OSSEC rule that was matched
- srcip – The source IP address that triggered the alert; in this case, the simulated alerts contain the local IP of the server
You can enter search criteria in the Kibana query bar to explore HIDS alert data interactively. For example, you can run the following query to see all the rule.level 6 alerts for the EC2 InstanceID i-0e427a8594852eca2 where the source IP is 10.10.10.10.
You can perform searches including simple text, Lucene query syntax, or use the full JSON-based Elasticsearch Query DSL. You can find additional information on searching your data in the Elasticsearch documentation.
3. Configure a Kibana HIDS dashboard and visualize alerts
To analyze alert trends and patterns over time, it can be helpful to use charts and graphs to represent the alert data. I have configured a basic dashboard template that you can import into your Kibana instance.
To add the template of a sample HIDS dashboard to your Kibana instance:
- Save the template locally and then choose Management in the Kibana navigation pane.
- Choose Saved Objects, Import, and the HIDS dashboard template.
- Choose the eye icon to the right of the HIDS Alerts dashboard entry. This will take you to the imported dashboard.

After importing the Kibana dashboard template and selecting it, you will see the HIDS dashboard, as shown in the following screenshot. This sample HIDS dashboard includes Alerts Over Time, Top 20 Alert Types, Rule Level Breakdown, Top 10 Rule Source ID, and Top 10 Source IPs.
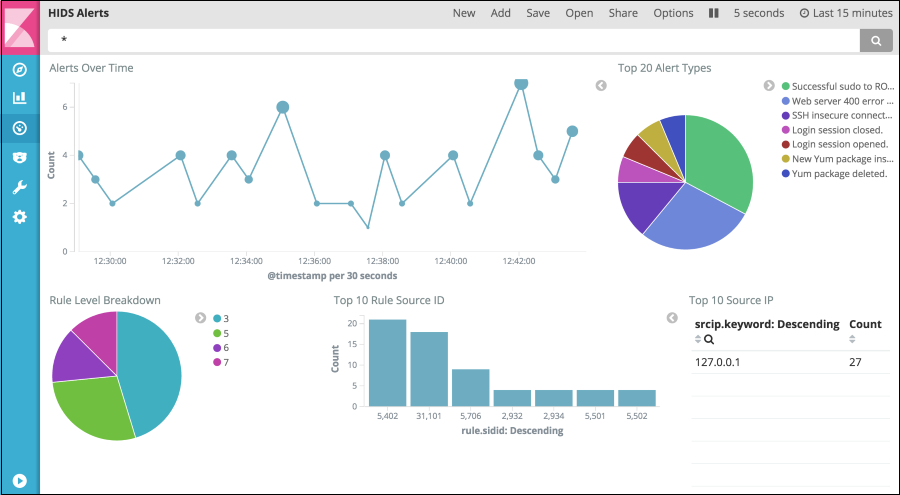
To explore the alert data in more detail, you can choose an alert type on which to filter, as shown in the following two screenshots.
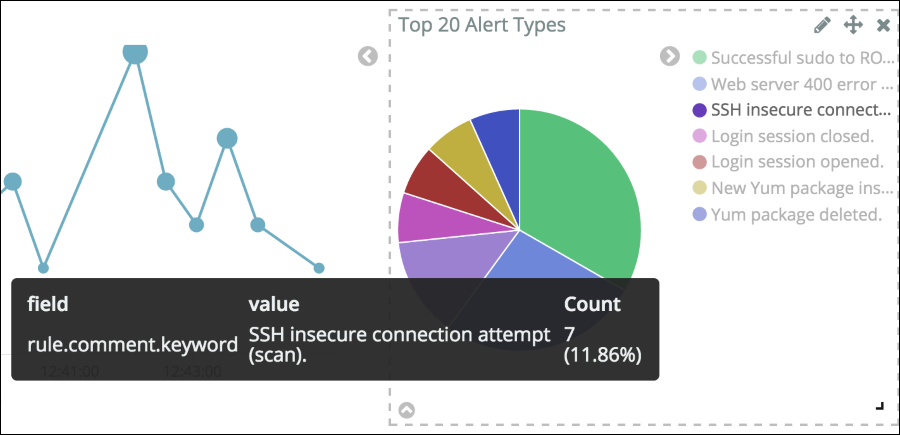

You can see more details about the alerts based on criteria such as source IP address or time range. For more information about using Kibana to visualize alert data, see the Kibana User Guide.
Summary
In this blog post, I showed how to use CloudWatch Logs to collect alerts in near-real time from an OSSEC HIDS and use a CloudWatch Logs subscription to pass the alerts into Amazon ES for analysis and visualization with Kibana. The dashboard deployed by this solution can help you improve the security monitoring of your EC2 fleet as part of a defense-in-depth security strategy in your AWS environment.
You can use this solution to help detect attacks, anomalous activities, and error trends across your EC2 fleet. You can also use it to help prioritize remediation efforts for your systems or help determine where to introduce additional security controls such as VPC security group rules, VPC network ACLs, or AWS WAF rules.
If you have comments about this post, add them to the “Comments” section below. If you have questions about or issues implementing this solution, start a new thread on the CloudWatch or Amazon ES forum. The source code for this solution is available on GitHub. If you need OSSEC-specific support, see OSSEC Support Options.
– Cameron
Want more AWS Security how-to content, news, and feature announcements? Follow us on Twitter.