AWS Cloud Operations Blog
Monitoring underlying hardware failures for EC2 instances by logging them with Amazon OpenSearch Service
With Amazon Elastic Compute Cloud (Amazon EC2) you can spin up a virtual server or instance of various sizes that run on system composed of server, storage, and network hardware. AWS uses status checks to monitor the system on which an EC2 instance runs and detects underlying problems with your instance. These checks are performed every minute, returning a pass or fail status. In the event of a failure, AWS fixes your instance by bringing it up on other hardware while rebooting it.
Although you can wait for AWS to detect and take corrective action on your instance, you can choose to monitor these events proactively and perform reboot and post-boot actions to bring your application back.
In this post, share a solution that helps you receive email notifications and log these events in your centralized logging solution for troubleshooting, auditing, or tracking purpose. The solution provides you with a framework that you can extend to perform action by adding code appropriate to your environment.
Solution components
The goal of the solution is to catch events of hardware or software failures or system check failures on your EC2 instances and send notifications, trigger functions to perform any action, and log events in centralized logging solutions. Depending on the service level agreement (SLA) for your application, you might want to consider the use of an Auto Scaling group and an AWS Elastic Load Balancing load balancer.

Figure 1: Solution architecture
Amazon CloudWatch is a monitoring and observability service built for DevOps engineers, and developers. CloudWatch collects monitoring and operational data in the form of logs, metrics, and events. In this solution, we have used CloudWatch to raise an alarm based on the condition of “Status Check Failed” more than once in last 1 min.
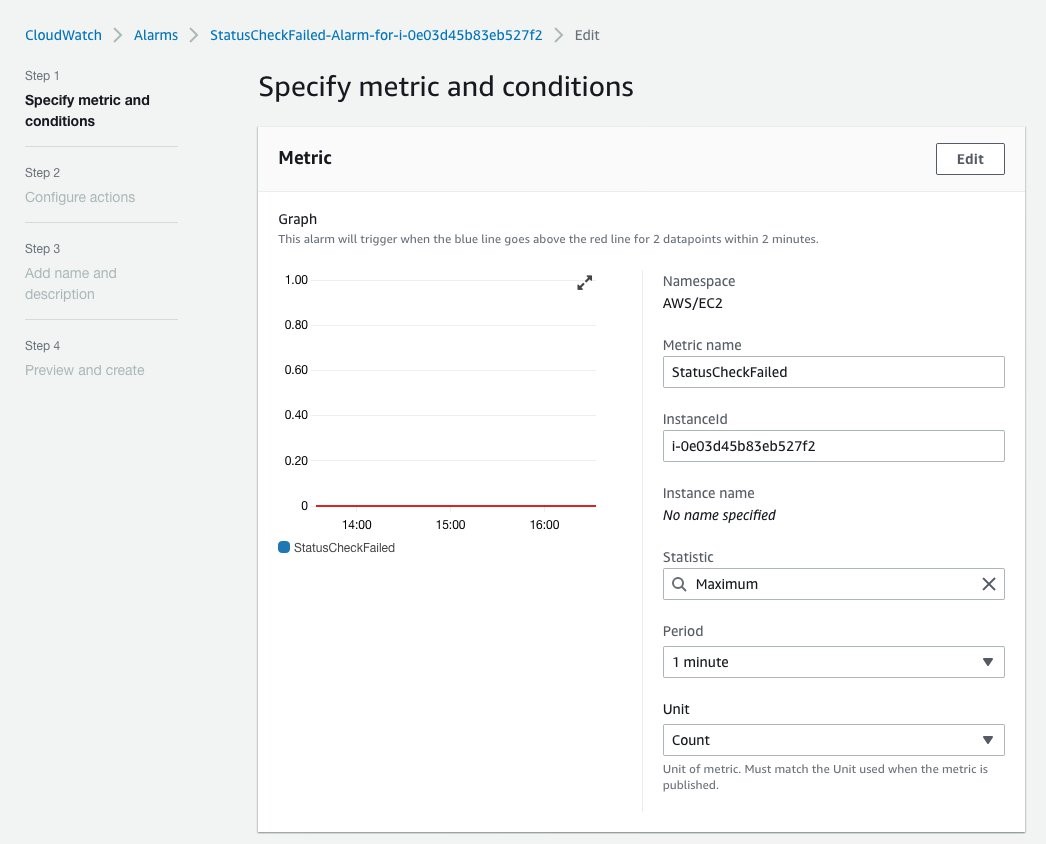
Figure 2: Specify metric and conditions
This solution uses Simple Notification service (SNS) to notify you through email and trigger a Lambda function that collects the SNS event payload and push it to Amazon OpenSearch Service.
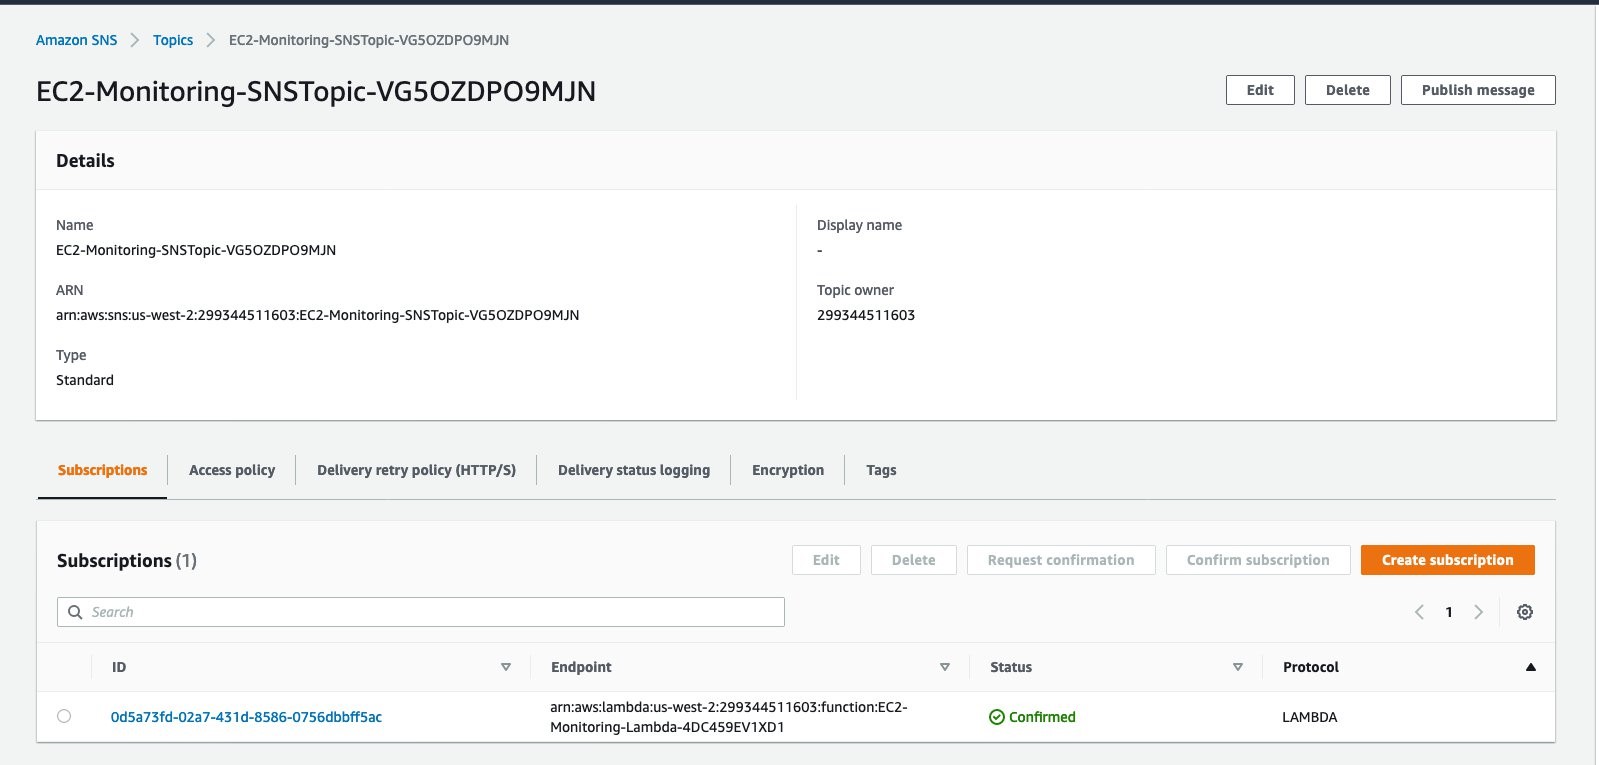
Figure 3: EC2 monitoring SNS topic
Lambda helps you send logs to your choice of logging solution.

Figure 4: LoggingEC2SystemFailuresToES function
Elasticsearch is a leading centralized open-source log management solutions for capturing, storing, and enabling the real-time analysis of highly scaled data. Due to its popularity, AWS offers Amazon OpenSearch Service, a fully managed service that makes it easy for you to deploy, secure, and run Elasticsearch cost effectively at scale. You can use Amazon OpenSearch Service to create dashboards within minutes of ingesting logs into it.
This solution is designed to work for multi-account setups where you can use SNS from a centralized logging account to send alerts to email. In a multi-account setup, you deploy the whole stack in your logging account. You will provide an OrgID (AWS Organization ID) as a parameter when you create the CloudFormation stack. If you don’t supply an OrgID, the solution will be deployed for the current account only. You can also update the stack later to add an OrgID and enable the solution for whole organization created in AWS Organizations.
Prerequisites
You will need the following things prior deploying this solution.
- S3 bucket where you can upload lambda code that is provided with this solution.
- Security Group that would allow lambda to reach OpenSearch service (default port is 443). You can add egress port 443 in your existing security group or you can create new security group with egress rule as shown here
- AWS OrgID (optional) if you want to deploy solutions for all AWS accounts under one Org.
Deploy the solution
This solution is available in a AWS CloudFormation template. Please download the whole solution from here to get lambda code (escode.zip) along with CloudFormation Template.
- Upload the Lambda function code to any S3 bucket in your account. Make a note of the bucket location. You will need it later when you create the CloudFormation stack.
- Sign in to the AWS Management Console and open the AWS CloudFormation console at https://console.aws.amazon.com/cloudformation.
- Choose Create Stack with new resources (standard).
- In Specify template, choose Upload a template file,
CloudFormationTemplateES.yamland then choose Next. - In Parameters, enter the following:
-
- If you want to deploy this solution for all accounts in an organization created under AWS Organizations, enter the AWSOrgID.
- OpenSearch Service server
- OpenSearch Service server port
- OpenSearch Service user
- OpenSearch Service password
- S3 bucket name (This is the bucket where you have uploaded the Lambda function code in Step 1)
- S3 key (This is the folder under S3 where you uploaded the Lambda function code.)
- Security group (From the dropdown list, choose the security group that will give Lambda access to the OpenSearch Service server. The default port is 443.)
- Subnet where the Lambda function will be deployed to get access to the OpenSearch Service server.
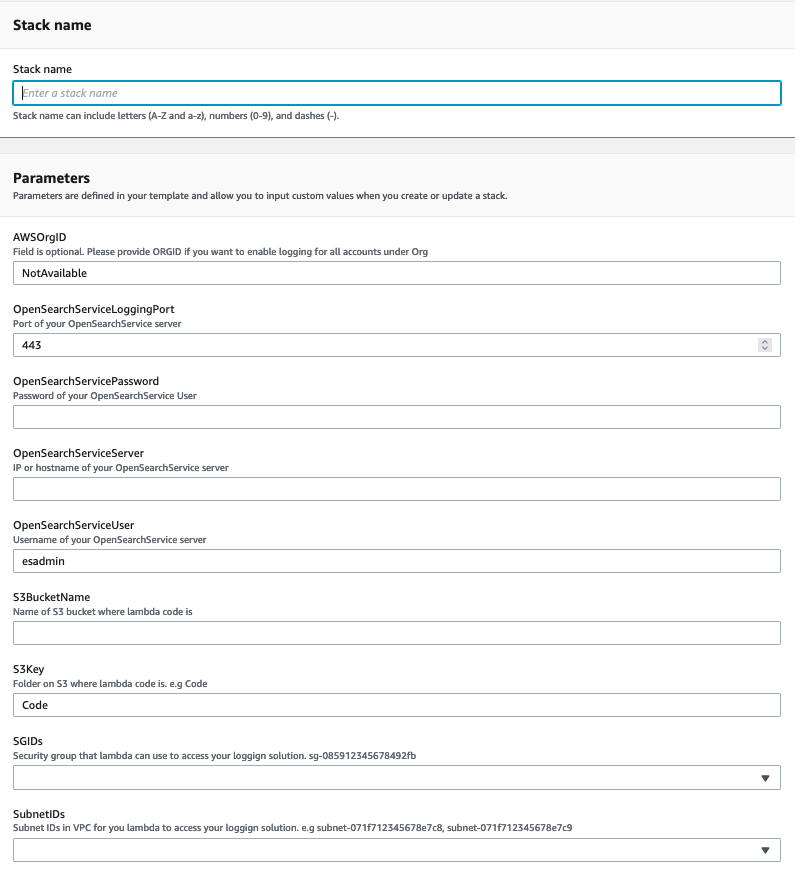
Figure 5: Parameters for OpenSearch Service
- Deploy the stack. It will take 3-4 minutes.
- Check that stack resources (the Lambda function, its execution role, and the SNS topic) have been created. Make a note of the SNS topic ARN. You will need it later when you create a CloudWatch alarm.
At this point, your infrastructure is ready to use.
You can now create a CloudWatch alarm on any EC2 instance in the same account (or any account in your organization). Please visit EC2 service via console.
Go to the EC2 instance that you want to monitor and choose the Status checks tab. From Actions, choose Create status check alarm. Enter information about the SNS topic (Noted in Step 6) in the alarm notification field.
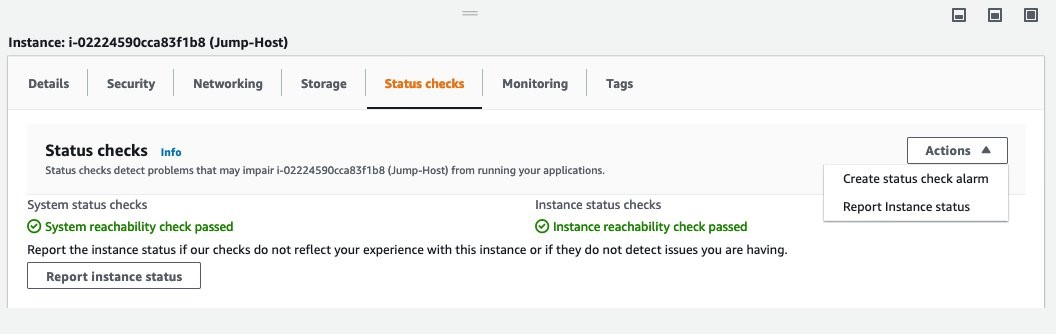
Figure 6: Status checks tab
If you chose to use AWS CLI to create a status check alarm, here is an example for your guidance.
Here is the OpenSearch Service dashboard for ingested event.

Figure 7: Query Dashboard
Cleanup
To avoid charges to your account, delete the CloudFormation stack and resources. For instructions, see Deleting a stack on the AWS CloudFormation console in the AWS CloudFormation User Guide.
Conclusion
In this blog post, I showed how you can log events to your logging platform for hardware or software failures or system check failures on your EC2 instances. To catch these events, you use CloudWatch to create an alarm and SNS to send email notifications and invoke a Lambda function. This solution helps you log reboot/outage events caused by hardware failure on the AWS side. To ensure the highest availability, consider separating single-zone Auto Scaling groups into a single group spanning multiple Availability Zones for your applications.