AWS Database Blog
Planning I/O in Amazon Aurora
| June 2023: For Aurora databases where IO is greater than 25% of your costs, check out this blog post and recent announcement to see if you can save money with Aurora I/O-Optimized. |
Amazon Aurora combines the performance and availability of commercial databases with the simplicity and cost-effectiveness of open-source databases. An Aurora cluster consists of one or more instances connected to a shared and distributed Aurora storage volume. This new storage engine replaces the traditional block storage devices commonly used with relational databases with a dynamic, auto-scaling, self-healing, log-based storage volume. This new storage engine was designed for the cloud, so some fundamental changes were made from how databases traditionally interact with the storage system.
This post shows how I/O works on Aurora compared to a traditional database, how to monitor Aurora I/O cost, and how to optimize Aurora I/O.
Overview of database I/O
At a high level, relational databases traditionally interact with block storage. On this block storage, the data is stored in blocks of rows called pages. Page size differs between database engines and even within the same database engine depending on the engine’s configuration parameters. Aurora supports a 16 KB page size for Amazon Aurora MySQL and an 8 KB page size for Amazon Aurora PostgreSQL. The page size is the smallest I/O operation that the database engine performs.
Read operations
When a relational database like MySQL or PostgreSQL reads a page from disk, that page is stored in memory in a segment called the buffer pool. That page remains in memory indefinitely until it’s evicted due to memory pressure from other pages being read into the buffer pool or an engine restart. When an application runs a SELECT query, the engine attempts to fulfill the query using pages already in the buffer pool. Pages required to complete the query that don’t exist in the buffer pool must first be read from the disk into the buffer pool before the query can complete.
With Aurora, reads are handled in same way as native MySQL or PostgreSQL—data is read from the storage volume by page as needed to populate the buffer pool, and SELECT queries are run against those pages inside the buffer pool. As such, read I/O operations are accumulated as pages or extents are read from the storage volume. If a query is such that all the pages required to run the query already exist in the buffer pool, there is no reason to read from the storage volume and the I/O for that query is zero. For queries that do require retrieval of pages from the storage volume, each page read is counted as one read I/O.
Multiple factors can determine how full each page is, and therefore how many pages it takes to hold the same number of rows. One of those factors is the specified fill factor of an index. A fill factor of 100 indicates that when the index is created, each page should be filled as close as possible to 100% capacity. This results in fewer pages used to store the same number of rows, thereby maximizing read I/O efficiency.
For example, if a table has a row size of 100 bytes and the primary key is created with a fill factor of 100, roughly 160 rows fit into a 16 KB page. However, if the fill factor is to 50, resulting in each page being filled to 50% capacity, the result is two pages, each with 80 rows. This means that reading the same set of rows with a fill factor of 50 results in twice as many read I/O operations. Please note that fill factor only applies when creating or rebuilding a primary key or index.
The degree to which pages are filled by subsequent DML operations depends on a number of other factors. For example, when specifying the primary key of the table as a sequential, auto-incrementing integer, new rows are stacked neatly into new pages, resulting in each page being filled to capacity and minimizing the total number of pages. Conversely, if the primary key is more random, such as a GUID or a natural key consisting of multiple columns, the tendency is for pages to split because new rows may be inserted in the middle of the index, rather than appended at the end. In this way, the index becomes fragmented and the number of pages required to store the same number of rows grows significantly. Fragmented pages result in a lot of wasted space in the buffer pool and an increase in read I/O.
Write operations
When a relational database performs a write operation like an INSERT, UPDATE or DELETE, a few things happen. First, the page that is to be modified is placed into the buffer pool, and a record of the change to be made to that page is written to a transaction log. The name of this log varies from platform to platform, but in MySQL it’s called a redo log and in PostgreSQL it’s called the WAL log. There are also other logs such as the binary log (binlog) in MySQL that are written to the disk depending on the platform, but for this post, the focus is on the redo log.
After the redo log is written, the page is modified in the buffer pool and remains in the buffer pool as a dirty page until a process known as a checkpoint writes that page along with all the other dirty pages to the disk. The checkpoint process is very write-intensive and can generate significant disk I/O.
With Aurora, the same operations of placing a page into the buffer pool, writing to the redo log, and modifying the page in the buffer pool remain, with each redo log record representing the changes to be made to a page. The major difference is that Aurora doesn’t issue checkpoints, ever. Instead, the only data that is written to the Aurora storage volume is the redo log, which is very small in size as compared to a full page. This means that all the disk I/O that is normally generated by writing dirty 8 KB or 16 KB pages to disk is eliminated. Instead, pages are materialized periodically on the storage nodes and even on demand in some cases. There is no charge for these I/O operations. The net effect of these changes is an overall reduction in total write I/O operations despite the fact that all writes are sent to six storage nodes spread across three Availability Zones (counted as one write).
Although actual log records vary in size, writes to an Aurora cluster are sent in 4 KB units when possible. If the writer has several log records at the same time that are less than 4 KB in size, they’re batched together into a single write operation. For example, a 50-byte log record and 3,000-byte log record may be combined into a single write operation. Log records greater than 4 KB are split into 4 KB units.
If the Aurora cluster contains read-only instances, the same write that is sent to the storage volume is also sent to those read-only instances. This makes sure that the buffer pool on each reader remains up to date. When a reader receives a log record and it corresponds to a page already in the read-only instance’s buffer pool, the change described in the log record is applied to the page in the reader’s buffer pool and then the log record itself is discarded. If the page doesn’t exist in the buffer pool, the log record is simply discarded. Neither case results in any I/O activity with the storage volume.
I/O in practice
Now that we have covered the fundamentals of I/O in Aurora, let’s look at a more concrete example using Aurora MySQL:
In this case, column_name1 is the primary key of the table and an empty buffer pool is assumed.
The operations are as follows:
- Traverse the clustered index to reach the page containing the row to modify (implicit read I/O)
- Begin the transaction and allocate undo log space for the update (database engine I/O)
- Update the page containing the row we’re modifying (user SQL query I/O)
- Log the undo to the transaction system (database engine I/O)
- Commit the transaction (database engine I/O)
In this example, although there are multiple implicit I/O operations, it’s possible that some or all of the write operations may be batched together into a single write I/O. Additionally, even though this is a write operation, read I/O was still required. The final thing to note is that there are I/O operations that are simply part of the normal transactional process of the database engine.
There are other I/O operations that don’t involve queries at all. For example, the creation of an index. In this scenario, there is implicit read I/O to read the data necessary to create the new index as well as explicit write I/O in order to write the new index to the storage volume.
Monitoring I/O
To ensure optimal I/O cost with an Aurora cluster, it’s best to begin with monitoring.
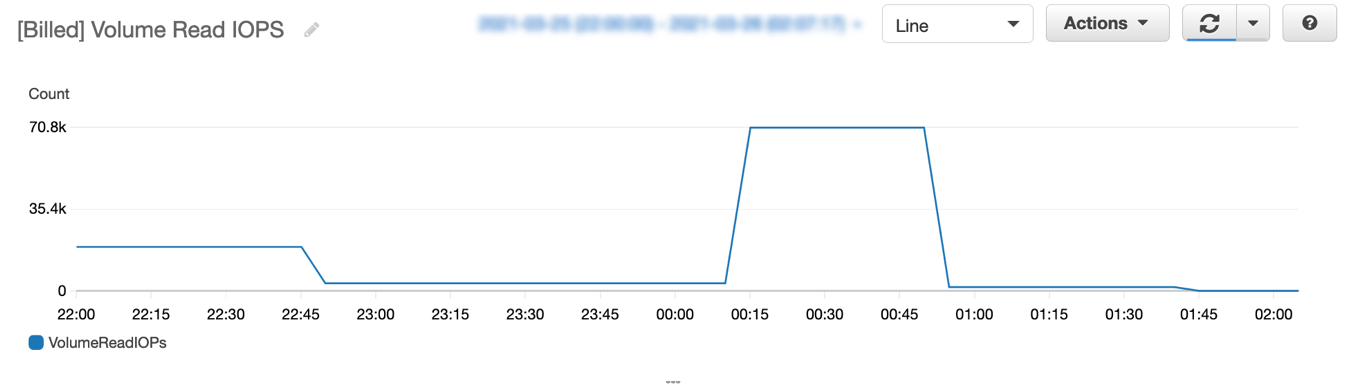
You can monitor the number of read I/O per second consumed by any Aurora instance using the Amazon CloudWatch metric [Billed] Volume Read IOPS (Count).
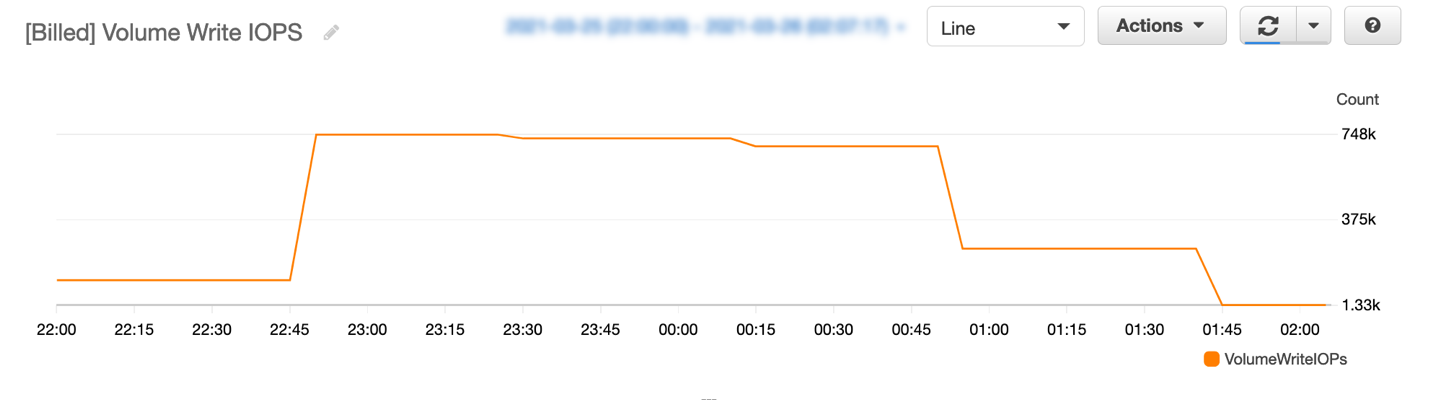
You can monitor the number of write IOPS consumed by any Aurora instance using the metric [Billed] Volume Write IOPS (Count).
After monitoring has been established, and a baseline has been determined as to the average number of read and write I/O requests, you can set up CloudWatch alert notifications to notify you in the event of a spike in I/O usage rather than waiting for the monthly bill.
MySQL-specific considerations
Replication between the writer and reader nodes of an Aurora cluster requires no additional I/O. However, some use cases may require replication to a target outside of Aurora, which requires enabling the binlog. Enabling the binlog in Aurora MySQL increases write I/O requests by at least one for each transaction, and additional write I/O may be required to maintain the internal binlog structure. As the binlog is read by consumers, they incur additional read I/O.
Enabling the slow query log to capture long-running queries may be a useful way to find queries that need to be optimized. Alternatively, you can use Performance Schema objects to get a list of SQL queries that process a lot of rows or are otherwise in need of performance tuning.
PostgreSQL-specific considerations
In PostgreSQL, rows in a table are maintained as tuples. When a row is deleted, the tuple that represents that row is not physically removed. It’s simply marked as deleted. Additionally, an update operation results in marking the old tuple as deleted and inserting a new tuple to represent the same row. Over time, the number of deleted tuples can grow, causing unnecessary read I/O and a corresponding degradation in performance as the database engine traverses these deleted tuples. The vacuum process removes dead tuples. There are several types of database engine read and write I/O operations generated by the PostgreSQL vacuum process.
You can use pgBadger to analyze logs to reveal slow-running queries, and pg_stat_statements can be a powerful low-level tool for capturing expensive SQL statements. Additionally, Aurora PostgreSQL supports query plan management. This feature provides both plan stability as well as plan adaptability.
It’s a best practice to periodically review table and index bloat and run the vacuum process as appropriate. A more preferred approach is to enable autovacuum. This helps automate the vacuum process and provides better performance and lower I/O consumption.
By default, every update requires new index entries to be added in order to link to newly created pages, even if no indexed attribute is modified. For Heap Only Tuples (HOT), a new tuple is created on the same page as the old tuple if possible, maintaining a chain of updated tuples. Because no new page was created, the index can continue to point to the same page and doesn’t need to be modified.
The following query returns the number of non-HOT updates:
If the number of non-HOT updates for a table is high, you can modify the fill factor to leave some extra disk space on data pages unused for future normal or HOT updates.
Aurora-specific features
Aurora also offers the following features:
- Cloning – With the clone feature, you can quickly create a copy of an Aurora cluster. The process is quick and not I/O intensive because no data is copied at the time of creation. Instead, Aurora clones use a copy on write mechanism that generates a new page when a change is made to a page that existed at the time that the clone was created. These I/O operations operate and are billed in exactly the same way as I/O operations on any other Aurora cluster. The cluster that caused the change is the cluster to which the I/O operations are billed.
- Global databases – Amazon Aurora Global Database provides low-latency global reads and disaster recovery between Regions. With Aurora Global Database, the primary cluster incurs I/O cost in the same way as a single, regional cluster. However, to maintain a global replica, all write I/O must be transmitted to the secondary Region and written to the secondary cluster. In the scenario with one primary cluster and one replica cluster, the write I/O is (primary + transmitted + secondary) 3x the write I/O of the primary cluster. As for read I/O, it’s billed based on independent reads on the primary and secondary clusters.
- Parallel queries (Aurora MySQL) – Parallel queries in Aurora MySQL provide performance improvements to certain analytical queries by pushing much of the filtering and aggregation work to the storage engine. However, the pages processed by parallel queries aren’t stored in the buffer pool. As such, read I/O requests may increase.
- Cluster cache management (Aurora PostgreSQL) – The cluster cache management feature of Aurora PostgreSQL makes sure that a reader node specified as the primary failover node in a cluster maintains a buffer pool similar to the writer. This allows for better performance of the new writer in the event of a failover. In order for the reader to maintain a similar set of pages in its buffer pool, it needs to periodically read from the storage volume. This activity results in increased read I/O activity for that instance.
General best practices
The following are best practices when planning I/O in Aurora:
- Review indexes:
- Remove unused indexes, because all indexes add to the volume of write I/O.
- Create new indexes to address table scans or other high I/O activities.
- For primary keys, use an auto-incrementing integer for the key value.
- Consider the appropriate fill factor when creating tables and indexes.
- Use covering indexes when possible.
- Use partitions when practical to minimize pages analyzed for certain queries.
- Identify poorly performing queries:
- Use tooling such as Amazon RDS Performance Insights to identify poorly performing queries.
- Examine the run plans of queries with high I/O waits.
- Rewrite high I/O wait queries or create appropriate indexes to support these queries.
- Consider hardware:
- Monitor the buffer cache hit ratio with a target of 99.98% or higher. This metric reflects how often a page is found in the buffer pool rather than reading it from disk.
- If the buffer cache hit ratio is low, consider using an instance type with more memory.
- Scaling to a larger instance size, which provides more memory, may reduce overall read I/O for reporting workloads, thereby reducing overall I/O cost.
- Use built-in Aurora features:
- Take advantage of Aurora’s point-in-time recovery feature rather than using logical exports, which can result in high I/O.
- Creating a clone requires zero I/O as compared to using logical export tools, which must scan the entire database.
Purpose-built databases
It’s important to use the right tools for the right job. Aurora is designed as a high-throughput, massively parallel OLTP system. Aurora excels in handling thousands of connections with hundreds of thousands of queries per second. Those queries generally work on single rows or small sets of rows. Although Aurora has certain capabilities like parallel queries in Aurora MySQL that offer improvements with regard to analytical queries, workloads that are designed around large table scans and large-scale aggregations create a significant number of read IOPS. In this scenario, other tools like Amazon Redshift, Amazon Athena, S3 Select, or even Amazon EMR may be better suited for those workloads. Similarly, for log-centric workloads containing significant writes and rarely any reads, using a combination of tools like Amazon Kinesis Data Firehose in conjunction with Amazon Simple Storage Service (Amazon S3) might be the best fit.
Summary
Aurora is a great tool for handling high-volume, high-throughput OLTP workloads. It was designed from the ground up to run in the cloud and provides highly available, highly scalable, and highly durable storage. This storage enables you to save money by running the right workloads and sizing their instances appropriately.
About the Authors
 Rajesh Matkar is a Principal Partner Database Specialist Solutions Architect at AWS. He works with AWS Technology and Consulting partners to provide guidance and technical assistance on database projects, helping them improve the value of their solutions.
 Steve Abraham is a Principal Solutions Architect for Amazon Web Services. He works with our customers to provide guidance and technical assistance on database projects, helping them improving the value of their solutions when using AWS.