AWS Database Blog
Optimizing and tuning queries in Amazon RDS PostgreSQL based on native and external tools
January 2024: This post was reviewed and updated for accuracy.
PostgreSQL is one of the most popular open-source relational database systems. The product of more than 30 years of development work, PostgreSQL has proven to be a highly reliable and robust database that can handle a large number of complicated data workloads. PostgreSQL is considered to be the primary open-source database choice when migrating from commercial databases such as Oracle.
AWS offers services that make PostgreSQL database deployments easy to set up, manage, and scale for the cloud in a cost-efficient manner. These services are Amazon RDS for PostgreSQL and Amazon Aurora with PostgreSQL compatibility.
Database performance depends on many factors at the application level, as well as hardware such as CPUs and memory. This post targets one of the key performance factors: query performance. Query slowness is a common issue in most environments. This post discusses the following:
- How to find out which queries are slow, using native database tools.
- How to use Amazon RDS Performance Insights to find performance issues.
- How to fix slow queries.
Identifying slow queries and tuning for better performance is an important task for developers and DBAs managing RDS and Amazon Aurora PostgreSQL environments.
PostgreSQL provides a number of tools to identify slow queries, such as the popular pgBadger. pgBadger is a PostgreSQL log analyzer built for speed with full reports from PostgreSQL log files. It’s a small Perl script that outperforms any other PostgreSQL log analyzer. To use this tool to generate reports, you must set log levels accordingly.
The following logical diagram describes how to use pgBadger. You need an Amazon EC2 instance to download PostgreSQL logs and generate pgBadger reports.
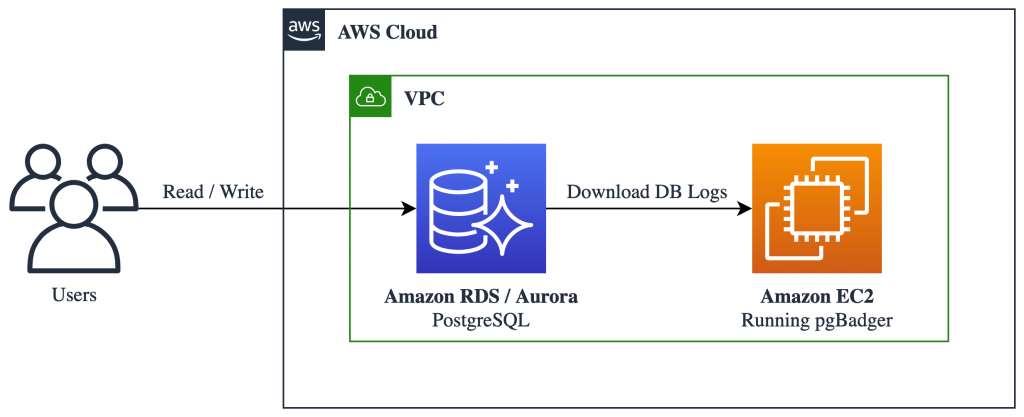
The following walkthrough shows how to identify slow queries using pgBadger.
Prerequisites
Create a new parameter group with logging parameters for pgBadger.
pgBadger works on log files, and it must parse certain information to build a report. Your database must be configured to capture the information that pgBadger requires.
First, set the following parameters. You can find more information on these parameters in Working with PostgreSQL Parameters and the Error Reporting and Logging.
Enabling these parameters may create load to write into log files and use space for log files. You do not need to set these parameters on a permanent basis; you may do so only when necessary, such as when you want to analyze the performance of your database. Roll back the settings after you fix the issue.
Next, create an RDS or Aurora PostgreSQL-Compatible instance by following the steps for creating and connecting to a PostgreSQL database. Make sure to choose the parameter group that you created in the previous step when creating the instance.
Downloading the logs to generate a report
You can see the Postgres logs under the Logs & events tab when you select your RDS or Aurora instance in the AWS Management Console, as shown in the following screenshot.
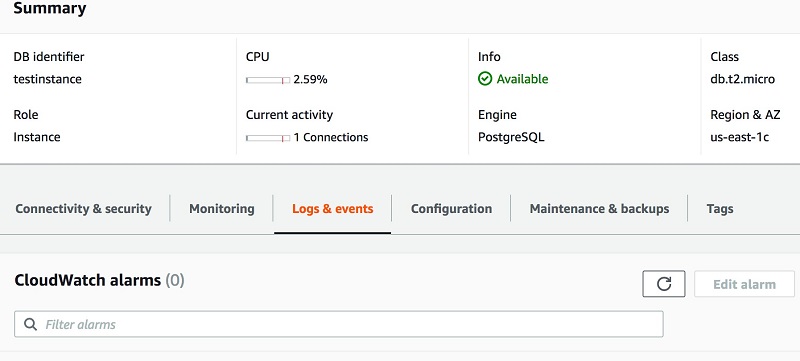
- Download a log file to your local machine or an Amazon EC2 instance to generate a report.
- Choose Logs & events.
- Under Logs, select the log file to download.
- Choose Download.
- You can download the log files using the AWS CLI command download-db-log-file-portion. For example:
- You can now publish logs from Amazon Aurora with PostgreSQL Compatibility database instances to Amazon CloudWatch Logs in Amazon RDS. For more information, see Publishing Aurora PostgreSQL Logs to Amazon CloudWatch Logs.
Generate the report
This example creates a sample database with employee information.
To generate a report on a downloaded log file:
- Download the pgbadger repository.
- Unzip the pgBadger file and find the
pgbadgerbinary inside the unzipped directory. - Use the following command to generate a pgBadger report on the downloaded log file.
-pis for the customlog_line_prefixparameter value (RDS has a fixed value as %t:%r:%u@%d:[%p]:).-ois for the output HTML file.
- When you open the HTML report, it should look like the example in the following screenshot.
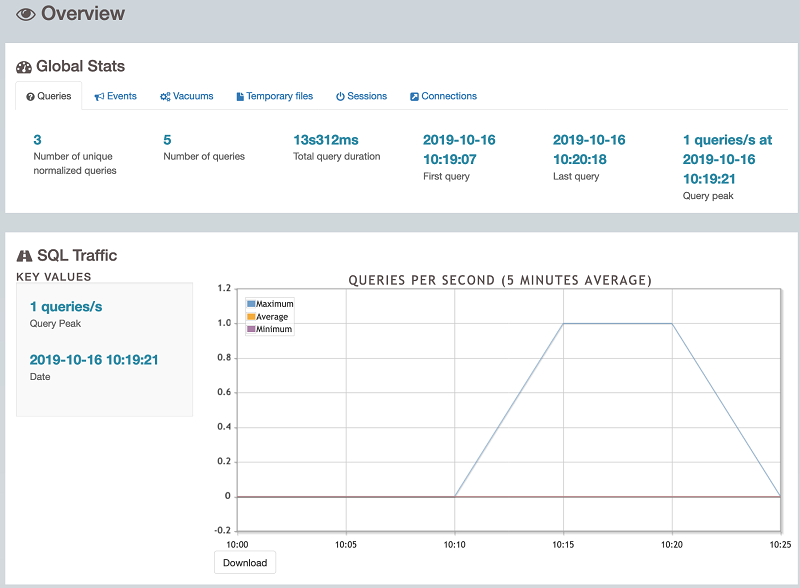
The HTML report contains information about the number of queries and unique queries, the total query execution time, SQL traffic such as number of queries per second, and more.
- Slow running queries are shown under Time Consuming queries (N) in the Top section, as shown in the following screenshot. From there, you can start troubleshooting the slow queries.
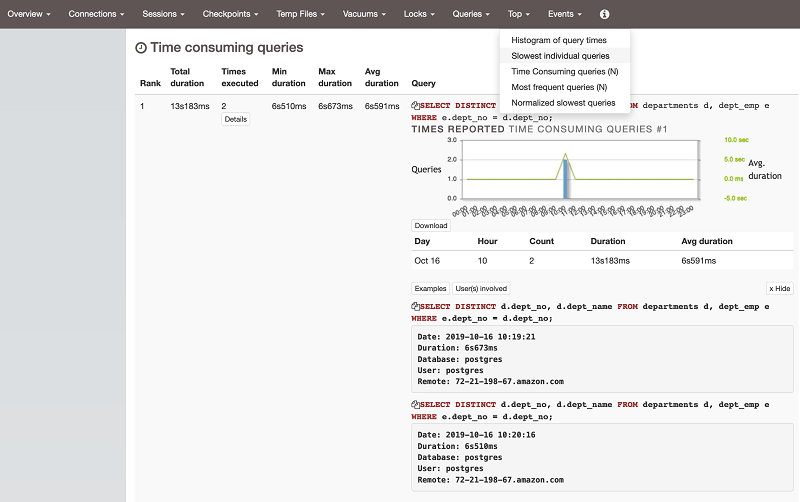
pgBadger reports information about your SQL queries, such as the most frequent waiting queries, the most frequent queries, a histogram of query and session times, and the users involved in the top queries.
There is also information in graphical form, such as pie charts about the distribution of lock statistics, and queries by type (select/insert/update/delete).
All charts are zoomable and can be saved as PNG images. The SQL queries reported are highlighted and beautified automatically.
Diagnosing slowness
Take a slow query from the report and analyze it:
- Why was the query slow?
- Can the query be tuned? If so, how?
Finding the cause of the slowness
Using AWS Performance Insights
For tuning and monitoring RDS and Aurora database instances, AWS recently released a feature called Amazon RDS Performance Insights, which provides an easy-to-understand dashboard for detecting performance problems in terms of load.
You can enable Performance Insights while creating the instance or modifying the instance.
To look at Performance Insights metrics, choose Performance Insights on the left panel of your Amazon RDS databases.
The Performance Insights dashboard is shown in the following screenshot.
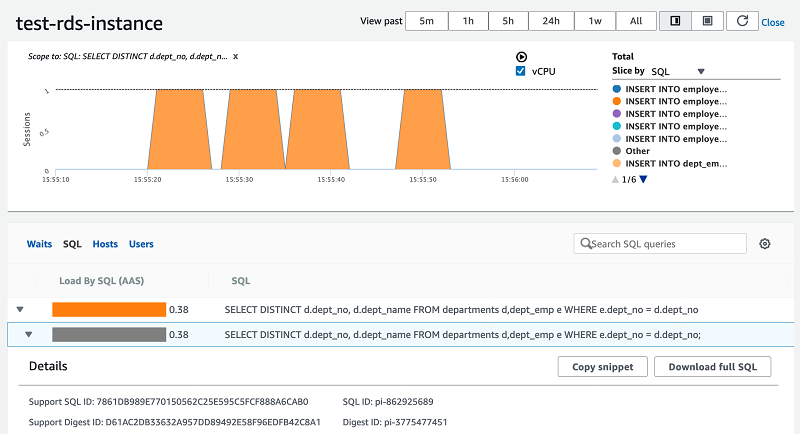
You can monitor SQL queries that caused load, I/O waits, and the users and hosts through which the queries ran.
As you can see in the previous screenshot, the same SQL query has been reported as consuming the most CPUs.
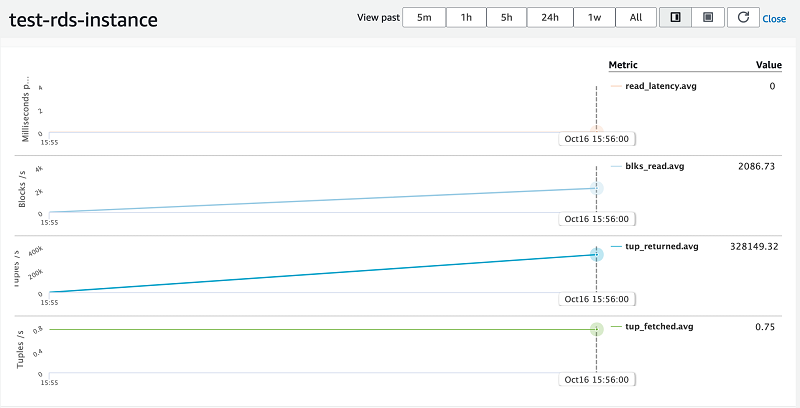
Performance Insights supports counter metrics for RDS PostgreSQL. Counter metrics allow you to customize your Performance Insights dashboard to include up to 10 additional graphs from the available operating system and database metrics. It is helpful to identify and analyze performance issues by correlating load charts.
Performance counter metrics are native and non-native: native metrics are defined by the database engine and not by Amazon RDS, while non-native counter metrics are counters defined by Amazon RDS.
As you can see in the following screenshot, counter metrics are updated with tuples fetched, tuples returned, blocks latency, and blocks read.
Summary
This post explained native and AWS tools for finding slow queries in a database, and described how to fix them. The pgBadger tool is based on PostgreSQL log files, so logging should be enabled for pgBadger to parse and create reports. Performance Insights is an AWS feature that shows database and OS information pinpointing where a query is slow (due to I/O, load, or CPUs). Performance Insights has counter metrics that give additional information about what is happening in the background while queries are running.
Unlike Performance Insights, pgBadger requires you to enable all logging (as described in the Prerequisites section) to get the report. Missing logging leads to partial report generation. Also, pgBadger requires a server or EC2 instance to download the logs and generate a report. With Performance Insights counter metrics, you have good visibility into CPU, load, and I/O wait stats, as well as database stats.
About the Authors
 Baji Shaik is an Associate Consultant with the AWS ProServe team in India. His background spans a wide depth and breadth of expertise and experience in SQL/NoSQL database technologies. He has architectured and designed many successful database solutions addressing challenging business requirements. He has provided solutions using PostgreSQL for reporting, business intelligence, data warehousing, applications, and development support. He also has a good knowledge of automation, orchestration, and DevOps in cloud environments.
 Domenico di Salvia is a Senior Database Specialist Solutions Architect at AWS. In his role, Domenico works with customers in EMEA region to provide guidance and technical assistance on database projects, helping them improve the value of their solutions when using or migrating to AWS, designing scalable, secure, performant, sustainable, cost-effective and robust database architectures in the AWS Cloud.
Audit History
Last reviewed and updated in January 2024 by Domenico di Salvia | Sr. RDS PostgreSQL Solutions Architect