AWS for Industries
How to Run What-if Scenarios for Trading Strategies with Amazon FinSpace
Introduction
In an earlier blog post, we described an architecture for backtesting machine learning-based trading strategies on AWS. One of the key components in this architecture is the data management and analytics component.
Depending on the specific use case, there are various options to implement this. Many companies adopt solutions based on data lakes and more recently on Lake House Architectures. Whatever approach is chosen, the solution needs to cover the following main functional areas: data management, data governance, data analytics, and machine learning. For the development of machine learning models, capabilities like data exploration and data preparation are required. On top of that, customers need more sophisticated tools to query and combine financial data from various sources and an easy way to work with indicators and financial time series data.
With the launch of Amazon FinSpace, this becomes a lot easier as the heavy lifting for setting up a secure and scalable data management and analytics platform for financial data is no longer required, and customers can leverage a managed service. Amazon FinSpace includes also a library of 100+ functions, like time bars and Bollinger bands, to prepare data for analysis and machine learning.
One common method for analysts (including quants) to get insights from data is to perform what-if scenarios; this is widely used to explore the potential outcomes and risk of a mathematical model that is analyzed. When applied to trading strategies, what-if scenarios allow analysts to compare the historical performance (measured as Profit and Loss (PNL), Sharpe Ratio, or other) for different strategy configurations and to use machine learning models for trade decisions. Additional scenarios can cover different time frames (such as end of day prices versus one-minute aggregated price data) or strategies that rely also on alternative data or news information.
Regarding strategy configuration, considering a statistical approach like Moving Average Convergence Divergence (MACD), configuration would take into account the number of periods to consider for each moving average, while, with a machine learning-based approach, that would consider the machine learning algorithm, the features or the hyper parameters used for training.
In this blog post, we revisit the backtesting of trading strategies with Amazon FinSpace and expand the functionality for running what-if scenarios.
Workflow
The following diagram shows the high-level workflow of the solution described in this blog.

Figure 1: Solution high level functional workflow
- Load data: Financial data is loaded and made available for exploration.
- Prepare data: Data is prepared for model training and the backtesting.
- Model training: Different approaches are available. For example, a single ML algorithm can be used with different configurations, different machine learning algorithms can be used with similar configurations, or a mixed approach can be chosen. Whichever approach is used, one strategy will be created for each instance and is used in the next step.
- Backtest strategies: Each strategy is tested on historical financial time series data.
- Benchmark strategies: For each strategy configuration, we calculate performance metrics.
- What-if output: Once all strategy configurations are tested, we select the configuration with the best risk/reward metric.
Architecture
The following image shows the high-level architecture. We use a Jupyter notebook and the managed Spark cluster that is provided by Amazon FinSpace.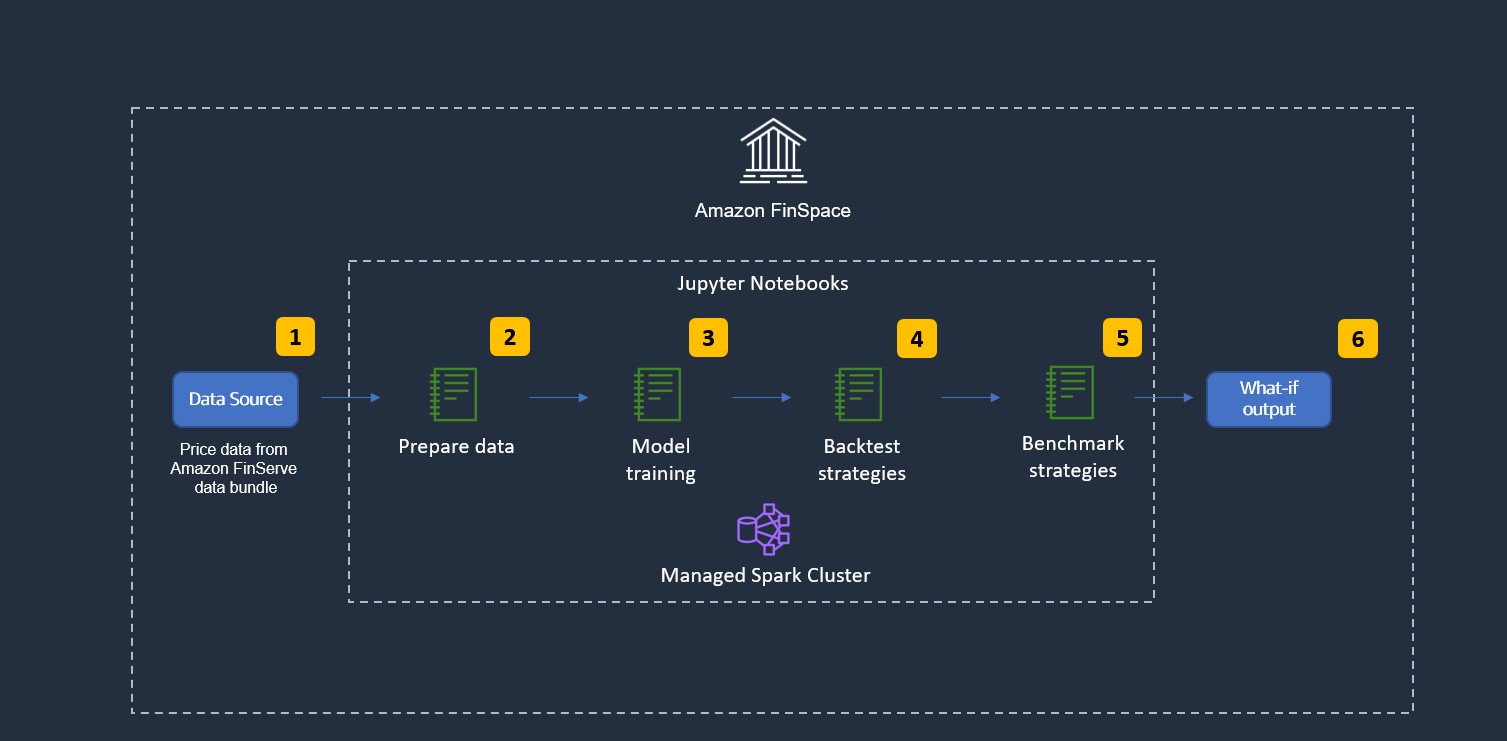
Figure 2: Solution high level technical workflow
- Load data: We load one-minute granular equity price data that is provided as part of the Capital Markets Sample Data Bundle, which is an additional item to install into Amazon FinSpace environments from the AWS Management Console.
- Prepare data: We quickly analyze and prepare the dataset for model training and backtesting and use one of the Amazon FinSpace functions to calculate Exponential Moving Average (EMA).
- Model training: We use Spark ML to train multiple Random Forest machine learning algorithms.
- Backtest strategies: We use the Backtrader framework for the actual backtesting, then each strategy is run for all scenarios.
- Benchmark strategies: In order to benchmark the different strategy configurations we calculate Profit and Loss (PNL) for each configuration.
- What-if output: Once the benchmark is completed, we output the best strategy configuration (according to PNL).
Some of the main characteristics of this architecture are:
Modularity and extensibility: This solution is agnostic to data, strategy, and strategy configurations used. You can change any of these and use your own as required; for example, we used PNL to score the best model, but you can use other metrics as well. This solution can also be extended to cover additional requirements, like managing different kinds of data, such as news data, in addition or instead of price data. This can be done by leveraging other purpose-built AWS services.
Elasticity: This solution can be quickly adapted to changing demand needs (compute power and storage) and it enables you to easily and programmatically change Spark resources as described in the “Working with Spark Clusters” guide. This is a key aspect when designing a hybrid cloud solution, where you want to keep part of the workload or data on-premises while leveraging cloud solution to meet demand spikes.
Security and Compliance: This solution is designed to comply with a comprehensive security model and to provide specific security features. Some examples of security features are data encryption (in transit and at rest), identity options, including SAML-based SSO and auditability, using AWS CloudTrail logs and Audit reports available in the Amazon FinSpace web application. More details about security model and security features can be found in Amazon FinSpace security guide.
Interoperability: The solution described in this blog uses standard PySpark language and leverages the Amazon FinSpace Time Series APIs, which are only available from Amazon FinSpace Spark clusters. The compatibility with Spark allows you to reuse existing Spark solutions you already have, in order to leverage elasticity or integration with other AWS services (such as AI Services for fraud detection or text/document analysis). It also provides APIs that you can use to integrate Amazon FinSpace with your applications running on AWS or on-premises, effectively enabling hybrid cloud options.
Step-by-Step Instructions
This section guides you through the steps for setting up the Amazon FinSpace environment and for installing the sample data.
- An AWS account is required to proceed, if you do not have an AWS account you can open a new one.
- Log into your AWS account and go to Amazon FinSpace landing page.
- Follow the “Create an Amazon FinSpace Environment” guide to create an Amazon FinSpace environment and a superuser. When you reach the step to select an authentication method for the environment, select “Email and password,” unless you need to use single sign-on.
- Log into your environment domain using the credentials you received via email when you created your superuser account. You can find the environment domain URL in the environment section of the Amazon FinSpace menu.
- Once you are logged in, install the Capital Markets sample data bundle, as explained in the “Sample Data Bundle” guide. Once the sample data bundle is installed, your Amazon FinSpace will look like the following image. If you want to become familiar with Amazon FinSpace you might want to check “Using the Amazon FinSpace Homepage.”
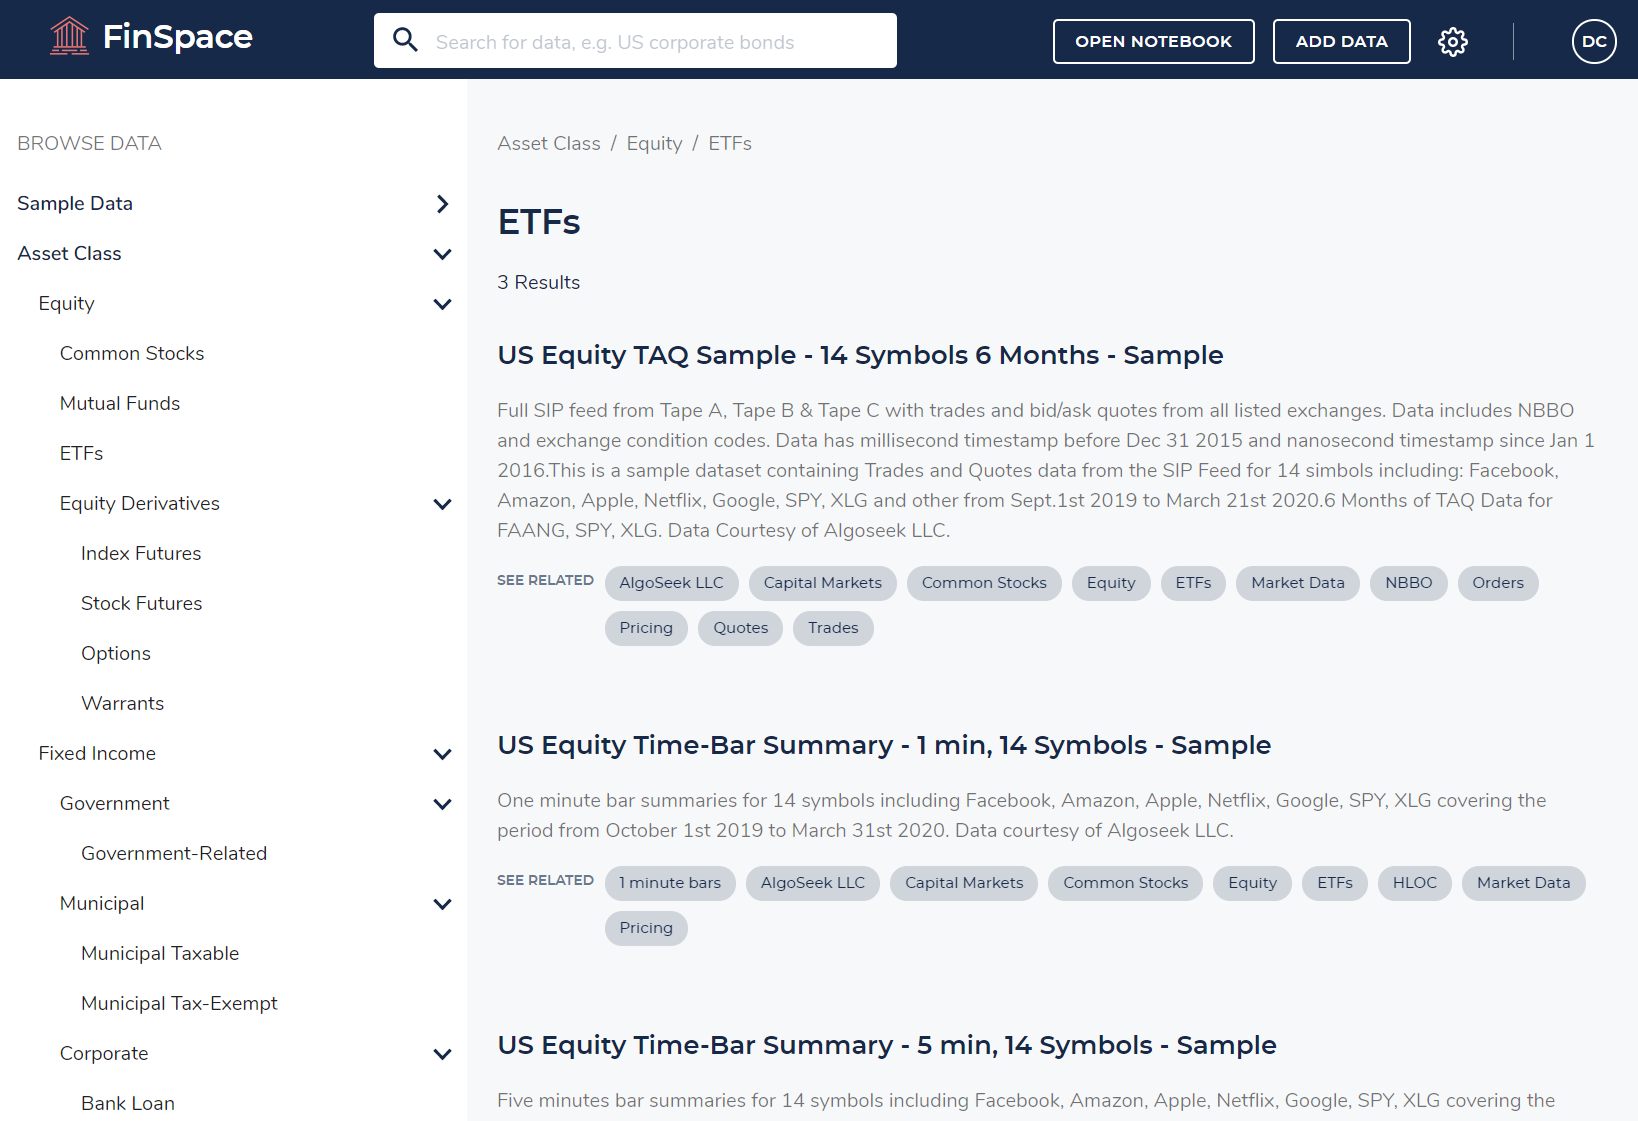
- Use the search bar at the top of the window to search for “US Equity Time-Bar Summary – 1 min, 14 Symbols – Sample” data sample. Search and click on it in the search results list. You’ll see a page like the following.
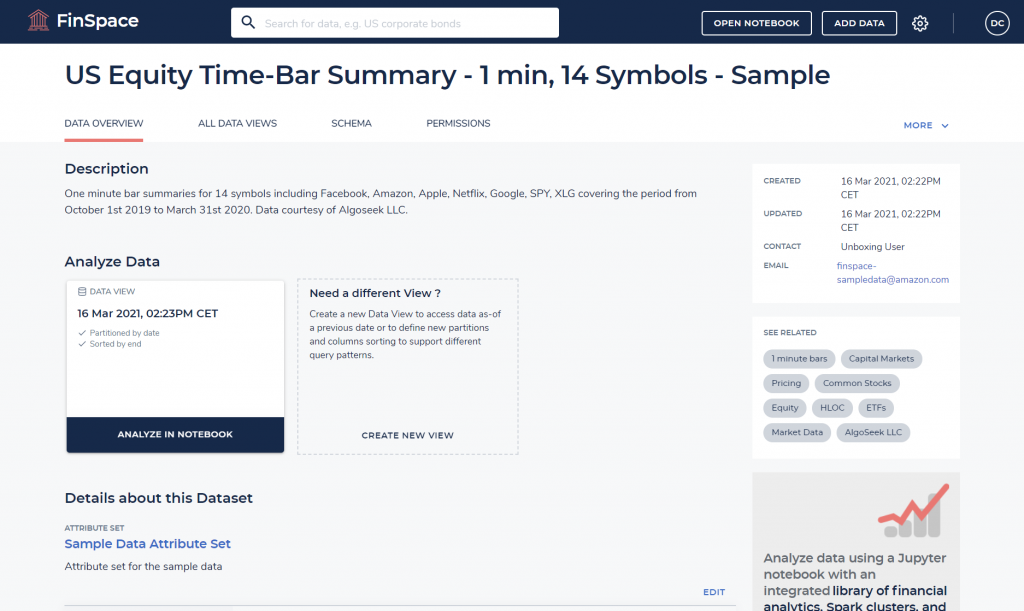
- From here, you can see dataset details such as schema, attributes, and permissions. You can change the dataset configuration and create additional views.
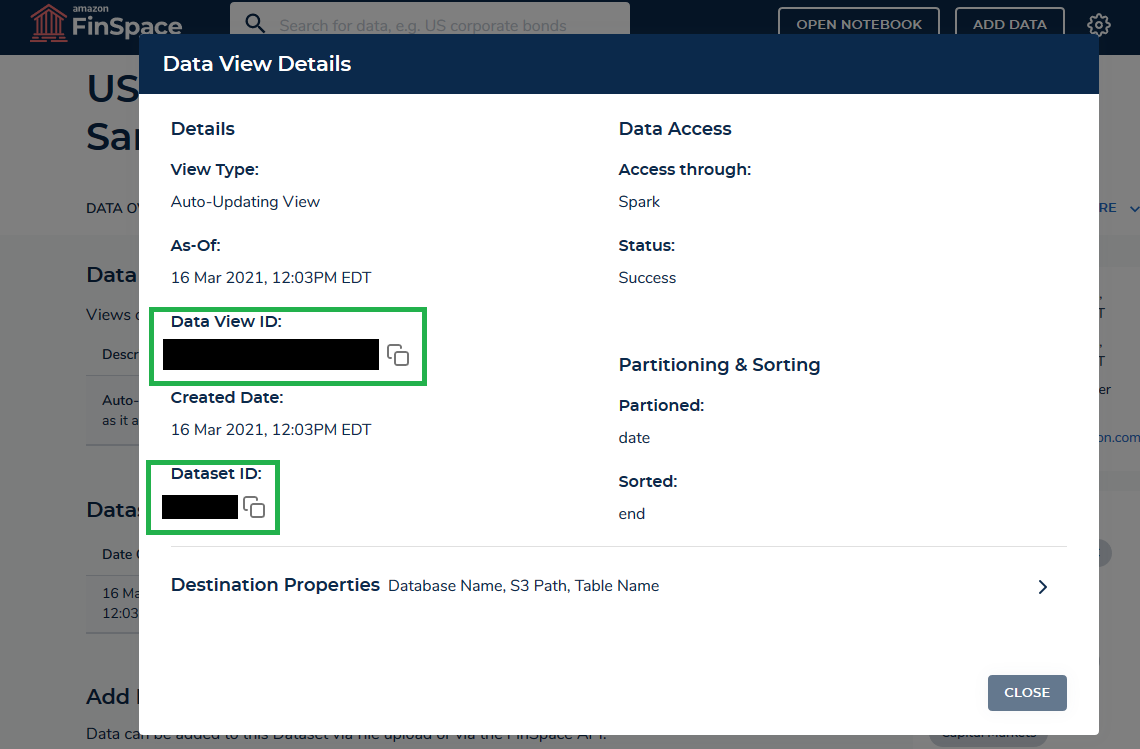
- Click on the tab “ALL DATA VIEWS,” then click on the link “Details” next to the data view. This will show the following information.
- Take note of data_view_id and dataset_id. We need these details later in our Jupyter notebook.
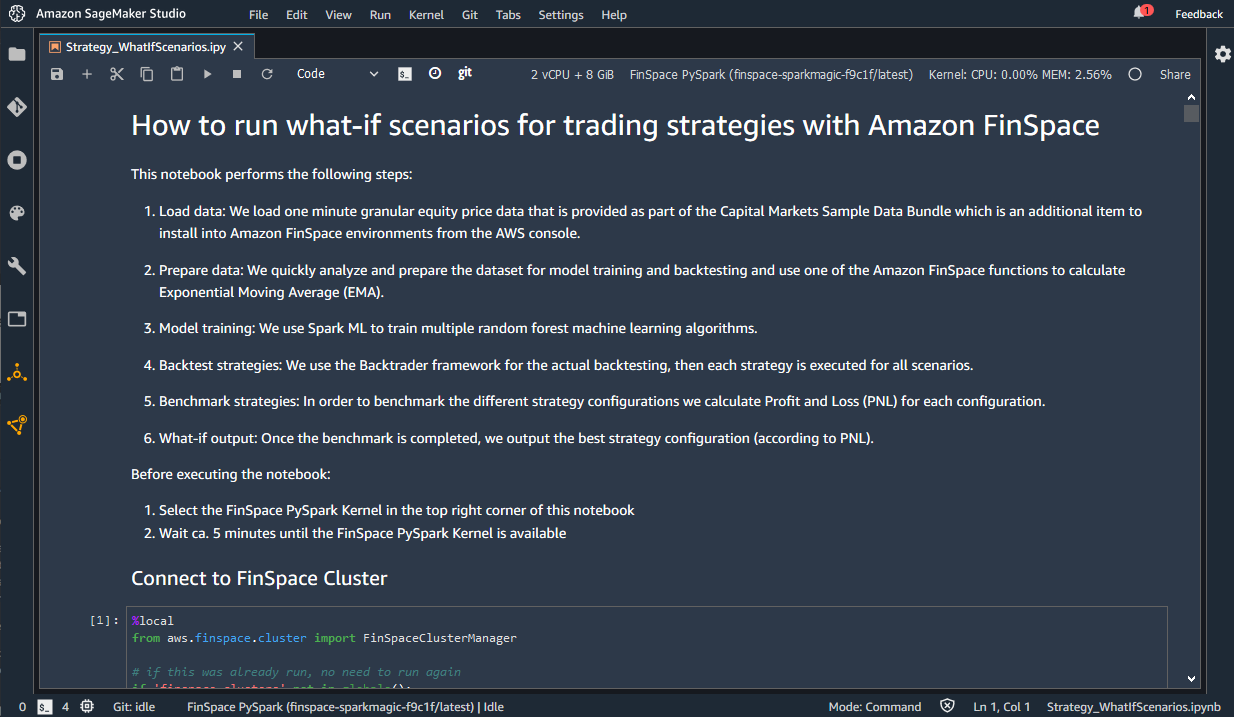
For the purposes of this blog, we use another pre-built notebook to run the what-if analysis solution described previously.
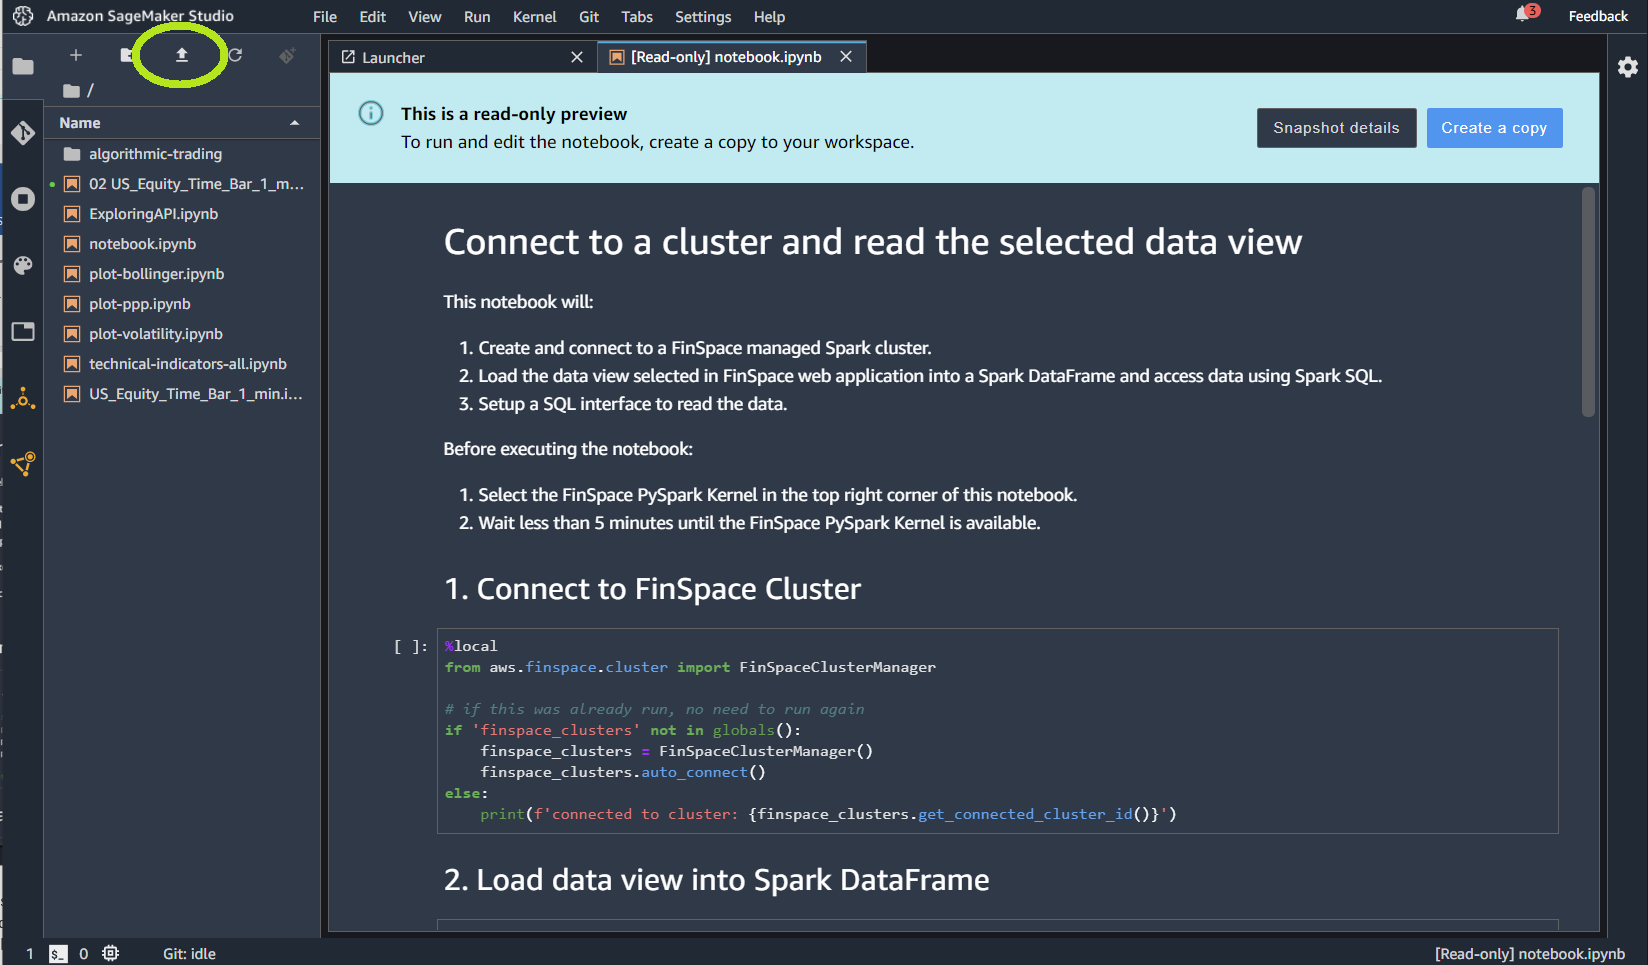
- Download this notebook from this GitHub repo and upload it on your environment using the upload icon highlighted in the following image.
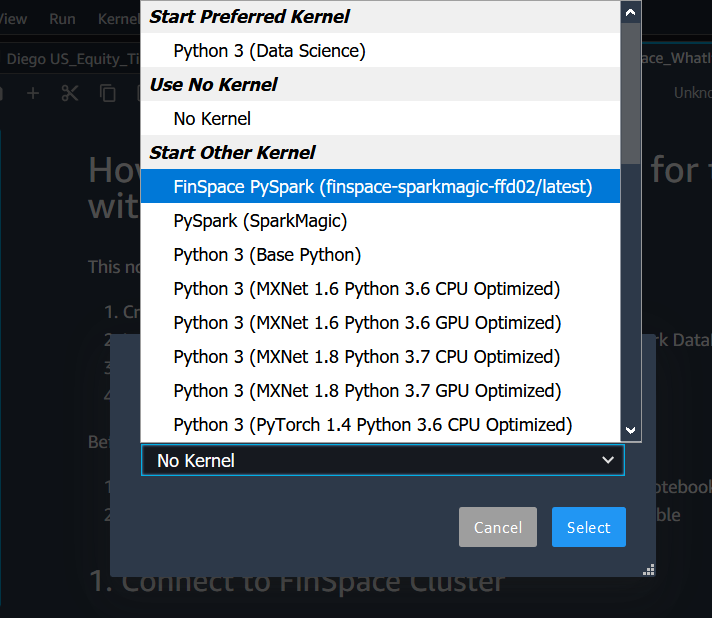
- Once the notebook is uploaded, a pop-up should ask for the kernel that should be used. If not, click on the “No Kernel” button to select a kernel.
- Select “FinSpace PySpark” kernel.
This section guides you through the steps in the Jupyter notebook that performs the what-if analysis with Amazon FinSpace.
- In the “Load data” section, specify the dataset_id and data_view_id that we noted earlier.
- In the “Prepare data” section, you can modify the date range you want to use for backtesting and model training. Shorter time ranges lead to shorter model training time, but usually reduce the model performance on unseen data.
- In the “Model Training” section, we train multiple Random Forest models with different parameters via Spark ML. We use historical price data and EMA (Exponential Moving Average) as features and use VWAP (Volume Weighted Average Price) in five minutes from the current time as the label for our machine learning problem. For sake of simplicity, we don’t perform comprehensive data exploration and feature engineering and use this dataset in a Random Forest algorithm for training. A Random Forest algorithm can benefit from a cluster for parallel computation and we train three models with different hyperparameters. If you want to further improve model performance, we suggest starting with the enhancement of data preparation and feature engineering. You can also explore the Amazon FinSpace built-in technical indicators (like MACD, Bollinger Bands, RSI); the complete list is available on this notebook, which provides sample code as well. For hyperparameter tuning, you can experiment with common scikit-learn functions like GridSearchCV or RandomizedSearchCV.
- In the “Backtest strategies” section, we import and configure Backtrader, which is a Python framework for backtesting of trading strategies. We also define helper classes for calculating various trading performance metrics and for feeding data from Amazon FinSpace into the backtesting engine. Our trading strategy is a simple machine learning-based trading strategy that goes long if the model predicts a higher price than the current price and goes short if the model predicts a lower price.
- In the “Benchmark strategies” section, we create different strategy configurations (using the previously trained models) and feed them to our backtesting engine. For all strategy configurations, we capture the PNL.
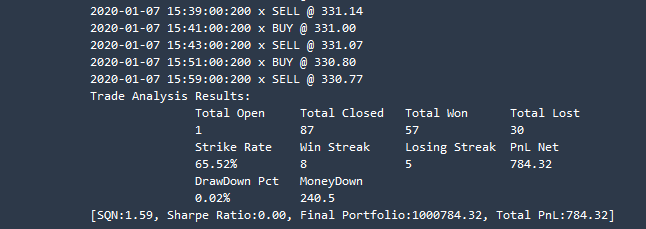
- In the last section “What-if output,” you get the following output and the strategy configuration with the best PNL is shown.
Clean Up
The following procedure shows how to clean up resources to avoid incurring unwanted costs. Be aware that when you delete an environment, you’re deleting all the assets (Jupyter notebooks, data) that you have in that environment.
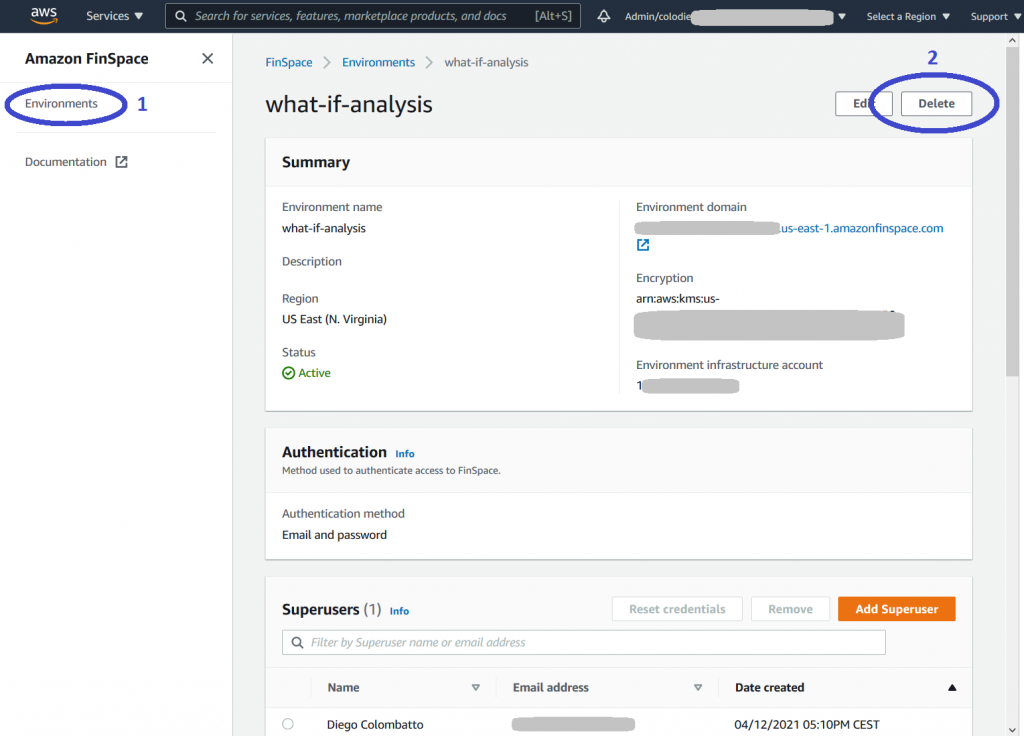
- Go to Amazon FinSpace landing page and select Environments
- Click on environment name and then click the “Delete” button, as shown in the following image. Repeat the previous steps for each environment you have created.
Additionally, if you want to prevent unwanted expenses, you can see how to track your AWS costs and configure alerts by following the Control your AWS costs tutorial.
Conclusion
In this blog post, we demonstrated how to perform what-if analysis on trading strategies with Amazon FinSpace by performing the following tasks: import financial data from Amazon FinSpace sample data bundle, perform data preparation using a fully managed Spark cluster, train ML models implementing different trading strategies, run backtesting of trading strategies, and complete what-if analysis providing a benchmark of strategy performance.
The solution described in this blog can be used as a foundation and you can personalize it using your own strategy and configurations. You can also use other datasets available in Amazon FinSpace or load your own datasets.
We welcome any feedback on possible extensions and additional use cases you would like to see.
This post is for educational purposes only. Past trading performance does not guarantee future performance.
You can find more information on Amazon FinSpace documentation and ready-to-use Jupyter notebooks on Amazon FinSpace GitHub.