AWS Database Blog
Monitoring best practices with Amazon ElastiCache for Redis using Amazon CloudWatch
Last updated: July/2023
Monitoring is an important part of maintaining the reliability, availability, and performance of your Amazon ElastiCache resources. This post shows you how to maintain a healthy Redis cluster and prevent disruption using Amazon CloudWatch and other external tools. We also discuss methods to anticipate and forecast scaling needs.
Benefits of using CloudWatch with ElastiCache
ElastiCache provides enhanced visibility via CloudWatch into key performance metrics associated with your resources. Additionally, CloudWatch alarms allow you to set thresholds on metrics and trigger notifications to inform you when preventive actions are needed.
Monitoring trends over time can help you detect workload growth. Datapoints are available for up to 455 days (15 months) and the takeaways from observing the extended time range of CloudWatch metrics can help you forecast your resources utilization.
Monitoring your resources
The health of your ElastiCache Redis cluster is determined by the utilization of critical components such as the CPU, memory, and network. Over-utilization of these components may result in elevated latency and overall degraded performance. Under-utilization, on the other hand, may result in over-provisioned resources that can be cost-optimized.
ElastiCache provides metrics that enable you to monitor your clusters and, as of this writing, has recently released 18 additional CloudWatch metrics.
CloudWatch metrics for ElastiCache are divided into two categories: engine-level metrics (generated from the Redis INFO command) and host-level metrics (which come from the operating system of your ElastiCache node). These metrics are measured and published for each cache node in 60-second intervals. Although CloudWatch allows you to choose any statistic and period for each metric, not all combinations are useful. For example, the Average, Minimum, and Maximum statistics for CPU usage are useful, but the Sum statistic is not.
CPUs
Redis can use different CPUs for side operations such as snapshots or UNLINK, but is single-threaded when running commands. In other words, one command is processed at a time.
Because Redis is single-threaded, ElastiCache offers the EngineCPUUtilization metric to provide more precise visibility into the load of the Redis process itself and, in turn, better clarity into your Redis workload.
The tolerance to high EngineCPUUtilization differs for every use case and there is no universal threshold. However, as a best practice, make sure your EngineCPUUtilization is always below 90%.
Benchmarking your cluster using your application and expected workload can help you correlate EngineCPUUtilization and performance. We recommend setting multiple CloudWatch alarms at different levels for EngineCPUUtilization so you’re informed when each threshold is met (for example, 65% WARN, 90% HIGH) and before it impacts performance.
If the EngineCPUUtilization of your cluster is high, you can consider the following steps for remediation:
- A high
EngineCPUUtilizationmetric might be caused by specific Redis operations. Redis commands have a time complexity defined using the Big O notation. You can use the Redis SLOWLOG to help you determine which commands took longer to complete. An example is the excessive usage of the Redis KEYS command, which you should use with extreme care in a production environment.- You can use Log delivery to stream SLOWLOG to Amazon Kinesis Data Firehose or Amazon CloudWatch Logs.
- In relation to the Redis commands time complexity, a non-optimal data model can cause unnecessary
EngineCPUUtilization. For example, the cardinality of a set may be a factor of performance, SMEMBERS, SDIFF, SUNION, and other set commands have a time complexity defined by the number of elements in the set. The size of a hash (number of fields) and the type of operations run also factor into theEngineCPUUtilization. - If you’re running Redis in a node group with more than one node, it’s recommended to use a replica to create snapshots. While the snapshot is being created from the replica, the primary node remains unaffected by this task and can continue serving requests without slowing down. Verify if the node is creating a snapshot with
SaveInProgress. Snapshots are always on the primary node in case of full synchronization. For more information, see Performance Impact of Backups. - A high volume of operations may also cause a high
EngineCPUUtilization. Find out the type of operation driving the load. If read operations are mostly causing a highEngineCPUUtilization, make sure you’re using the existing read replica for your read operations. It needs to be configured in your Redis client library using the ElastiCache reader endpoint for cluster mode disabled, or the Redis READONLY command for cluster mode enabled. If you’re already reading from a read replica, you can add additional nodes (up to five read replicas) in your replication group or in each shard. If the write operations are driving highEngineCPUUtilization, you need to provide more compute capacity to the primary nodes. You can upgrade to the latest nodes generation and benefit from the latest processors technology. If you’re already running the latest node generation, you should consider migrating from cluster mode disabled to cluster mode enabled. To achieve this migration, you can create a backup of your existing cluster and restore the data in a new cluster mode enabled cluster. With cluster mode enabled, the solution is to add more shards and scale out. By adding more shards, you add more primary nodes and, consequently, more compute power.
Monitoring the load of the Redis process with the EngineCPUUtilization metric is essential, but you should also watch the remaining CPU cores. With CPUUtilization, you can monitor the percentage of CPU utilization for the entire host. For example, because some processing is needed to establish a connection, a high volume of new connections may lead to a higher CPUUtilization metric. Refer to Best practices: Redis clients and Amazon ElastiCache for Redis to learn more.
For smaller nodes with two or fewer CPU cores, monitoring the CPUUtilization is imperative. Because aside operations such as snapshots and managed maintenance events need compute capacity and share with Redis the CPU cores of the node, the CPUUtilization can reach 100% before the EngineCPUUtilization.
Finally, ElastiCache supports T4g cache nodes. These cache nodes provide a baseline level of CPU performance with the ability to burst CPU usage at any time until the accrued credits are exhausted. If you’re using T4g cache nodes, you need to monitor CPUCreditUsage and CPUCreditBalance because performance is gradually lowered to the baseline level when CPU credits are consumed. For more information, see CPU Credits and Baseline Performance for Burstable Performance Instances.
ElastiCache for Redis 7 and above now includes enhanced I/O multiplexing, which delivers significant improvements to throughput and latency at scale. Enhanced I/O multiplexing is ideal for throughput-bound workloads with multiple client connections, and its benefits scale with the level of workload concurrency. Refer to New for Amazon ElastiCache for Redis 7: Get up to 72% better throughput with enhanced I/O multiplexing to learn more.
Memory
Memory is a core aspect of Redis. Understanding the memory utilization of your cluster is necessary to avoid data loss and accommodate future growth of your dataset.
Statistics about the memory utilization of a node are available in the memory section of the Redis INFO command.
One of the most important metrics is used_memory, the memory allocated by Redis using its allocator. CloudWatch provides a metric called BytesUsedForCache derived from used_memory. You can determine the memory utilization of your cluster with this metric.
With the release of the 18 additional CloudWatch metrics, you can now use DatabaseMemoryUsagePercentage and see the percentage of memory utilization, based on the current memory utilization (BytesUsedForCache) and the maxmemory. Maxmemory sets the maximum amount of memory for the dataset. The maxmemory of your cluster is available in the memory section of the Redis INFO command and Redis Node-Type Specific Parameters. These default values are subject to the reserved memory. Because of this, the maxmemory of your cluster is reduced. For example, the cache.r5.large node type has a default maxmemory of 14037181030 bytes, but if you’re using the default 25% of reserved memory, the applicable maxmemory is 10527885772.5 bytes (14037181030×.75).
When your DatabaseMemoryUsagePercentage reaches 100%, the Redis maxmemory policy is triggered and, based on the policy selected (such as volatile lru), evictions may occur. If no object in the cache is eligible for eviction (matching the eviction policy), the write operations fail and the Redis primary node returns the following message: (error) OOM command not allowed when used memory > 'maxmemory'.
Evictions aren’t necessarily indicative of an issue or degraded performance. Some workloads expect or rely on evictions. To monitor the volume of evictions in your cluster, you can use the Evictions metric. This metric is also derived from the Redis INFO command. High volumes of evictions generally lead to high EngineCPUUtilization.
If your workload isn’t designed to experience evictions, the recommended approach is to set CloudWatch alarms at different levels of DatabaseMemoryUsagePercentage to be proactively informed when you need to perform necessary scaling actions and provision more memory capacity. For cluster mode disabled, scaling up to the next available node type provides more memory capacity. However, for cluster mode enabled, scaling out to progressively increase the memory capacity is the most appropriate solution.
Another method to control the growth of your dataset is to use a TTL (time to live) for your keys. When the time to live expires, the key isn’t served and is deleted if a client tries to access it (passive way), or when Redis periodically tests random keys (active way). You can use the Redis SCAN command to parse parts of the dataset and amplify the passive method to delete expired keys (for more information, see EXPIRE). In ElastiCache, key expiration is monitored with the Reclaimed CloudWatch metric.
When performing a backup or failover, Redis uses additional memory to record the write operations to your cluster while the cluster’s data is being written to the .rdb file. If this additional memory usage exceeds the node’s available memory, processing can become slow due to excessive paging and SwapUsage. This is why we recommend using reserved memory. Reserved memory is memory set aside for the specific purpose of accommodating operations such as backup or failover. For more information, see Managing Reserved Memory.
The FreeableMemory CloudWatch metric being close to 0 (for example, below 100MB) or SwapUsage metric greater than the FreeableMemory metric indicates a node is under memory pressure.
Network
One of the determining factors for the network bandwidth capacity of your cluster is the node type you have selected. For more information about the network capacity of your node, see the supported node types for ElastiCache.
We highly recommend that you benchmark your cluster prior to moving into production in order to assess the performance and set the right threshold in your monitoring. You should run the benchmark several hours to reflect the potential usage of your temporary network bursting capacity.
ElastiCache and CloudWatch provide several host-level metrics to monitor the network utilization, similar to Amazon Elastic Compute Cloud (Amazon EC2) instances. NetworkBytesIn and NetworkBytesOut are the number of bytes the host has read from the network and sent out to the network. NetworkPacketsIn and NetworkPacketsOut are the number of packets received and sent on the network.
After you define the network capacity of your cluster, you project and establish the highest expected spike of network utilization. This spike shouldn’t be higher than the network capacity of the node type you selected. Each node type offers burst capacity, but it’s recommended to keep this extra capacity for unexpected traffic increase.
Refer to Network-related limits to learn more about specific network limits you may hit.
Based on the highest utilization you defined, you can create a CloudWatch alarm to send an email notification when your network utilization is higher than expected or when approaching this limit.
If your network utilization increases and triggers the network alarm, you should take the necessary actions to get more network capacity. To identify the correct action, you need to identify what is driving the network utilization increase. You can use the CloudWatch metrics to detect an increase of operations and classify this increase in the read or write operations category.
If your network utilization increase is driven by read operations, first make sure that you’re using any existing read replica for your read operations. It needs to be configured in your Redis client library using the ElastiCache reader endpoint for cluster mode disabled, or the Redis READONLY command for cluster mode enabled. If you’re already reading from a read replica, you can add additional nodes (up to five read replicas) in your replication group or in your shard.
If the write operations are driving the network utilization increase, you need to provide more capacity to the primary nodes. In cluster mode disabled, you can simply scale up to a larger node type. With cluster mode enabled, the same scale-up operation is available.
Alternatively, cluster mode enabled offers a second option to consider for both reads and writes use cases. This option consists of adding more shards and scaling out. By adding more shards, the dataset is spread across more primaries and each node is responsible for a smaller subset of the dataset, leading to a lower network utilization per node.
Although scaling out addresses most network-related issues, there is an edge case related to hot keys. A hot key is driven by a specific key or subset of keys that are unproportionally and frequently accessed, creating a scenario where an individual shard may experience more traffic than others. These keys generate high network utilization if they remain on the same shard. In this rare example, scaling up is the better option with no change in the existing dataset. Refactoring the data model can also help re-balance the network utilization. For example, you duplicate strings and segment objects storing multiple elements. For more information about spreading out the most frequently accessed keys and their high network consumption across all your cluster’s shards, see Redis Cluster Specification.
Connections
CloudWatch provides two metrics for the connections established to your cluster:
- CurrConnections – The number of concurrent and active connections registered by the Redis engine. This is derived from the
connected_clientsproperty in the Redis INFO command. - NewConnections – The total number of connections that have been accepted by Redis during a given period of time, regardless of whether these connections are still active or closed. This metric is also derived from the Redis INFO command.
To monitor the connections, you need to remember that Redis has a limit called maxclients. ElastiCache’s default and non-modifiable value is 65,000. In other words, you can use up to 65,000 simultaneous connections per node.
Both CurrConnections and NewConnections metrics can help detect and prevent issues. For example, a constant increase of CurrConnections may lead to the exhaustion of the 65,000 available connections. This type of increase may indicate an issue on the application side and connections improperly closed leaving the connection established on the server side. Although you need to investigate the application’s behavior to address this issue, you can also ensure that your cluster is using tcp-keepalive to detect and terminate potential dead peers. The default timer for tcp-keepalive is 300 seconds since Redis 3.2.4. For older versions, tcp-keepalive is disabled by default. You can adjust the tcp-keepalive timer in the cluster’s parameter group.
It’s also important to monitor the NewConnections. However, the maxclient limit of 65,000 doesn’t apply for this metric because it’s the total of connections created during a given time. This doesn’t mean that these connections were simultaneous. One node may receive 100,000 NewConnections during a 1-minute data sample and never reach 2,000 CurrConnections (simultaneous connections). In this particular example, the workload has no risk of reaching the limit of connections Redis can handle. However, the high volume of connections rapidly opened and closed may have an impact on the node’s performance. Creating a TCP connection takes a few milliseconds, which is an extra payload for a Redis operation run by your application.
As a best practice, applications should re-use existing connections to avoid the extra cost of creating a new connection. You can implement connection pooling via your Redis client library (if supported), with a Framework available for your application environment, or build it from the ground.
It’s even more important to control the volume of new connections when your cluster is using the ElastiCache in-transit encryption feature due to the extra time and CPU utilization needed by the TLS handshake.
Replication
The primary node sends a stream of commands to be replicated, given there is at least one read replica. The volume of data being replicated is visible via the ReplicationBytes metric. Although this metric is representative of the write load on the replication group, it doesn’t provide insights into the replication health. For this purpose, you can use the ReplicationLag metric. This offers a very handy representation of how far behind the replica is from the primary node. Starting with Redis 5.0.6, this data is captured in milliseconds. Although rare, you can detect potential issues by monitoring the ReplicationLag metric because spikes of replication lag indicate that the primary node or the replica can’t keep up the pace of the replication. This is an indication that your replica may need to request a full synchronization. This is a more complex process, involving the creation of a snapshot on the primary node, and could lead to performance degradation. You can identify a full synchronization attempt by combining the ReplicationLag metric and the SaveInProgress metric.
High replication lag is generally a side effect of excessive write activity, network capacity exhaustion, or underlying service degradation.
If your write activity is too high for a single primary node with cluster mode disabled, you need to consider a transition to cluster mode enabled and spread the write operations across multiple shards and their associated primaries. If the replication lag is caused by network exhaustion, you can follow the resolution steps from the Network section of this post.
Latency
You can measure a command’s latency with a set of CloudWatch metrics that provide aggregated latencies per data structure. These latency metrics are calculated using the commandstats statistic from the Redis INFO command.
In the following chart, we can see the StringBasedCmdsLatency metric, which is the average latency, in microseconds, of the string-based commands run during a selected time range.
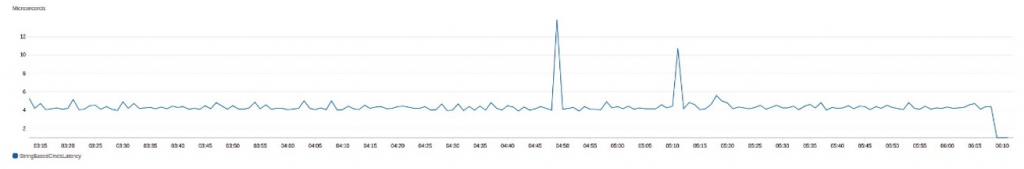
This latency doesn’t include the network and I/O time. This is only the time consumed by Redis to process the operations. For more information about latency metrics, see Metrics for Redis.
If the CloudWatch metrics indicate an increase of latency for a specific data structure, you can use the Redis SLOWLOG to identify the exact commands with the higher runtime.
If your application is experiencing high latency but the CloudWatch metrics indicate a low latency at the Redis engine level, you should investigate the network latency. The Redis CLI provides a latency monitoring tool that can be very helpful to isolate an issue with the network or the application (min, max, and avg are in milliseconds):
Finally, you can also monitor the client side for any activity that could impact the performance of your application and result in increased processing time.
ElastiCache events and Amazon SNS
ElastiCache logs events that relate to your resources, such as a failover, node replacement, scaling operation, scheduled maintenance, and more. Each event includes the date and time, the source name and source type, and a description. You can easily access the events on the ElastiCache console or using the Amazon Command Line Interface (AWS CLI) describe-events command and the ElastiCache API.
The following screenshot shows the events in the ElastiCache console:
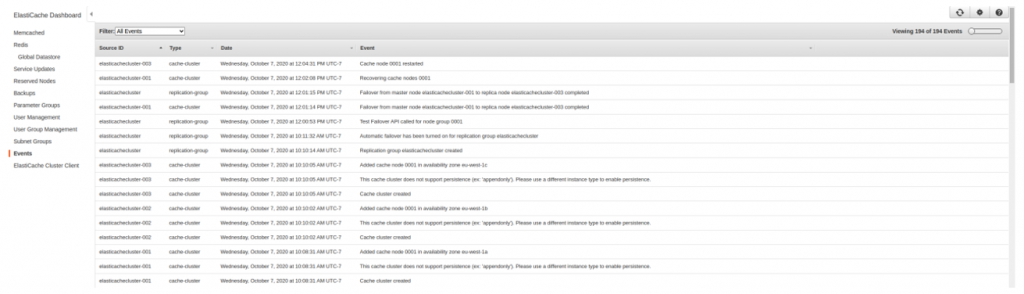
Monitoring events helps you stay informed of the current state of your clusters and, depending on the event, able to take the necessary action. Although ElastiCache events are available via the different implementations already mentioned, we strongly recommend that you configure ElastiCache to send notifications for important events using Amazon Simple Notification Service (Amazon SNS). For more information, see Managing ElastiCache Amazon SNS Notifications.
When adding an SNS topic to an ElastiCache cluster, all important events related to this cluster are published into the SNS topic and can be delivered by email. For more information about the ElastiCache events published for Amazon SNS, see Event Notifications and Amazon SNS.
Using Amazon SNS with your clusters also allows you to programmatically take actions upon ElastiCache events. For example, AWS Lambda functions can subscribe to SNS topics and run if a specific event is detected. For more information, see Monitor Amazon ElastiCache for Redis (cluster mode disabled) read replica endpoints using AWS Lambda, Amazon Route 53, and Amazon SNS.
Summary
In this post, we discussed the most common challenges in terms of ElastiCache Redis resource monitoring, as well as the related best practices. With the knowledge that you have gained throughout this post, you can now detect, diagnose, and maintain healthy ElastiCache Redis resources.
About the author
 Yann Richard is an AWS ElastiCache Solutions Architect. On a more personal side, his goal is to make data transit in less than 4 hours and run a marathon in sub-milliseconds, or the opposite.