A common problem customers face is alerting when their Java-based workloads experience performance issues, such as heap constraints. In this post, I’ll illustrate how relevant metrics from the Java Virtual Machine (JVM) can be collected and sent to Amazon CloudWatch, where customers can define alerts that fire when workloads are in jeopardy.
Overview
Let’s consider a situation where a critical Java application suddenly uses up too much memory and risks running into a java.lang.OutOfMemoryError exception. It would be great if customers could receive a CloudWatch alert before this memory threshold is reached, so that they can take action in time.
Luckily, the JVM exposes runtime metrics, such as the heap memory usage, thread count, and classes, through a standard API interface called the Java Management Extension (JMX). Although it’s possible to collect metrics from the JVM and send them to CloudWatch using the AWS Java SDK (an approach that works great for debugging activities and development), the metrics can’t be namespaced. Without the ability to namespace metrics, the statistics collected from multiple Java applications would overwrite each other’s data points in CloudWatch. As a consequence, this wouldn’t scale well outside of a development setting.
The approach I am presenting in this post is to leverage CollectD – an open-source system statistics collection daemon – which can collect metrics from JMX and send them to the Amazon CloudWatch agent, as well as allows namespacing metrics per application. The CloudWatch agent then forwards the metrics to CloudWatch and records them as custom metrics.
This approach described here can be applied to Java workloads running on the AWS cloud in Amazon Elastic Compute Cloud (Amazon EC2) instances, on hosts and virtual machines that run on-premises, or elsewhere (for container-based workloads, the Prometheus JMX Exporter can be used instead).
Solution Architecture
The following figure illustrates the overall architecture and the interactions between CollectD, the CloudWatch agent, and CloudWatch. The Java application, CollectD and CloudWatch agent are running on the same host (for example on an EC2 instance on AWS or a virtual machine running on-premises).

Figure 1, Services used and architecture.
Process flow:
- CollectD interrogates the JVM to collect JMX statistics (using CollectD
Java and GenerixJMX plugin)
- CollectD sends JMX statistics to the CloudWatch agent (using CollectD
Network plugin)
- Custom metrics are recorded in CloudWatch
The JVM exposes metrics through the JMX API. The JMX API provides a simple, standard way of managing and monitoring Java applications and services. JMX metrics include information like heap memory usage, number of threads, and CPU usage.
CollectD is an open-source system statistics collection daemon that can gather metrics from various sources and external devices, and then store this information or make it available over the network. CollectD features a comprehensive list of plugins – the focus of this post will be on the Java and GenericJMX plugins, which will query relevant metrics from the JVM and send them to the CloudWatch agent.
The CloudWatch agent can be deployed to EC2 instances and also on-premises hosts and virtual machines. The agent can collect internal system-level metrics and also receive metrics from the CollectD statistics collection daemons.
Step one: configure CollectD to push data to the CloudWatch agent
The following steps describe the installation and configuration for Amazon Linux 2. Package names, location of configuration files, and commands may differ on other Linux distributions and systems.
Notes on the notation: shell commands are prefixed with a $ to symbolize the terminal prompt. Enter the commands without the $ into the terminal.
Install CollectD on your system. On Amazon Linux 2, the following packages must be installed:
$ sudo yum -y install collectd collectd-java collectd-generic-jmx
In the CollectD configuration file (/etc/collectd/collectd.conf), enable and configure the network and Java plugins as follows:
LoadPlugin network
<Plugin network>
    Server "127.0.0.1" "25826"
</Plugin>

LoadPlugin java
<Plugin java>
# JVMArg "-verbose:jni"
  JVMArg "-Djava.class.path=/usr/share/collectd/java/collectd-api.jar:/usr/share/collectd/java/generic-jmx.jar"
  LoadPlugin "org.collectd.java.GenericJMX"

  <Plugin "GenericJMX">
    <MBean "Memory">
      ObjectName "java.lang:type=Memory"
      InstancePrefix "java"
      <Value>
        Type "gauge"
        InstancePrefix "java_lang_memory_heapmemoryusage_"
        Table true
        Attribute "HeapMemoryUsage"
      </Value>
    </MBean>

    <MBean "OperatingSystem">
      ObjectName "java.lang:type=OperatingSystem"
      InstancePrefix "java"
      <Value>
        Type "gauge"
        InstancePrefix "java_lang_operatingsystem_maxfiledescriptorcount"
        Attribute "MaxFileDescriptorCount"
      </Value>
      <Value>
        Type "gauge"
        InstancePrefix "java_lang_operatingsystem_openfiledescriptorcount"
        Attribute "OpenFileDescriptorCount"
      </Value>
      <Value>
        Type "gauge"
        InstancePrefix "java_lang_operatingsystem_freephysicalmemorysize"
        Attribute "FreePhysicalMemorySize"
      </Value>
      <Value>
        Type "gauge"
        InstancePrefix "java_lang_operatingsystem_freeswapsizespace"
        Attribute "FreeSwapSpaceSize"
      </Value>
      <Value>
        Type "gauge"
        InstancePrefix "java_lang_operatingsystem_committedvirtualmemorysize"
        Attribute "CommittedVirtualMemorySize"
      </Value>
    </MBean>

    <MBean "Threading">
      ObjectName "java.lang:type=Threading"
      Instanceprefix "java"
      <Value>
        Type "gauge"
        InstancePrefix "java_lang_threading_threadcount"
        Attribute "ThreadCount"
      </Value>
      <Value>
        Type "gauge"
        InstancePrefix "java_lang_threading_daemonthreadcount"
        Attribute "DaemonThreadCount"
      </Value>
    </MBean>

    <MBean "ClassLoading">
      ObjectName "java.lang:type=ClassLoading"
      Instanceprefix "java"
      <Value>
        Type "gauge"
        InstancePrefix "java_lang_classloading_loadedclasscount"
        Attribute "LoadedClassCount"
      </Value>
    </MBean>

    <MBean "GCCollectiontimeCopy">
      ObjectName "java.lang:name=Copy,type=GarbageCollector"
      Instanceprefix "java"
      <Value>
        Type "gauge"
        InstancePrefix "java_lang_garbagecollector_collectiontime_copy"
        Attribute "CollectionTime"
      </Value>
    </MBean>

    <MBean "GCCollectiontimePSScavenge">
      ObjectName "java.lang:name=PS Scavenge,type=GarbageCollector"
      Instanceprefix "java"
      <Value>
        Type "gauge"
        InstancePrefix "java_lang_garbagecollector_collectiontime_ps_scavenge"
        Attribute "CollectionTime"
      </Value>
    </MBean>

    <MBean "GCCollectiontimeParNew">
      ObjectName "java.lang:name=ParNew,type=GarbageCollector"
      Instanceprefix "java"
      <Value>
        Type "gauge"
        InstancePrefix "java_lang_garbagecollector_collectiontime_parnew"
        Attribute "CollectionTime"
      </Value>
    </MBean>

    <MBean "GCCollectiontimeMarkSweepCompact">
      ObjectName "java.lang:name=MarkSweepCompact,type=GarbageCollector"
      Instanceprefix "java"
      <Value>
        Type "gauge"
        InstancePrefix "java_lang_garbagecollector_collectiontime_marksweepcompact"
        Attribute "CollectionTime"
      </Value>
    </MBean>

    <MBean "GCCollectiontimePSMarkSweep">
      ObjectName "java.lang:name=PS MarkSweep,type=GarbageCollector"
      Instanceprefix "java"
      <Value>
        Type "gauge"
        InstancePrefix "java_lang_garbagecollector_collectiontime_ps_marksweep"
        Attribute "CollectionTime"
      </Value>
    </MBean>

    <MBean "GCCollectiontimeConcurrentMarkSweep">
      ObjectName "java.lang:name=ConcurrentMarkSweep,type=GarbageCollector"
      Instanceprefix "java"
      <Value>
        Type "gauge"
        InstancePrefix "java_lang_garbagecollector_collectiontime_concurrentmarksweep"
        Attribute "CollectionTime"
      </Value>
    </MBean>

    <MBean "GCCollectiontimeG1Young">
      ObjectName "java.lang:name=G1 Young Generation,type=GarbageCollector"
      Instanceprefix "java"
      <Value>
        Type "derive"
        InstancePrefix "java_lang_garbagecollector_collectiontime_g1_young_generation"
        Attribute "CollectionTime"
      </Value>
    </MBean>

    <MBean "GCCollectiontimeG1Old">
      ObjectName "java.lang:name=G1 Old Generation,type=GarbageCollector"
      Instanceprefix "java"
      <Value>
        Type "gauge"
        InstancePrefix "java_lang_garbagecollector_collectiontime_g1_old_generation"
        Attribute "CollectionTime"
      </Value>
    </MBean>

    <MBean "GCCollectiontimeG1Mixed">
      ObjectName "java.lang:name=G1 Mixed Generation,type=GarbageCollector"
      Instanceprefix "java"
      <Value>
        Type "gauge"
        InstancePrefix "java_lang_garbagecollector_collectiontime_g1_mixed_generation"
        Attribute "CollectionTime"
      </Value>
    </MBean>

    <Connection>
      Host "localhost"
      ServiceURL "service:jmx:rmi:///jndi/rmi://localhost:9999/jmxrmi"
      Collect "Memory"
      Collect "OperatingSystem"
      Collect "Threading"
      Collect "ClassLoading"
      Collect "GCCollectiontimeCopy"
      Collect "GCCollectiontimePSScavenge"
      Collect "GCCollectiontimeParNew"
      Collect "GCCollectiontimeMarkSweepCompact"
      Collect "GCCollectiontimePSMarkSweep"
      Collect "GCCollectiontimeConcurrentMarkSweep"
      Collect "GCCollectiontimeG1Young"
      Collect "GCCollectiontimeG1Old"
      Collect "GCCollectiontimeG1Mixed"
    </Connection>
  </Plugin>
</Plugin>
Restart the service to reload the configuration:
$ sudo service collectd restart
Stopping collectd:                                         [  OK  ]
Starting collectd:                                         [  OK  ]
And review the log to verify that there are no errors:
$ sudo tail /var/log/messages
...
May  10 14:32:05 collectd[1195]: plugin_load: plugin "network" successfully loaded.
May  10 14:32:05 collectd[1195]: plugin_load: plugin "java" successfully loaded.
May  10 14:32:05 collectd[1195]: Initialization complete, entering read-loop.
If there’s an issue with opening libjvm.so, follow the instructions in this issue report to soft link the expected shared library to the right location:
$ ldd /usr/lib64/collectd/java.so
        linux-vdso.so.1 =>  (0x00007ffdec5f7000)
        libjvm.so => not found
        libc.so.6 => /lib64/libc.so.6 (0x00007f335fda8000)
        /lib64/ld-linux-x86-64.so.2 (0x00007f3360380000)
$ find /usr/lib -name 'libjvm.so'
/usr/lib/jvm/java-1.7.0-openjdk-1.7.0.261.x86_64/jre/lib/amd64/server/libjvm.so
/usr/lib/jvm/java-11-amazon-corretto/lib/server/libjvm.so
$ sudo ln -s /usr/lib/jvm/java-11-amazon-corretto/lib/server/libjvm.so /usr/lib64/libjvm.so
Verify that libjvm.so can now be resolved:
$ ldd /usr/lib64/collectd/java.so
        linux-vdso.so.1 =>  (0x00007fff8e1e5000)
        libjvm.so => /usr/lib64/libjvm.so (0x00007fba63728000)
        libc.so.6 => /lib64/libc.so.6 (0x00007fba6335a000)
        libdl.so.2 => /lib64/libdl.so.2 (0x00007fba63156000)
        libpthread.so.0 => /lib64/libpthread.so.0 (0x00007fba62f3a000)
        libm.so.6 => /lib64/libm.so.6 (0x00007fba62c38000)
        /lib64/ld-linux-x86-64.so.2 (0x00007fba64efb000)
Step 2 : Run the Java application with JMX enabled
To enable JMX, run the application with the following additional arguments:
-Dcom.sun.management.jmxremote.port=9999
-Dcom.sun.management.jmxremote.authenticate=false
-Dcom.sun.management.jmxremote.ssl=false
Review the startup scripts and configuration files of your application on the best place to add these additional arguments. When simply running a .jar from the command line, the invocation could look like this:
$ java -jar -Dcom.sun.management.jmxremote.port=9999 -Dcom.sun.management.jmxremote.authenticate=false -Dcom.sun.management.jmxremote.ssl=false pet-search.jar
Step 3 e: Configure the CloudWatch agent
Install and setup the CloudWatch agent, if it isn’t yet available on your host.
Add the collectd block to metrics in the CloudWatch configuration and define the desired namespace as name_prefix. The name_prefix will appear in the CloudWatch as a prefix to each custom metric and can be used to distinguish these JMX metrics from other custom metrics.
{
    "agent": {
        "metrics_collection_interval": 60,
        "run_as_user": "root"
    },
    "logs": {
        "logs_collected": {
            "files": {
                "collect_list": [
                    {
                            "file_path": "/var/log/messages",
                            "log_group_name": "messages",
                            "log_stream_name": "{instance_id}"
                    }
                ]
            }
        }
    },
    "metrics": {
        "aggregation_dimensions": [
            [
                "InstanceId"
            ]
        ],
        "append_dimensions": {
            "AutoScalingGroupName": "${aws:AutoScalingGroupName}",
            "ImageId": "${aws:ImageId}",
            "InstanceId": "${aws:InstanceId}",
            "InstanceType": "${aws:InstanceType}"
        },
        "metrics_collected": {
            "collectd": { "metrics_aggregation_interval": 60,
                "name_prefix": "petsearch_", "collectd_security_level": "none"
            },
            "disk": {
                "measurement": [
                    "used_percent"
                ],
                "metrics_collection_interval": 60,
                "resources": [
                    "*"
                ]
            },
            "mem": {
                "measurement": [
                    "mem_used_percent"
                ],
                "metrics_collection_interval": 60
            }
        }
    }
}
Assuming that you have stored the CloudWatch configuration in the Amazon Systems Manager Parameter Store, pass the configuration to the agent by running:
$ sudo /opt/aws/amazon-cloudwatch-agent/bin/amazon-cloudwatch-agent-ctl -a fetch-config -m ec2 -s -c ssm:AmazonCloudWatch-linux
...
Configuration validation succeeded
amazon-cloudwatch-agent stop/waiting
amazon-cloudwatch-agent start/running, process 6700
Verify that in the generated configuration file (amazon-cloudwatch-agent.toml), the following [[inputs.socket_listener]] is defined in the [inputs] section.
  [[inputs.socket_listener]]
    collectd_auth_file = "/etc/collectd/auth_file"
    collectd_security_level = "none"
    collectd_typesdb = ["/usr/share/collectd/types.db"]
    data_format = "collectd"
    name_prefix = "myapp_"
    service_address = "udp://127.0.0.1:25826"
    [inputs.socket_listener.tags]
      "aws:AggregationInterval" = "60s"
      metricPath = "metrics"
Furthermore, verify that the CloudWatch agent is listening on UDP 127.0.0.1:25826 (last column, the program name, should mention amazon-cloudwatch):
$ sudo netstat -lpun
Active Internet connections (only servers)
Proto Recv-Q Send-Q Local Address               Foreign Address             State       PID/Program name
udp        0      0 0.0.0.0:894                 0.0.0.0:*                               1991/rpcbind
udp        0      0 127.0.0.1:916               0.0.0.0:*                               2012/rpc.statd
udp        0      0 127.0.0.1:25826             0.0.0.0:*                               1541/amazon-cloudwa
udp        0      0 0.0.0.0:40560               0.0.0.0:*                               2012/rpc.statd
udp        0      0 0.0.0.0:68                  0.0.0.0:*                               1783/dhclient
udp        0      0 0.0.0.0:111                 0.0.0.0:*                               1991/rpcbind
udp        0      0 10.10.10.99:123             0.0.0.0:*                               2272/ntpd
udp        0      0 127.0.0.1:123               0.0.0.0:*                               2272/ntpd
udp        0      0 0.0.0.0:123                 0.0.0.0:*                               2272/ntpd
udp        0      0 fe80::39:ebff:fee2:96b2:546 :::*                                    1874/dhclient
udp        0      0 :::894                      :::*                                    1991/rpcbind
udp        0      0 :::111                      :::*                                    1991/rpcbind
udp        0      0 :::55580                    :::*                                    2012/rpc.statd
Step 4 : Review JMX custom metrics in CloudWatch
Navigate to CloudWatch in the AWS Console, then Metrics and All metrics. In the tab Browse, select CWAgent and then ImageId, InstanceId, InstanceType, instance, type, type_instance. Metrics from CollectD/GenericJMX can be identified in the column Metric name having the prefix petsearch_GenericJMX_value. Select the metrics, and in the drop-down menu at the top, choose Number as the graphing method.

Figure 2: JMX statistics as custom metrics in CloudWatch
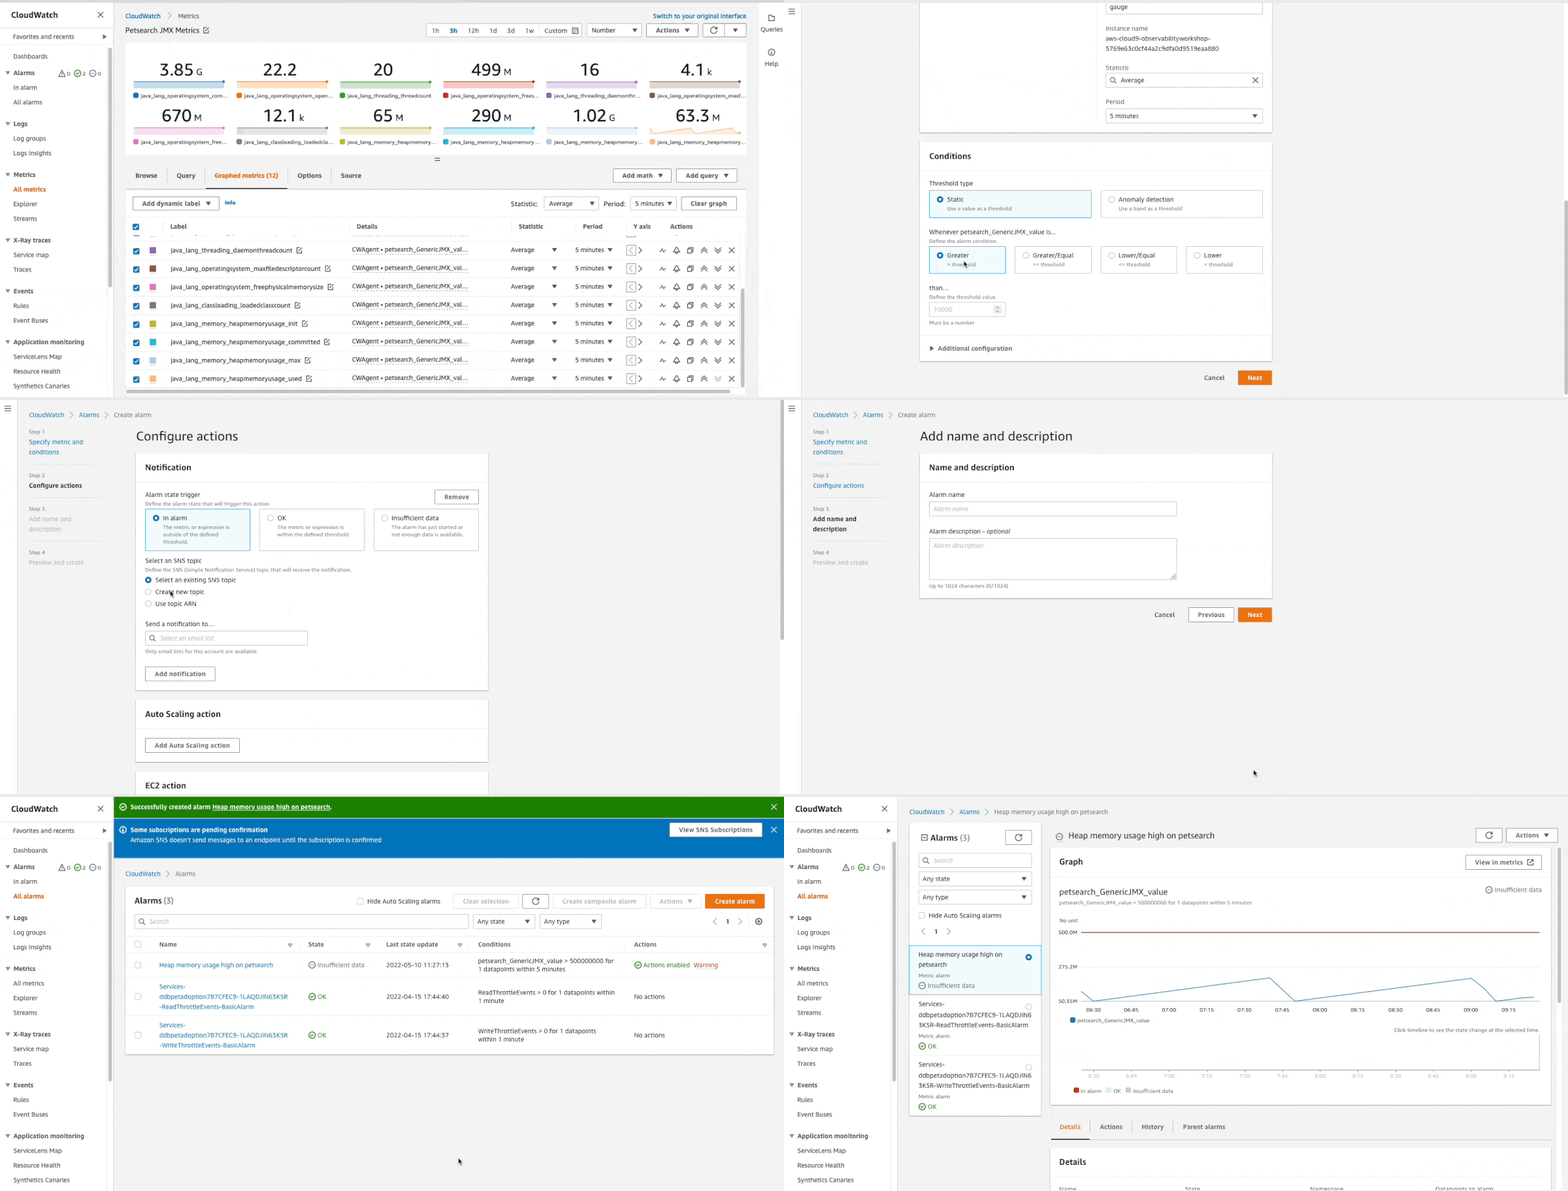
Step 5: Create alarms for your JMX statistics

Steps:
- In
CloudWatch, navigate to Alarms, then Create alarm. Alternatively, from your All Metrics > Graphed Metrics view, select the alarm bell next to the relevant metric.
- Select a relevant metric and select
Next.
- Enter a threshold that should trigger the alert, and select
Next.
- Define a notification method, e.g., don’t send an SNS topic. Confirm with
Next.
- Set a name and description for the alarm. Confirm with
Next.
- Confirm with
Create alarm.
Conclusion
In this post, I showed how JMX statistics can be sent to CloudWatch by implementing an approach using CollectD. Using the same approach, given CollectD’s vast set of plugins, many more data sources can be integrated. The architecture isn’t limited to the cloud and can be extended to on-premises workloads (where both CollectD and the CloudWatch agent can be run). As an example, using the CollectD SNMP plugin, metrics from network devices could be sent to CloudWatch and alerts could be created to alert customers early of potential issues. There are many possibilities, so have a look at the CollectD plugin page for more inspiration.
About the author:


