AWS for Sports
AWS powers the world's most innovative leagues and teams
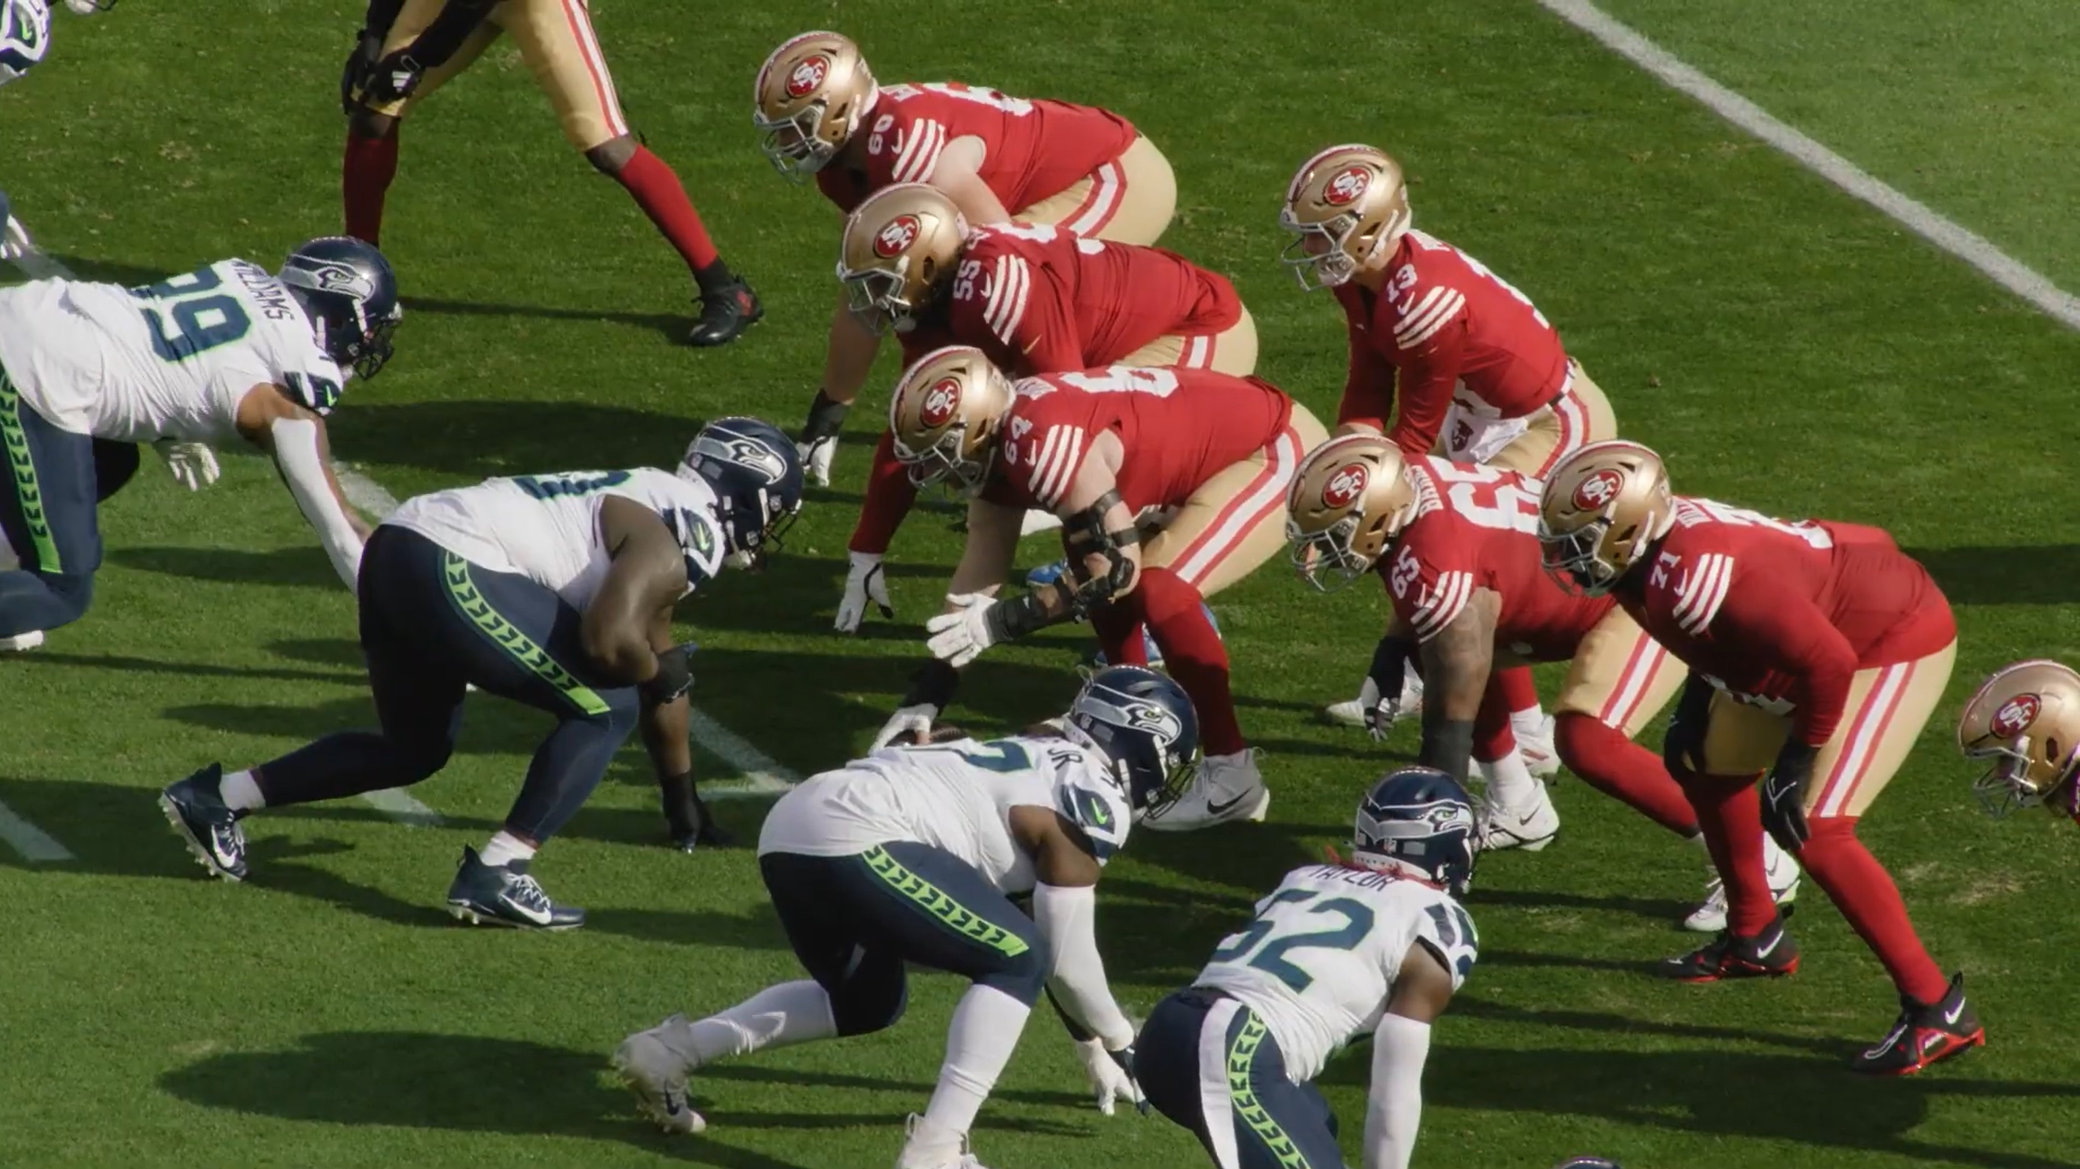
The NFL's Next-Level Playbook
The NFL uses AWS AI-powered insights to revolutionize football, on & off the field.
Discover how AI is leveling up the game, from Draft Score analysis to Next Gen Stats that take fans beyond the scoreboard.
New to AWS x NBA: Advanced Stats Powered by AI
The NBA is unveiling groundbreaking Advanced Stats for the 2025-26 season, powered by AWS AI. For the first time, fans can explore previously intangible aspects of player performance through machine learning-driven metrics like Shot Difficulty (xFG%), Defensive Box Score, and Gravity. These stats reveal how top players truly impact the game—from shot-making under pressure to reshaping defensive strategies across the court. Discover how AWS is transforming basketball analytics.

Explore our sports partners


MLSE on AWS
 Powered by AWS Machine Learning to create a better experience for fans, players, and teams.
NBA on AWS
 AWS is a new technology partner of the NBA and together we’re aiming to transform the future of basketball.


Riot Esports on AWS
 Powering innovation and transforming the player and fan experience worldwide
How the world's leading sports organizations leverage AWS
How AWS creates a winning schedule
AWS helped the NFL sort through a quadrillion possible options for the 2023-2024 season. Learn about the science—and art—behind finding “the one.”

How AWS and Formula 1® turn race data into real-time storytelling
Formula 1 and AWS built Track Pulse to process massive amounts of racing data in real time, helping production teams identify and present the most compelling storylines as they unfold on the track.

AWS and NHL debut new advanced stats
Two new advanced statistics powered by AWS, shot analytics and save analytics, give fans a better understanding and deeper appreciation of how their favorite players and teams perform during crucial moments.

Player safety
How AWS and the NFL are using AI and machine learning to revolutionize player safety, predict injuries, and optimize performance across all 32 teams.