AWS Partner Network (APN) Blog
Manage, Visualize, and Analyze Spatial Data with Amazon Redshift and CARTO
By Javier de la Torre, Founder and Chief Strategy Officer – CARTO
 |
| CARTO |
 |
Everything happens somewhere, and therefore everything can be analyzed from a location perspective. GPS data, addresses, parcels, administrative boundaries, routes—all of these are spatial data and this data type is growing fast.
Spatial data is a vital ingredient in today’s applications, enabling capabilities ranging from asset tracking and location-based marketing to monitoring deforestation and more.
Analyzing spatial data has traditionally been done on transactional databases like PostgreSQL with PostGIS. Modern data warehouses are now enabling levels of scalability never seen before. The benefits are significant when it comes to scalability, cost-effectiveness, and interoperability, and are much needed considering the rapid rise of spatial data and analytical workloads.
One such cloud data warehouse is Amazon Redshift, a fully managed, petabyte-scale cloud-based product designed for large-scale dataset storage and analysis. Amazon Redshift provides agility, flexibility, and cost-effectiveness.
In this post, we’ll cover the most important areas that organizations need when working with spatial data in Amazon Redshift and how CARTO helps with them:
- Exploring and managing spatial data visually.
- Importing geospatial files with formats like geoJSON, KML, and GeoPackages.
- Creating maps using SQL with large amounts of data, and sharing them.
- Performing advanced spatial analysis using spatial user defined functions (UDFs).
- Getting access to many spatial datasets such as demographics, financial, or mobility data worldwide to join with your data.
- Developing web applications visualizing data from Amazon Redshift into Amazon Location maps.
CARTO is an AWS Partner with an AWS-qualified software offering that unleashes unique spatial visualization, analysis, and app development features right inside AWS’s data warehouse.
Introduction to Amazon Redshift Spatial and CARTO
Back in 2019, Amazon Redshift added spatial support, making it possible to utilize the service as a complete spatial database engine. Since then, many upgrades have been implemented, including geography support as well as spatial query optimization and acceleration features.
Having spatial support at the data warehouse level is useful, but if the tools you use don’t support it then it’s not going to be very useful. Organizations working with spatial data need to visualize SQL results, make maps, reports, perform spatial analysis, join third-party location data, develop spatial applications, and more.
One key differentiation worth noting between some GIS platforms and CARTO is that CARTO pushes down the queries to Amazon Redshift, performing analytics and computation on Amazon Redshift with the usage of UDFs.
In the case of alternative GIS platforms, you “check out” data from Amazon Redshift into the GIS platform servers where most analytic queries and computations are executed. CARTO is a 100% cloud-native solution, meanwhile. It connects to Amazon Redshift and performs all of the analytical computations directly in the AWS cloud data warehouse.
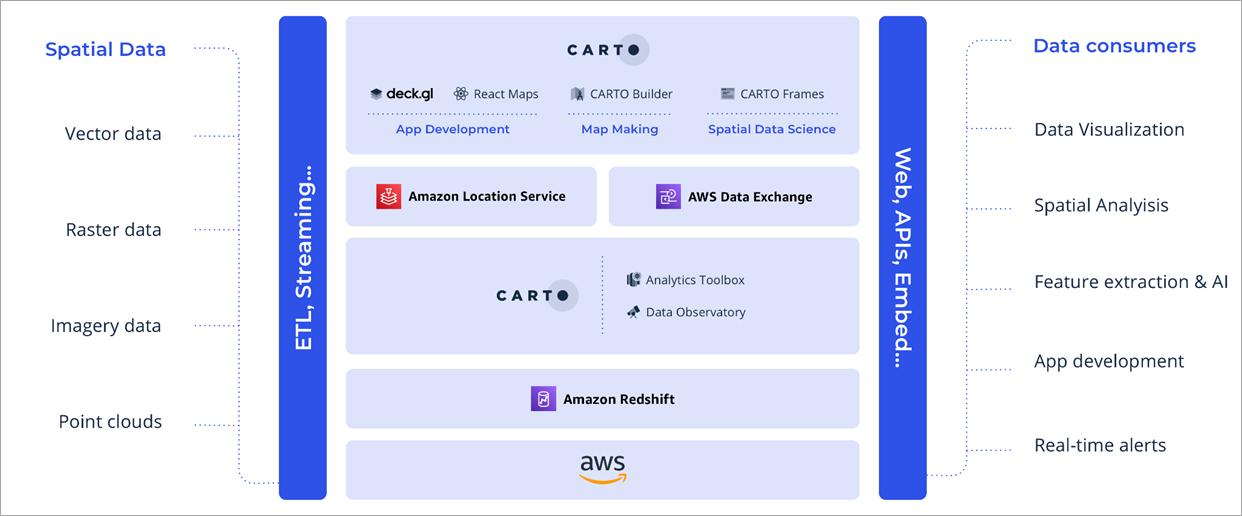
Figure 1 – CARTO cloud-native location intelligence platform architecture.
Connect and Explore Data on Your Amazon Redshift Cluster
You can try CARTO by getting a free trial account of the cloud service. You can also run it on your virtual private cloud (VPC) with CARTO’s on-premises offering.
After signing in, go to the CARTO Workspace Connections page and create a new connection to Amazon Redshift.
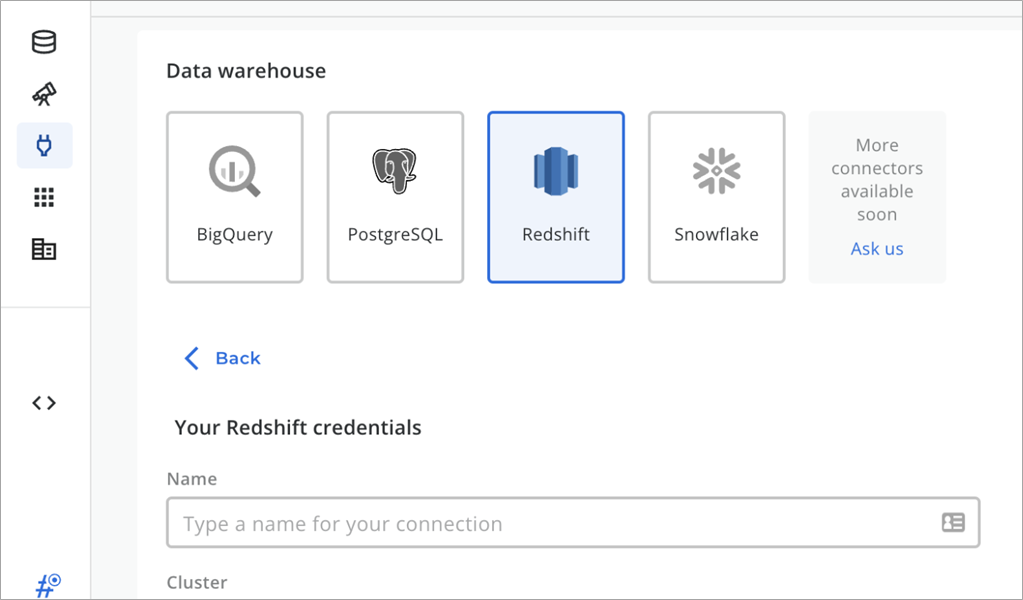
Figure 2 – Connect natively to Amazon Redshift.
After connecting your data warehouse, open the Data Explorer to preview your spatial data or load a new spatial dataset.
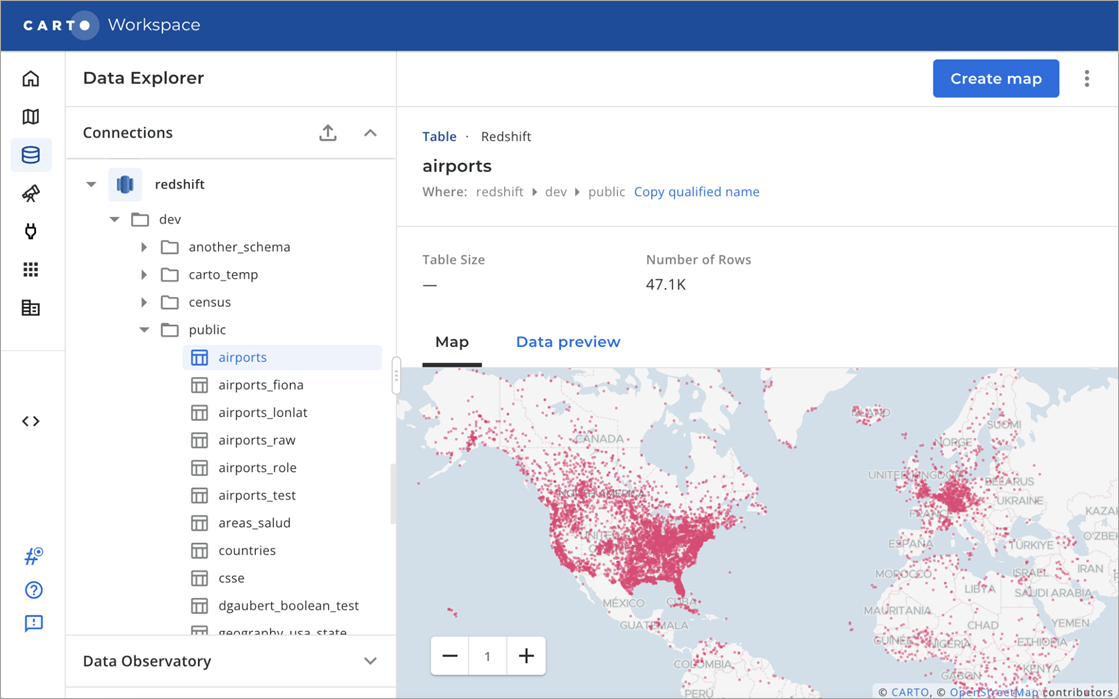
Figure 3 – Explore spatial datasets using CARTO Data Explorer.
When selecting a table, CARTO detects if there is a geography field and provides you with a map preview along with other information. This can be useful if you have many tables with different content and want to quickly preview the spatial data contained within.
Importing Spatial Data in Amazon Redshift with Drag and Drop
Amazon Redshift allows you to import shapefiles, and you need to have those shapefiles in Amazon Simple Storage Service (Amazon S3) and then use a copy command.
Using a simple user interface (UI) on the other hand, CARTO lets you drag and drop multiple spatial files, including GeoJSON, CSV with WKT or WKB, and more formats coming soon.
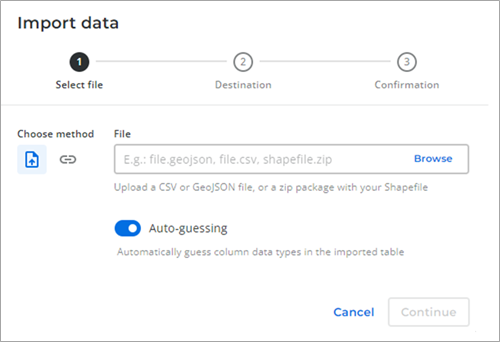
Figure 4 – Import spatial datasets into CARTO.
You have the option to select a local file that gets uploaded, or even specify a URL where to find the field to be loaded. You can also use shapefiles, geoJSON, and CSV with coordinates. More formats, such as GeoPackage and KML, are coming soon to CARTO.
Having a simple way to load spatial data into Amazon Redshift can be convenient when exploring different datasets from different providers.
Visual UI to Make Maps from SQL
Now that you have your data loaded in your cluster, it’s time to start visualizing it. You can think of CARTO like a database user interface (UI), where you can enter SQL and get maps from it. Simply go to the Maps section and create a new map.
Initially, you’ll get an empty map so start by creating a source which can be a table or can be defined as a SQL. When you choose a table, the entire table will be visualized on the map. When using SQL, you can enter any SQL that returns a geometry to visualize on the map.
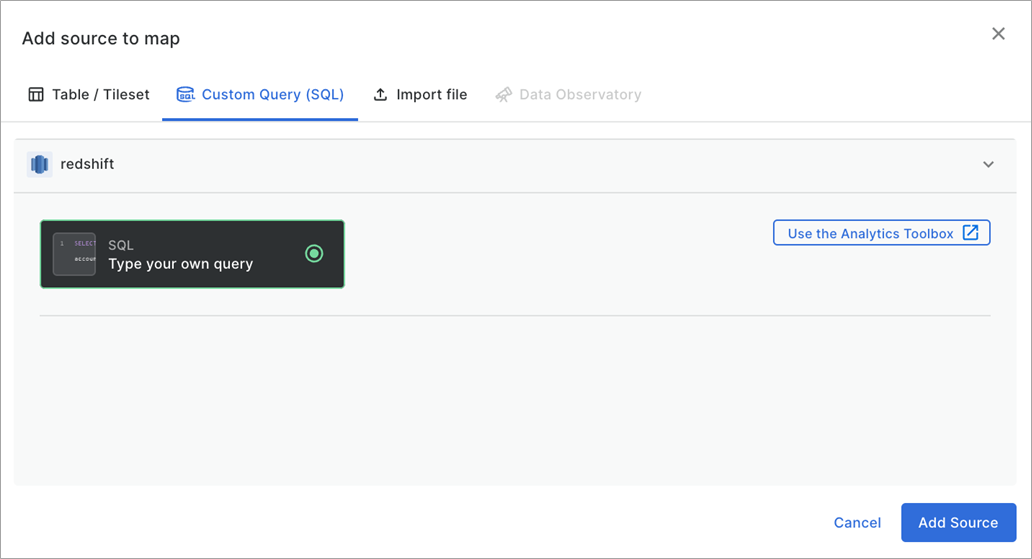
Figure 5 – Analyze spatial data in Amazon Redshift using simple SQL commands.
In this case, we are visualizing the Open Dataset PLUTO from New York City. We apply a spatial filter to only get downtown Manhattan.
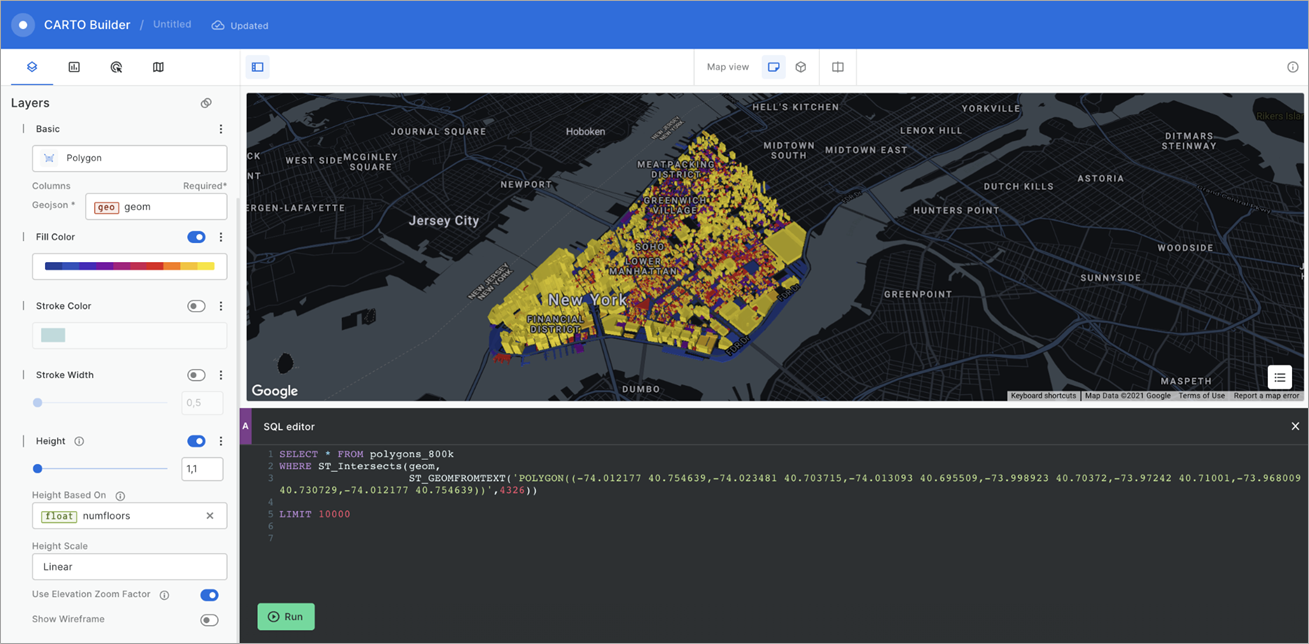
Figure 6 – Visualizing a sample dataset in a map in CARTO Builder.
Iterate on the map by changing the SQL and see the map updating in real-time. When you click Run CARTO, it executes the query live in Amazon Redshift and returns the results in a format optimized for handling large datasets. It also automatically detects if it can load the data entirely as a single document or as tiles. The goal is for users to be able to explore any dataset regardless of its size.
You can apply filters on the client side to further analyze the dataset, add widgets, and change the tooltips or the base map.
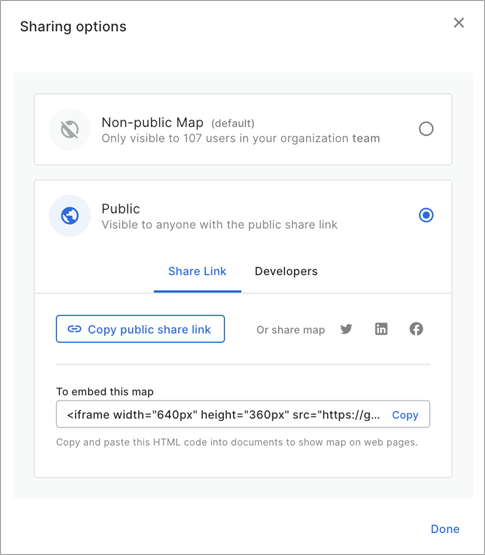
Figure 7 – Share your map visualizations created in CARTO.
Finally, you can share your map publicly or with members of your organization. Check out our map example, showing a 3D map of buildings in Manhattan hosted in Amazon Redshift and an Amazon Location basemap.
This map sharing capability is fully backed by content data networks (CDNs) and the data is always fresh from the Amazon Redshift source. If you update the source tables, the map automatically updates.
Extending Amazon Redshift with Spatial UDFs
In Amazon Redshift, you can find around 114 spatial functions already built in. On top of that, CARTO provides 46 more spatial functions that provide further analytical capabilities, bringing it closer to what PostGIS provides and more.

Figure 8 – Unlock advanced spatial analysis functions with the CARTO Analytics Toolbox.
To install the CARTO Analytics Toolbox, you can follow our setup guide. The installer will create a set of UDF functions in different schemas utilizing code in Amazon S3 buckets for you to use.
Once installed, you can now run a query such as:
SELECT carto.ST_GENERATEPOINTS(ST_GEOMFROMTEXT('POLYGON((13.376184 52.517678,13.362472 52.517756,13.354961 52.517066,13.349442 52.5192,13.334573 52.512044,13.344123 52.509532,13.359304 52.509534,13.377688 52.51274,13.376184 52.517678))'),100)
This will generate 100 random points inside a polygon. Of course, you can rapidly visualize the output on a map.
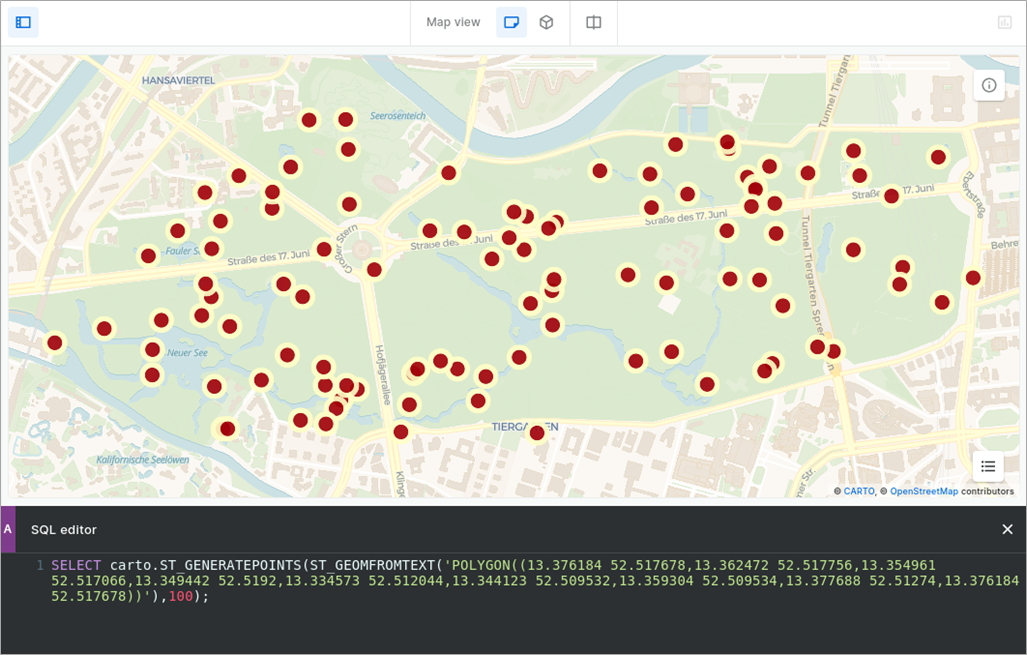
Figure 9 – Visualize your spatial query and filters on a map in CARTO.
Access 10,000 Spatial Datasets on Amazon Redshift
In spatial analytics, understanding the surroundings of a location is key. For almost all analysis, spatial data scientists require additional location data to enhance their own enterprise data. Datasets such as demographics, human mobility, or weather patterns are fundamental to understanding a location, model your business, and drive decision making.
This is why CARTO collects and curates more than 10,000 datasets from different providers and open data sources. All of this data is standardized and made available in a congruent data storage you can leverage in your applications or models. Explore the Spatial Data Catalog to check what’s available.
Now, how do you make this data available to Amazon Redshift users in its most simple way? First, CARTO makes many of these datasets available through the AWS Data Exchange. Specifically, check out the unified Spatial Features dataset that CARTO has developed and enables spatial modeling.
By unifying core features in a common spatial structure (H3), you get access to variables, such as demographics, urbanity, and climate in a unified way for the entire world.
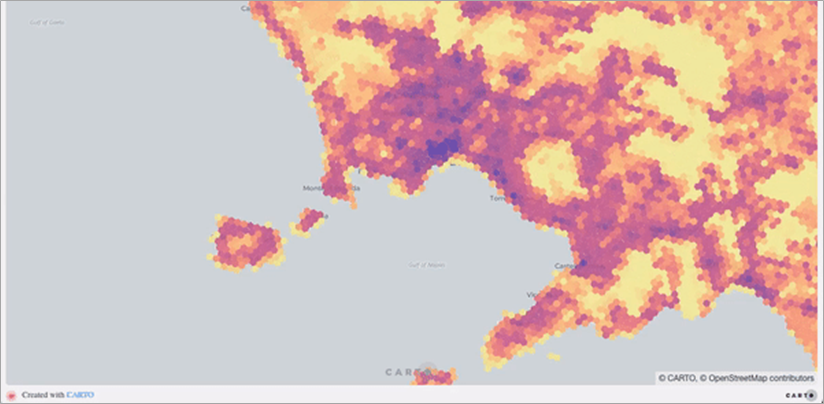
Figure 10 – Explore over 10,000 curated spatial datasets from the CARTO Data Observatory.
CARTO’s vision is to enable access through the AWS Data Exchange for Amazon Redshift. That way, users will be able to subscribe and immediately start joining their data with the location data CARTO offers. No need to worry about complex extract, transform, loads (ETLs) and the data is always up to date.
Visualizing Amazon Redshift Data in Your Application
A common use case when working with location data is the development of applications. Either because you need to embed your analysis in a product, or because you need to make spatial analysis part of a business process, embedding is an important capability.
To make an application with a map, you’re going to need to use a basemap layer and a data layer.
Figure 11 – Combining basemaps with data layers for visualizing spatial information in CARTO.
The data layer comes from either SQL or a table in Amazon Redshift, and for the basemap you can use the service from Amazon Location.
CARTO utilizes the open source library deck.gl and exposes a CARTOLayer that takes care of retrieving data from Amazon Redshift and lets you design your maps visually. CARTO does this whilst ensuring the map always performs regardless of data size or the amount of traffic to it.
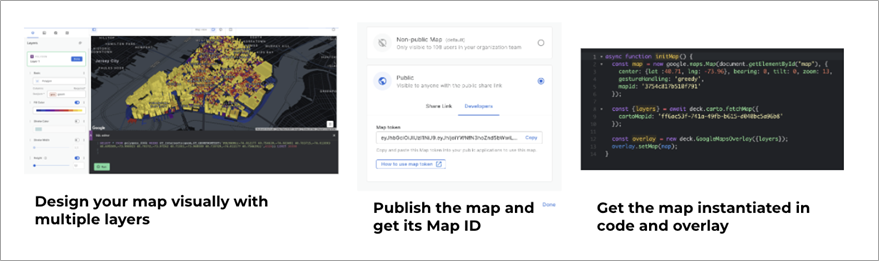
Figure 12 – Embedding a map visualization from CARTO in other applications.
Check out this example code to simply overlay a map designed with CARTO Builder into Amazon Location. After initializing the Amazon Location map, we simply create a CARTOLayer object that we overlay on top of the map.
If you modify the map in CARTO, such as changing its design or adding a SQL layer, the visualization gets updated accordingly.
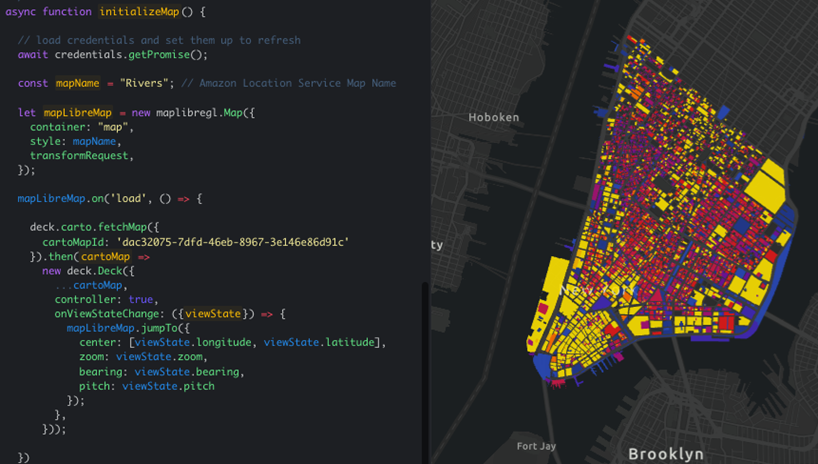
Figure 13 – Embedding a map visualization from CARTO into an application.
Summary
With the geospatial capabilities enabled in Amazon Redshift, combined with the tools from CARTO, it’s possible to solve most spatial use cases natively in the cloud. Users love the fact they don’t have to move data out of Amazon Redshift into any other system, making the most of its scalability and security.
Thinking even bigger, AWS provides a great foundation for a “geospatial cloud,” with services like Earth on AWS, AWS Data Exchange, and Amazon Athena. With CARTO Spatial Extension for Amazon Redshift, the component pieces are coming together.
If you would like to test drive all of these features, sign up for a free trial of the CARTO Spatial Extension for Amazon Redshift.
To discuss your specific spatial use case, email CARTO at sales@carto.com.
The content and opinions in this blog are those of the third-party author and AWS is not responsible for the content or accuracy of this post.
.

.
CARTO – AWS Partner Spotlight
CARTO is an AWS Partner that unleashes unique spatial visualization, analysis, and app development features right inside AWS’s data warehouse.
Contact CARTO | Partner Overview | AWS Marketplace
*Already worked with CARTO? Rate the Partner
*To review an AWS Partner, you must be a customer that has worked with them directly on a project.