AWS Big Data Blog
Accelerate Apache Spark debugging on Amazon EMR with AWS DevOps Agent
When an Apache Spark job fails on Amazon EMR, the root cause can hide in executor logs, memory profiles, or application code. As data pipelines grow in complexity, correlating logs, metrics, and traces across multiple services requires significant operational effort. AWS DevOps Agent handles this investigation autonomously while keeping operators in the loop to review findings and approve fixes. From a single chat prompt, it produces a root cause and mitigation plan, often without any human involvement beyond the initial question.
The native AWS API tools in AWS DevOps Agent don’t extend into Spark-internal artifacts. Sometimes those tools can’t reach the evidence that pins down the root cause: a Spark History Server event log, executor Python worker memory, or a line of code that allocated too much. In these cases, AWS DevOps Agent can describe symptoms (“the executor exited with code 1”) but can’t identify the actual antipattern that caused them.
This post shows how to extend AWS DevOps Agent to investigate failures in Apache Spark workloads on Amazon EMR. You register the Apache Spark Troubleshooting Agent for Amazon EMR, a managed Model Context Protocol (MCP) server hosted by AWS, as a custom capability provider in your AWS DevOps Agent space. You route the traffic over AWS PrivateLink so MCP calls never traverse the public internet. Then you watch a single agent chat session investigate a deliberately failing Spark job, from Amazon CloudWatch alarm to line-numbered root cause, in about two minutes.
Prerequisites
Before you begin, make sure you have the following:
- An AWS account with permissions to deploy AWS CloudFormation stacks that create AWS Identity and Access Management (IAM) roles and Amazon Virtual Private Cloud (Amazon VPC) resources.
- The latest version of the AWS Command Line Interface (AWS CLI), Boto3, and Botocore, installed and configured with credentials for the same account and AWS Region.
- This walkthrough assumes you are familiar with AWS DevOps Agent and know how to trigger an investigation. For an introduction, see Getting started with AWS DevOps Agent.
How AWS DevOps Agent discovers custom tools through MCP
Model Context Protocol (MCP) is an open standard that defines how AI agents discover and invoke external tools. AWS DevOps Agent supports connecting to custom MCP servers, which means you can expose new capabilities to it without modifying the agent itself. When you connect an MCP server to AWS DevOps Agent, the agent automatically discovers the available tools, understands their schemas, and calls them as part of its investigation workflow. You build and connect the MCP server, and the agent handles the rest.
MCP tools sit alongside the agent’s built-in AWS API tools. During a single investigation, the agent can interleave calls to cloudwatch.describe-alarms, emr-serverless.get-job-run, and a custom MCP tool such as analyze_spark_workload. The agent picks the right one for each subtask. You augment the agent’s reach without replacing what it already does.
For this integration, you don’t build an MCP server. The Apache Spark Troubleshooting Agent for Amazon EMR is itself a managed MCP server, hosted by AWS at a regional endpoint. Your job is to register that endpoint with AWS DevOps Agent and authorize the agent to call it. This requires a network path from the agent to the endpoint, plus an IAM role for AWS Signature Version 4 request signing.
Why Spark internals visibility matters
The actual root cause for a Spark failure usually lives somewhere none of those APIs (such as Amazon CloudWatch Logs Insights, AWS CloudTrail, or Amazon EMR step-status calls) can reach:
The Apache Spark Troubleshooting Agent for Amazon EMR reads the following sources.
The Spark History Server event log is a per-job archive in Amazon Simple Storage Service (Amazon S3) with stage timings, task-level metrics, executor utilization, shuffle read/write volumes, and garbage-collection pauses. Amazon EMR exposes this data through the Spark UI on Amazon EMR Serverless, Amazon EMR on Amazon Elastic Compute Cloud (Amazon EC2), and Amazon EMR on Amazon Elastic Kubernetes Service (Amazon EKS), but interpreting signals like data skew, executor memory pressure, or stages that take significantly longer than expected requires familiarity with Spark internals.
- The Spark query plan — the logical and physical plan the driver compiled. Without it, you can’t identify antipatterns such as unnecessary data repartitioning or missing broadcast hints that trigger expensive shuffles.
- The application source code in Amazon S3 — the
.pyor.jarcode artifact the job ran. Without it, you can’t quote the offending line of amapPartitionsuser-defined function or an inefficientcollect(). - The Python worker process telemetry — the PySpark worker is a separate Python subprocess outside the Java Virtual Machine’s (JVM) managed memory. When it crashes from
spark.executor.pyspark.memoryexhaustion, the JVM driver sees a generic “executor exited unexpectedly” message. The actual cause is invisible to standard JVM-level logs.
When the agent invokes analyze_spark_workload during an investigation, it returns a structured analysis with the antipattern identified at the line level, the offending stage isolated, and a concrete fix: both code changes and configuration changes.
Integrating AWS DevOps Agent with Apache Spark Troubleshooting MCP
This section explains how AWS DevOps Agent connects to the Apache Spark Troubleshooting Agent through a private MCP endpoint and orchestrates the investigation workflow.
How it works
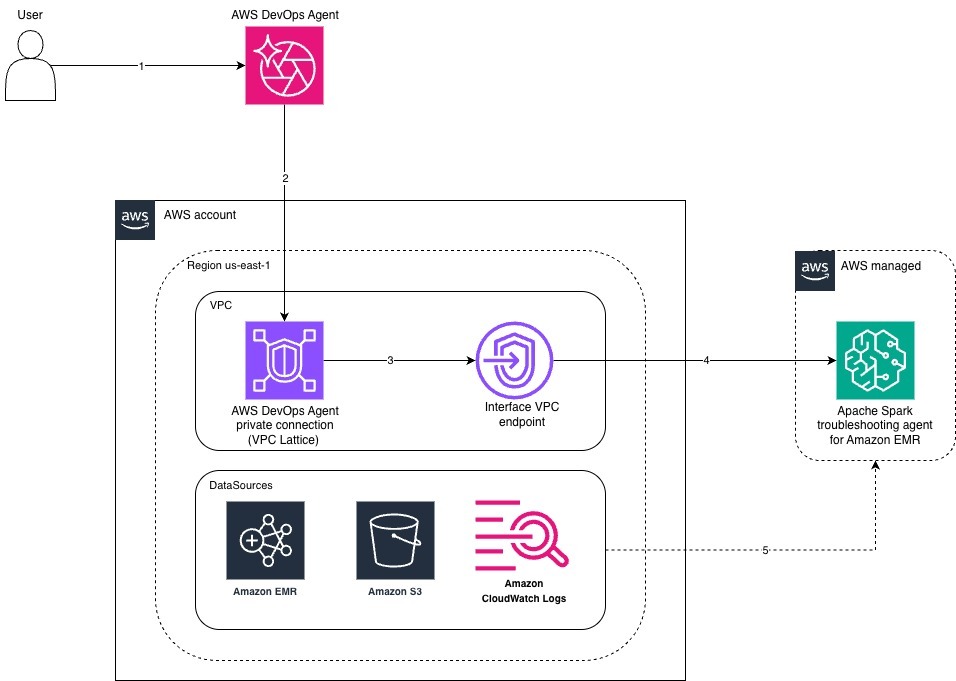
Figure 1: Integration architecture between AWS DevOps Agent and the Apache Spark Troubleshooting Agent for Amazon EMR over AWS PrivateLink
- You submit an investigation prompt in AWS DevOps Agent.
- AWS DevOps Agent sends a SigV4-signed MCP call into your Amazon VPC through the AWS DevOps Agent private connection.
- The private connection forwards the request to the Interface VPC Endpoint.
- The endpoint routes the request over AWS PrivateLink to the Apache Spark Troubleshooting Agent for Amazon EMR, which AWS manages.
- The MCP service reads from your data sources (Amazon EMR, Amazon S3, Amazon CloudWatch Logs) using the same IAM role AWS DevOps Agent assumed for the call.
- When a CloudWatch alarm transitions to ALARM state (for example, a failed-jobs alarm for your Amazon EMR Serverless application), AWS DevOps Agent automatically triggers an investigation without manual intervention.
- AWS DevOps Agent decides which tools to call based on the prompt. For a Spark failure, that includes the Apache Spark Troubleshooting MCP server you registered as a capability provider.
- Each MCP request is signed with AWS Signature Version 4 using the IAM role assigned to the capability provider. The request travels from AWS DevOps Agent into your Amazon VPC through the private connection. This private connection is a managed VPC Lattice resource gateway you created during setup.
- From the resource gateway, the request flows to the Interface VPC Endpoint for the Amazon SageMaker Unified Studio MCP service, then on to the Apache Spark Troubleshooting Agent. The traffic stays entirely on the AWS network.
- The MCP server reads the inputs it needs from your AWS account using the IAM role that you assigned to the capability provider during MCP server registration. This role grants access to the Spark History Server event log and application source code in Amazon S3, the driver and executor stdout streams in Amazon CloudWatch Logs, and the job-run metadata from Amazon EMR Serverless.
- The MCP server returns its diagnostic findings to AWS DevOps Agent. The agent then analyzes the results, identifies the root cause, and presents recommended fixes both code-level and configuration-level in your chat.
Setting up the demo
As part of this demo, this post includes a sample AWS CloudFormation template, tested in the us-east-1 Region, that provisions the following resources for the walkthrough:
- A dedicated Amazon Virtual Private Cloud (Amazon VPC) with two private subnets in Availability Zones supported by the Apache Spark Troubleshooting Agent for Amazon EMR.
- An Interface VPC Endpoint for the Apache Spark Troubleshooting Agent for Amazon EMR.
- An IAM role that AWS DevOps Agent assumes to invoke the Apache Spark Troubleshooting MCP server with AWS Signature Version 4.
- A deliberately failing PySpark workload running on Amazon EMR Serverless, including the Amazon EMR Serverless application, the Spark execution role, and the demo logs stored in Amazon S3 bucket.
- An Amazon CloudWatch alarm that fires when the demo job fails. This alarm is used as the trigger for the agent investigation later in this section.
Step 1: Clone the repository
Clone the git repository for the CloudFormation template, PySpark script, and Parquet data.
Step 2: Deploy the AWS CloudFormation stack
Deploy the template using the following AWS CLI command.
The stack reaches CREATE_COMPLETE in approximately 4–6 minutes. When it does, capture the following stack outputs, which you paste into the AWS DevOps Agent console in the next two steps:
DemoVpcId— the VPC ID for the AWS DevOps Agent private connection.DemoSubnetIds— the two subnet IDs for the AWS DevOps Agent private connection.SMUSVpcEndpointSecurityGroupId— the security group ID.TroubleshootingRoleArn— the IAM role Amazon Resource Name (ARN).MCPEndpointURL— the MCP endpoint URL to register.FailedJobsAlarmName— the CloudWatch alarm name to reference in your investigation prompt.DemoBucket— the S3 bucket name where you copy the demo script and Parquet data.
To retrieve all outputs at once, use the following AWS CLI command.
Step 3: Create an agent space
The agent space defines which AWS account and Region the agent monitors, which IAM role it assumes, and which capability providers, including MCP servers, it can call.
Follow the steps in Creating an Agent Space in the AWS DevOps Agent User Guide. When completing those steps, use the following values:
| Parameter | Value |
| Name | data-pipeline-troubleshooting |
| Region | us-east-1 |
| Agent Space role | Choose Auto-create a new DevOps Agent role — the console generates a DevOpsAgentRole-AgentSpace* role with AIOpsAssistantPolicy attached |
| Optional integrations | Not required |
After the agent space reaches Active status, proceed to create the private connection.
Step 4: Create the AWS DevOps Agent private connection
AWS DevOps Agent uses the private connection to reach into your Amazon VPC. Follow the steps in Connecting to privately hosted tools in the AWS DevOps Agent User Guide. You can use either the console or the AWS CLI command documented under Create a private connection.
When completing those steps, use the following values from your CloudFormation stack outputs:
| Parameter | Value |
| Name | A descriptive name (for example, spark-private) |
| VPC | DemoVpcId from your stack outputs |
| Subnets | Both subnet IDs from DemoSubnetIds |
| Security group | SMUSVpcEndpointSecurityGroupId |
| TCP port ranges (Advanced configuration) | 443 |
| Host address (Service target details) | sagemaker-unified-studio-mcp.us-east-1.api.aws |
| DNS resolution | In VPC (private DNS) |
| Certificate public key | None |
After the connection reaches Active status, proceed to Step 5.
Step 5: Register the Apache Spark Troubleshooting MCP server as a capability provider
With the private connection in place, register the MCP server as a capability provider. Follow the steps in Registering an MCP server at the account level in the AWS DevOps Agent User Guide.
When completing those steps, use the following values:
| Parameter | Value |
| Name | spark-troubleshooting |
| Endpoint URL | MCPEndpointURL from your stack outputs |
| Connect to endpoint using a private connection | Selected |
Step 6: Add the MCP server to the agent space
With the MCP server registered, you need a workspace where investigations run. The agent space defines which AWS account and Region the agent monitors, which IAM role it assumes, and which capability providers, including MCP servers, it can call.
- In the MCP Server section, choose Add.
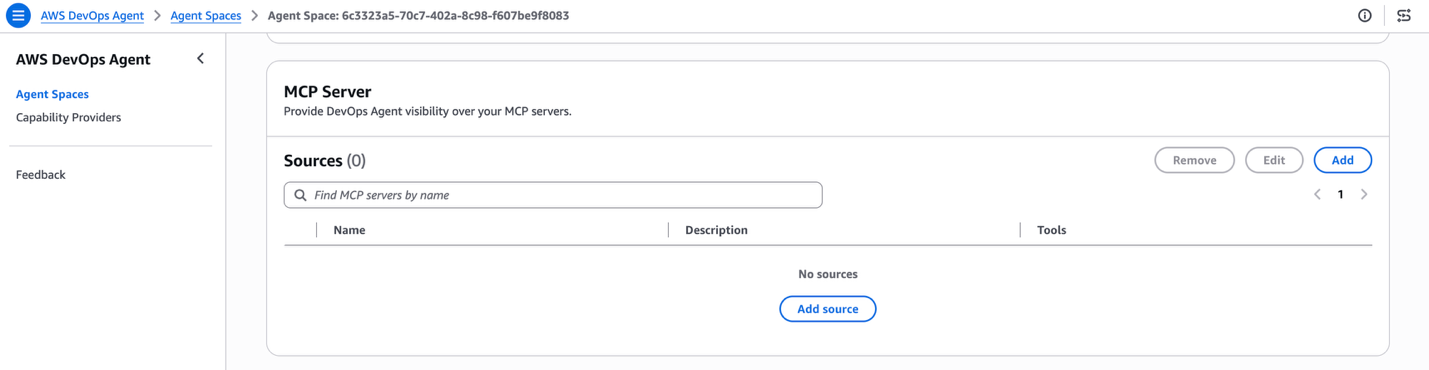
Figure 2: MCP Server section of the agent space detail page
- In the Add a capability dialog, locate
spark-troubleshootingin the list of registered MCP servers and choose Add.
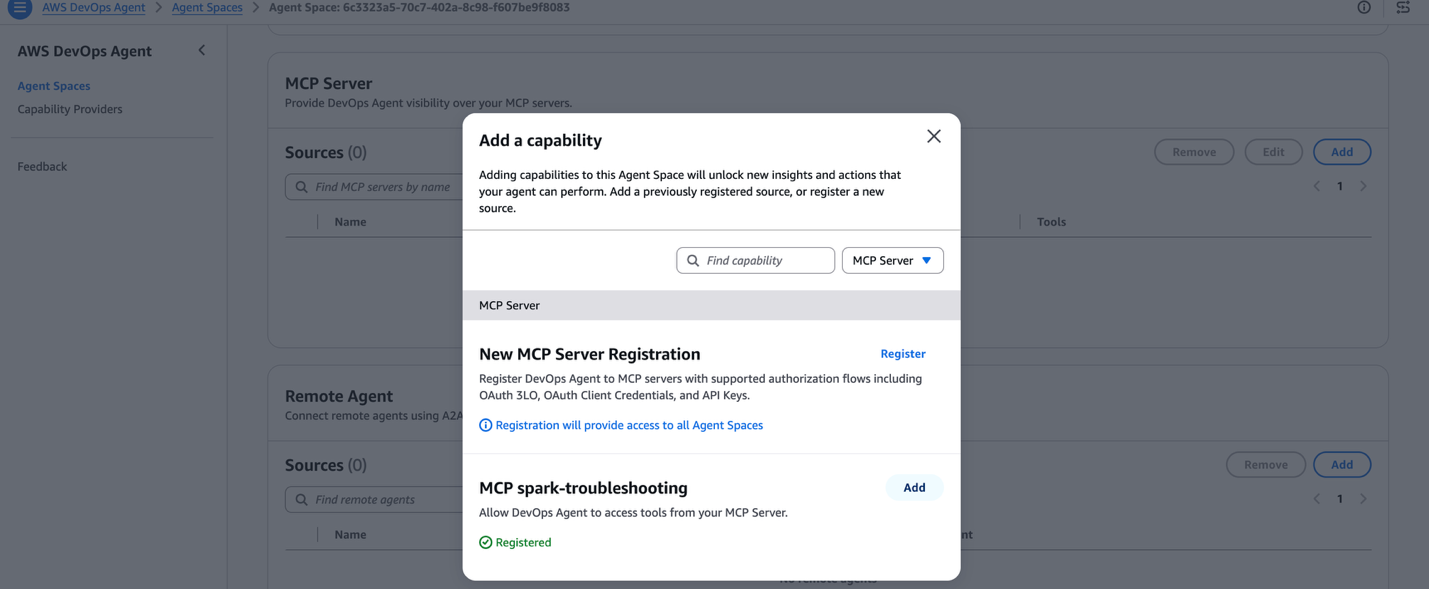
Figure 3: Add a capability with the spark-troubleshooting MCP server listed
- On the Select MCP server tools page, both tools that the Apache Spark Troubleshooting Agent for Amazon EMR publishes are listed:
analyze_spark_workloadandanalyze_spark_history_server_endpoint. Select both checkboxes, then choose Save.
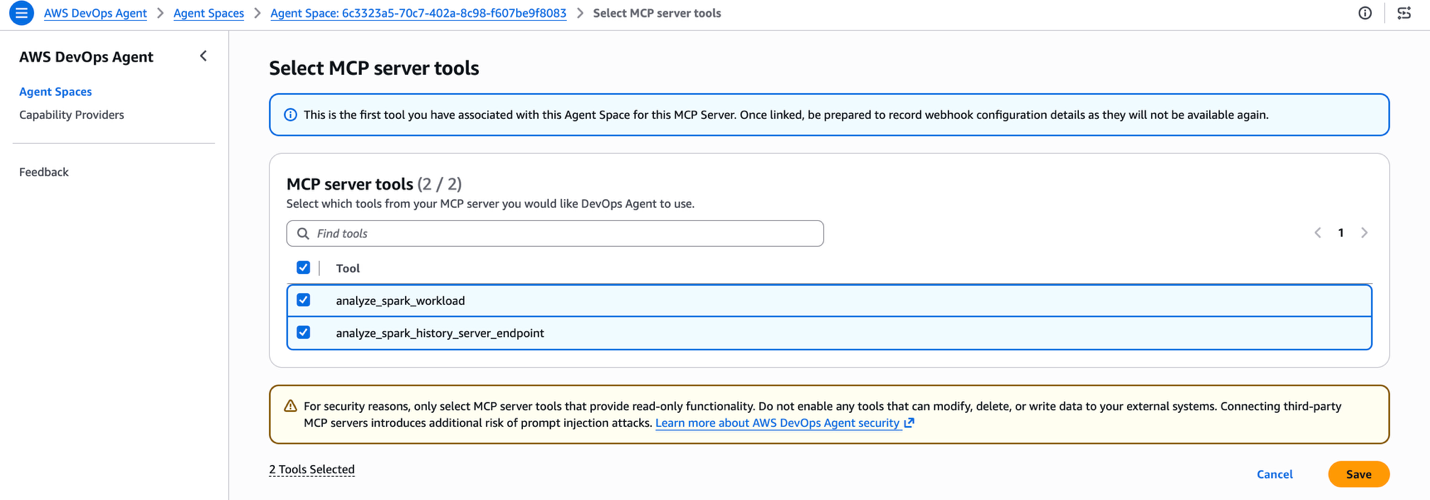
Figure 4: The Select MCP server tools page with both Spark troubleshooting tools selected
The agent space connects to the MCP server, lists its tools, and displays 2 Available / 2 Connected. Both tools are now part of your agent’s catalog.
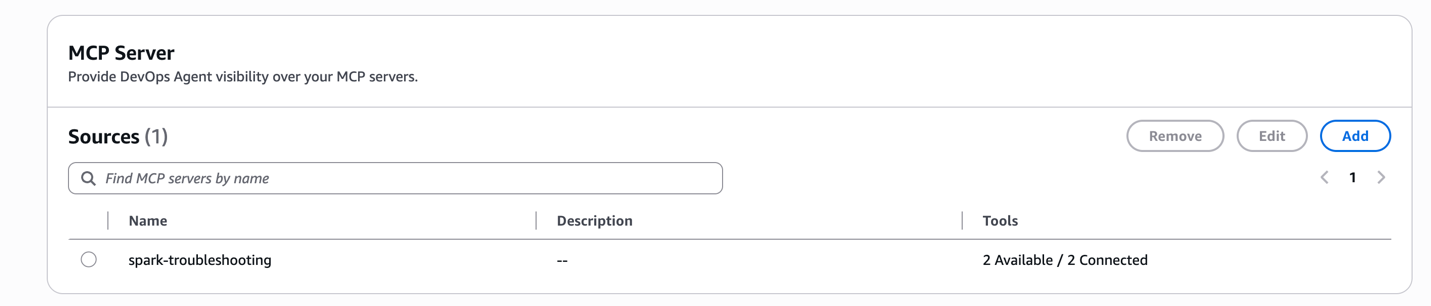
Figure 5: MCP Server section showing spark-troubleshooting connected with both tools available
Seeing it in action
To see the integration end to end, you submit a PySpark job, watch the CloudWatch alarm move to ALARM, and then ask AWS DevOps Agent to investigate using the alarm name.
The failing workload
The CloudFormation template provisioned an Amazon EMR Serverless application called analytics-events-platform and configured a sample PySpark job, customer_events_aggregator.py. The script simulates a common Python-side memory bug: a mapPartitions user-defined function accumulates 11 copies of every input row in an in-memory Python list before yielding results, while the job runs with spark.executor.pyspark.memory=256m. The Python worker process exceeds the 256 MB cap, the kernel kills it, Spark retries four times, and the stage is marked failed.
Submit the failing job
Run the DemoSubmitJobCommand from your stack outputs in your terminal. It looks like this:
The command returns a jobRunId. Note it down. You will see it later in the agent’s investigation.
The job goes through PENDING to SCHEDULED to RUNNING to FAILED and reaches FAILED state in roughly four minutes.
Watch the CloudWatch alarm fire
The CloudFormation template also created a CloudWatch alarm named <DemoApplicationId>-FailedJobs (the exact name is in the FailedJobsAlarmName stack output). The alarm watches the FailedJobs metric in the AWS/EMRServerless namespace, scoped to your demo application, and flips to ALARM within a minute or two of the job failing.
Open the Amazon CloudWatch console, choose Alarms in the left navigation pane, and confirm the alarm is in In alarm state.
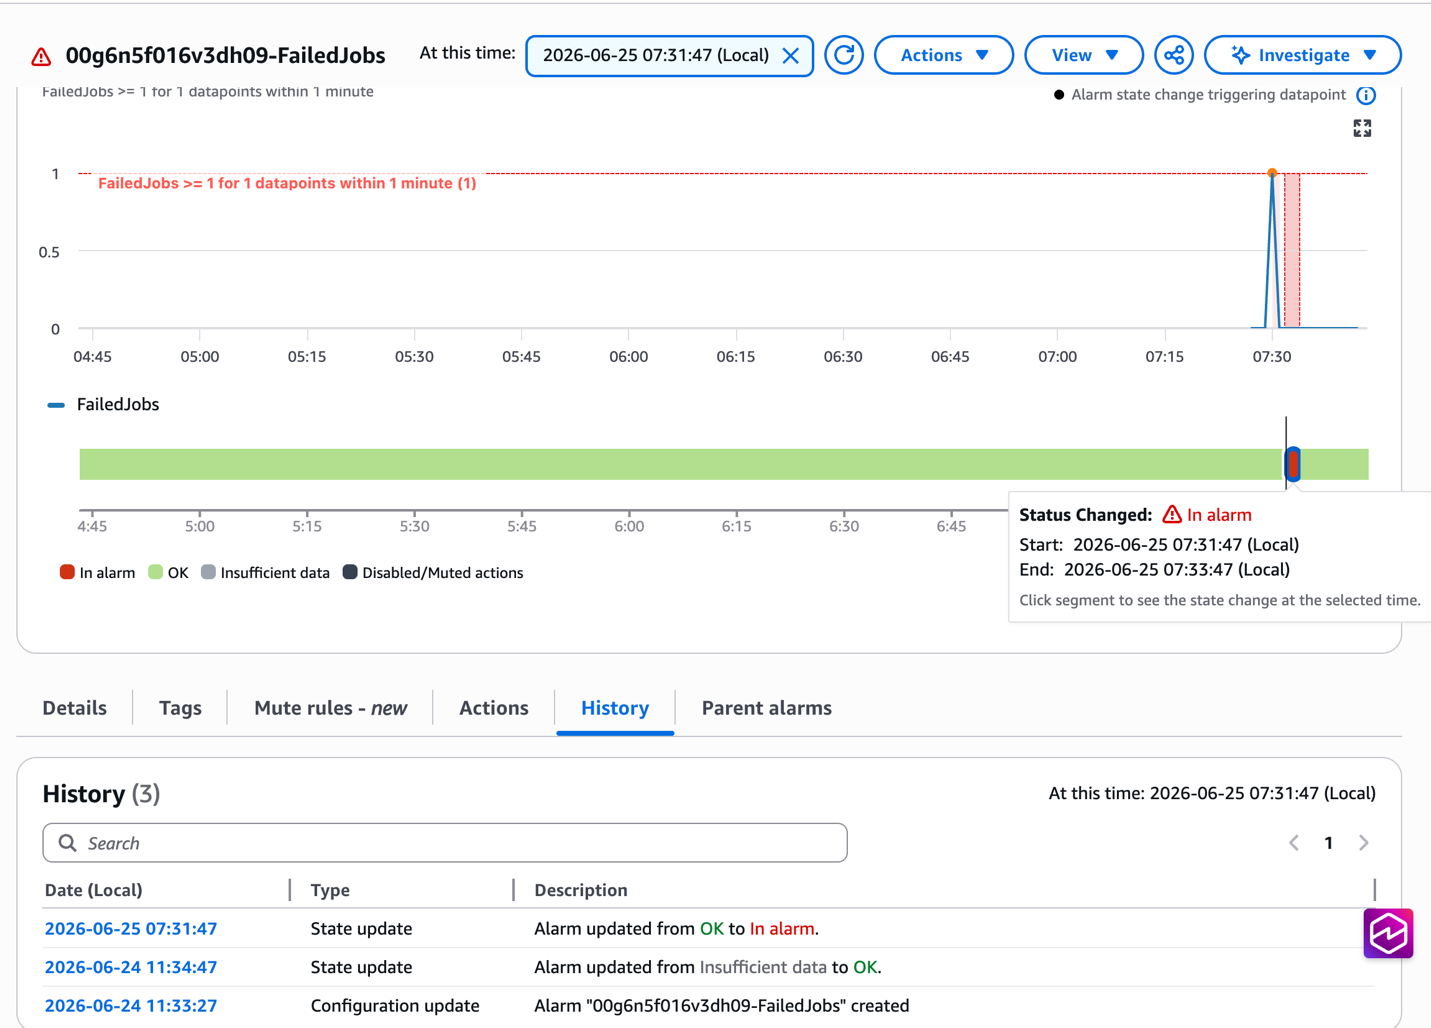
Figure 6: The Amazon CloudWatch alarm detail page showing the FailedJobs alarm in the In alarm state
Ask AWS DevOps Agent to investigate
- Open your AWS DevOps Agent space.
- In the left navigation pane, choose Operator Access, then choose Incidents.
- Choose Start an investigation.
- Paste the following prompt, replacing
<FailedJobsAlarmName>with the value from your stack outputs:
CloudWatch alarm in us-east-1 just went into ALARM state. Investigate why and recommend a fix
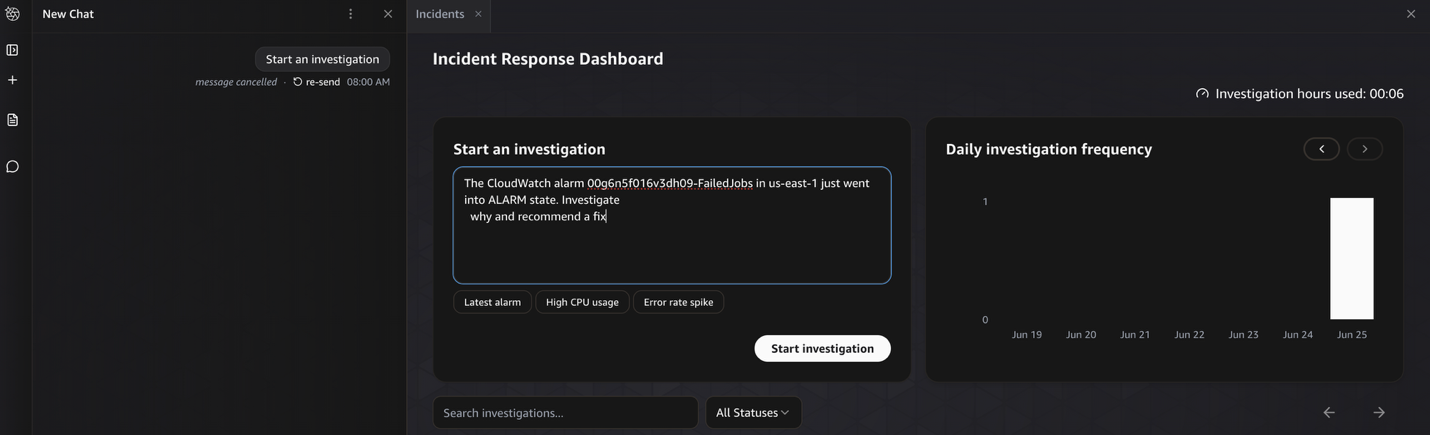
Figure 7: AWS DevOps Agent Start an investigation panel with the Amazon CloudWatch alarm investigation prompt
The agent’s investigation chains together native AWS API tools and the Apache Spark Troubleshooting MCP tool you registered:
use_aws cloudwatch describe-alarms— fetches the alarm definition and reads its metric dimensions, identifying that the alarm is scoped to Amazon EMR Serverless application<DemoApplicationId>.use_aws emr-serverless list-job-runs— finds the most recent FAILED job run on that application.use_aws emr-serverless get-job-run— pulls the FAILED run’s metadata and last-known error.spark-troubleshooting analyze_spark_workload— invokes the Apache Spark Troubleshooting Agent for Amazon EMR through the MCP capability provider, passing the application ID and job run ID. This is where the deep analysis happens.
Review the root cause and fix
When the investigation completes, AWS DevOps Agent presents the results across two tabs: Investigation timeline and Root cause.
The Investigation timeline shows every step the agent took: skills loaded, native AWS API calls made, and the moment it called the analyze_spark_workload MCP tool to analyze the failed Spark job. Each entry is expandable so you can audit the inputs and outputs.
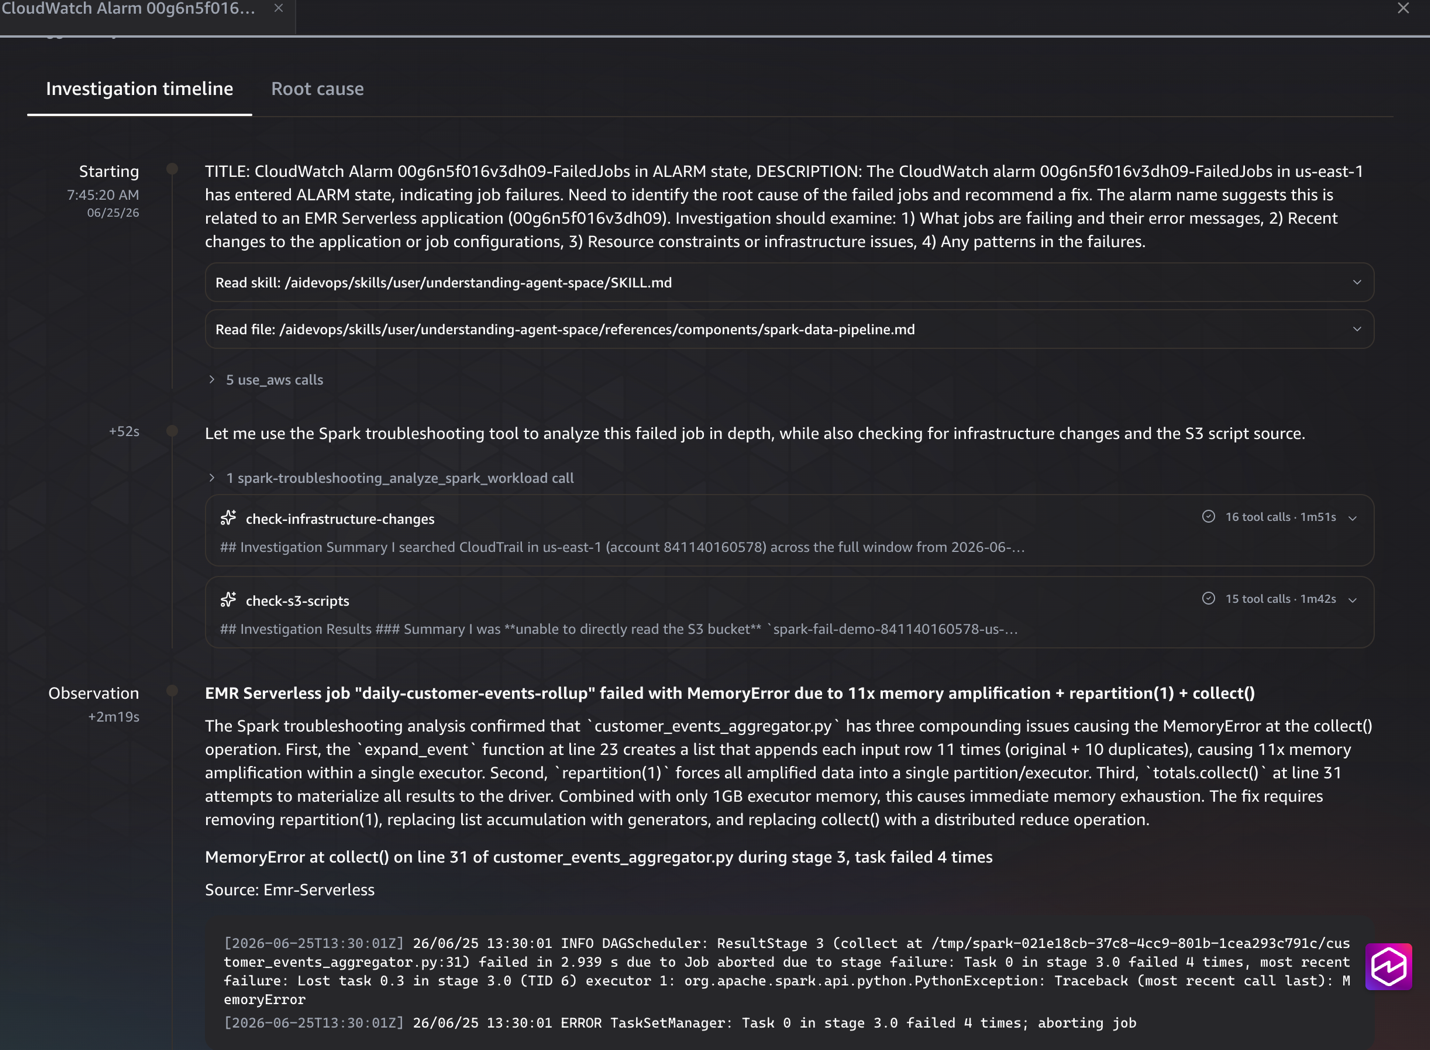
Figure 8: Investigation timeline tab showing the sequence of agent tool calls and the spark-troubleshooting MCP invocation
The Root cause tab is where the answer lands. It is organized into three sections that mirror what an experienced engineer would write in an incident report:
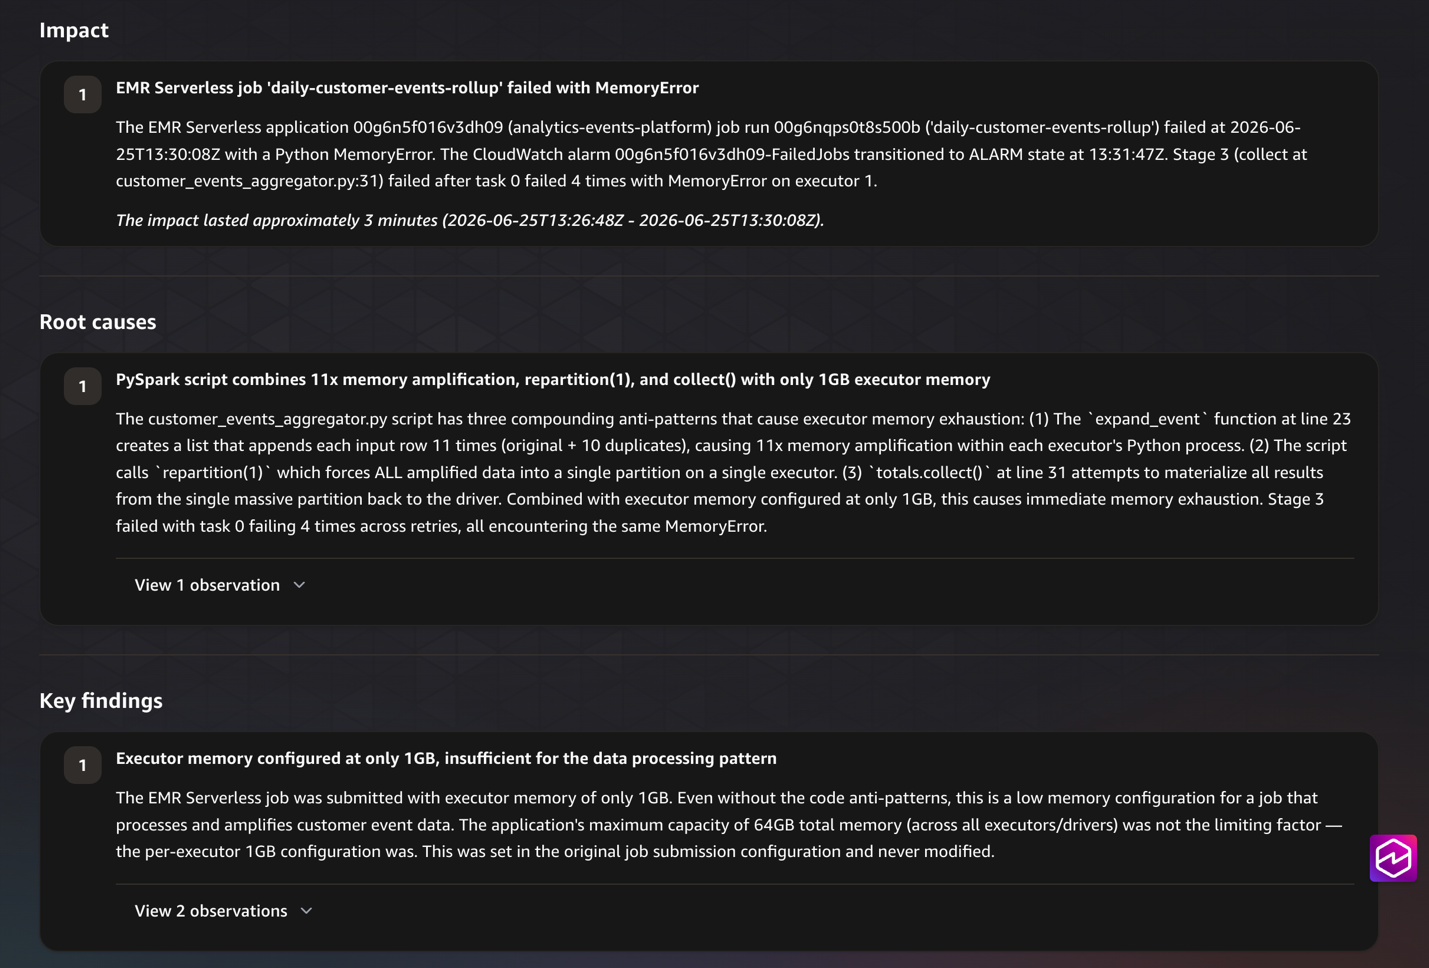
Figure 9: The Root cause tab showing the impact summary, identified root causes, and key findings for the Spark memory exhaustion failure
- Impact — what failed, when, and for how long. For our demo, this calls out that the
daily-customer-events-rollupjob on theanalytics-events-platformapplication failed with aMemoryErrorand that the alarm transitioned to ALARM state at the time of the failure. - Root causes — the actual antipattern. The agent identifies that
customer_events_aggregator.pycombines three compounding issues: anexpand_eventfunction (line 23) that amplifies each input row 11×, arepartition(1)that funnels all data into a single partition on a single executor, and acollect()(line 31) that pulls the amplified dataset back to the driver. All three run with only 1 GB of executor memory. - Key findings — supporting facts behind the diagnosis, including the executor memory configuration, the application’s maximum capacity, and how the agent confirmed each fact from the analyzed artifacts.
Both the antipattern identification and the supporting evidence come from artifacts the agent could only reach through the MCP tool: the application source code in Amazon S3, the Spark History Server event log, and the query plan. Without the Apache Spark Troubleshooting Agent for Amazon EMR plugged in, AWS DevOps Agent would have stopped at “the executor exited with a memory error.”
Clean up
To avoid ongoing charges, delete the resources you created. Some resources are managed by the AWS DevOps Agent console and must be removed there first. Otherwise, the CloudFormation stack deletion fails.
- In the AWS DevOps Agent console, open your
data-pipeline-troubleshootingagent space, choose the MCP Server section, selectspark-troubleshooting, and choose Remove. - From the Agent spaces list, select
data-pipeline-troubleshootingand choose Delete. - In Capability Providers, select
spark-troubleshootingand choose Deregister. - In Capability Providers → Private connections, select
smus-spark-privateand choose Delete. - Delete the AWS CloudFormation stack. This removes the Amazon VPC, the Interface VPC Endpoint, the security group, the IAM role, the Amazon EMR Serverless application, the Spark execution role, the Amazon CloudWatch alarm, and the demo logs bucket.
Conclusion
In this post, you connected the Apache Spark Troubleshooting Agent for Amazon EMR to AWS DevOps Agent as a custom MCP capability provider. You kept the traffic on the AWS network with AWS PrivateLink, and ran a failing PySpark job to see the integration end to end. A CloudWatch alarm fired, you asked the agent to investigate, and a single chat session returned the root cause along with code and configuration fixes.
You can extend this pattern beyond the demo scenario. Consider connecting the MCP server to agent spaces that monitor your production Amazon EMR environment. Any Spark job that writes a History Server event log becomes diagnosable through the same workflow.
To continue learning, explore the following resources:
- AWS DevOps Agent documentation — learn how to create agent spaces, configure integrations, and manage investigations.
- Apache Spark Troubleshooting Agent for Amazon EMR setup guide — detailed prerequisites and configuration options for the MCP server.
- Connecting MCP servers to AWS DevOps Agent — register additional MCP servers to expand your agent’s capabilities.
- Sample code on GitHub — clone the CloudFormation template, PySpark script, and Parquet data used in this walkthrough.
If you’ve already integrated the Apache Spark Troubleshooting Agent into your operational workflow, or if you’re exploring other MCP-based extensions for AWS DevOps Agent, we want to hear about your experience. Share your thoughts and questions in the comments.