AWS Big Data Blog
Build a modern analytics stack optimized for sharing and collaborating with Mode and Amazon Redshift
Leading technology companies, such as Netflix and Airbnb, are building on AWS to solve problems on the edge of the data ecosystem. While these companies show us what data and analytics make possible, the complexity and scale of their problems aren’t typical. Most of our challenges aren’t figuring out how to process billions of records to provide real-time recommendations to millions of customers. Instead, we struggle with wrangling the data that we have, finding and sharing insights from that data, and then acting on them. This leads even the most savvy data teams that have adopted tools, such as Jupyter notebooks, to either be bottlenecked by slow data pipelines, or resort to a manual process to democratize insights for their stakeholders.
This blog post walks you through the following:
- The stages of BI modernization that illustrate what problems arise when organizations adopt modern BI tools without truly modernizing the analytics platform.
- What a cloud-first data science platform, with dashboarding and notebooking solutions integrated together with efficient data pipelines, could look like.
- How to replicate such a platform in a few steps. This combines a collaborative analytics solution, such as Mode (an Amazon Redshift partner), with a strong analytics foundation built with AWS data warehousing, ETL, and data exploration services.
The stages of BI modernization
There are two primary stages in the evolution of BI – the use of Microsoft Excel for creating reports and the use of dashboarding tools for sharing insights in a consumable format.
Stage 1: The Excel workflow
At AWS and Mode, we talk to thousands of companies who are looking to get more value out of their data. When we ask them how they use data today, the most common answer we get is shown in the following example:
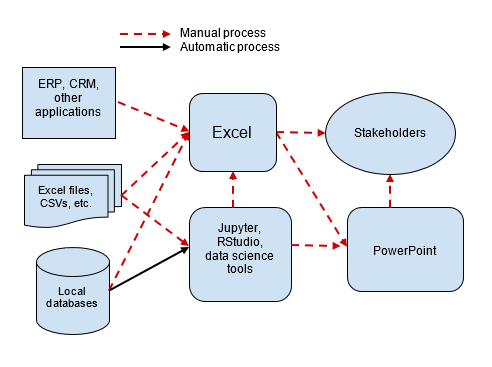
Most companies recognize this workflow as broken. The data pipelines are impossible to manage, and the analysis requires manual effort to reproduce. And in the end, we don’t know if “budget_analysis_v3_final_revised_FINAL.xls” is indeed final.
Stage 2: The dash to the dashboards
When looking for a more effective solution, companies often turn to BI products like Tableau, Amazon QuickSight, PowerBI, and Looker. These products, which were either born in the cloud or are heavily invested in it now, make it efficient to create and share reports and dashboards. KPIs can be delivered through up-to-date URLs rather than emailed files. This helps ensure that everyone has the same view of what’s happening across the business. The BI process is shown in the following example:
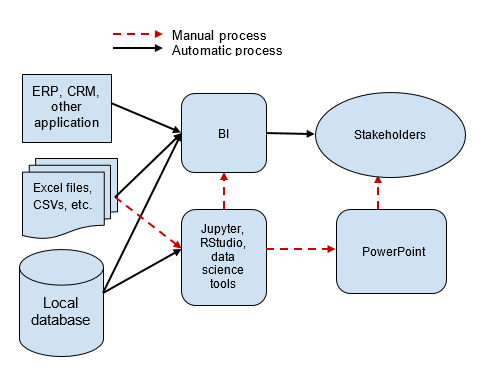
While modern BI is a significant step forward, it’s an incomplete solution. Dashboards reveal what’s happening, but businesses that want to use that data for action must understand why things are happening. Before a company can respond to falling sales in one region of the country, for example, it must understand what’s driving the drop. Because dashboards can’t be easily modified, extended, or reused for further analysis, they are often the wrong tool for analysts and data scientists who are charged with answering open-ended exploratory questions. As a result, data infrastructures remain fragmented, and analytics and data science workflows are still built on manual processes.
A cloud-first data science platform
The ideal technology stack for modern data science teams unifies these two stages described in the previous section. Dashboards should serve as the start for exploratory questions for analysts, analysts’ work should be as accessible as company dashboards, and the platform should facilitate a close collaboration between data scientists and business stakeholders.
Pioneering data teams at leading tech companies have developed internal solutions to do exactly this. Uber built a data science workbench for data exploration, data preparation, adhoc analyses, model exploration, workflow scheduling, dashboarding, and collaboration. Netflix recently unveiled the Netflix Data Platform, which automates the execution and distribution of Jupyter notebooks. Instacart built Blazer for exploring and sharing data.
All of these platforms have three things in common:
- They combine visualization tools and interactive analysis tools, such as R and Python notebooks, and a collaboration platform.
- They are powered by a modern data warehouse that can scale to accommodate any size of data and any number of analysts.
- They have reliable ETL pipelines that provide analysts and data scientists access to the data they need, when they need it.
Building a cloud-first data science platform
Fortunately, AWS and its partners offer solutions that check all these boxes and provide the same power to data science teams that aren’t able to build it themselves. Data warehousing services like Amazon Redshift and Athena are fast, scalable, and accessible to anyone who can write standard SQL. ETL partners like Fivetran, Segment, and Matillion provide reliable, push-button ETL services from hundreds of applications into Amazon Redshift and Amazon S3. Finally, a cloud-based analytics platform such as Mode combines visualizations tools, fully hosted R and Python notebooks, and a distribution platform.
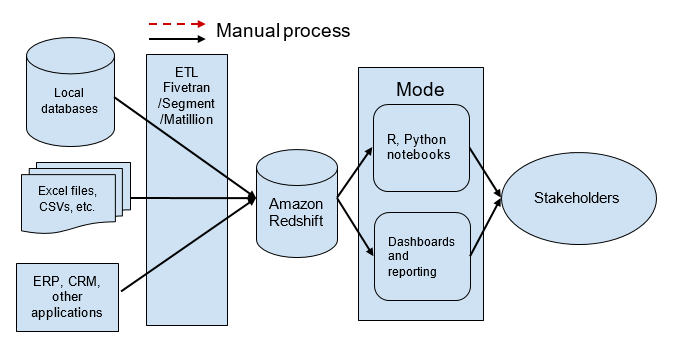
This modern stack, which is as powerful as the tooling inside Netflix or Airbnb, provides fully automated BI and data science tooling. It can be deployed in a matter of days and at a fraction of the cost of legacy data science tools.
Three steps to building the platform
Implement this data science infrastructure by using the following three steps:
- Set up a data warehouse.
- Populate your warehouse with data from around your company.
- Add a data science solution on top of your warehouse.
These steps do not require a large investment into engineering teams and custom-built software.
There are many ways to customize this stack to fit your company’s needs. However, this section shows how to set up using Amazon Redshift for a warehouse, Fivetran for ETL, and Mode for data science.
Step 1: Setting up Amazon Redshift
For information about setting up an Amazon Redshift warehouse, see Getting Started with Amazon Redshift. While you need an AWS account to set it up, the process requires no code and only takes a few minutes.
Most configuration options, including the size of the cluster, can be adjusted after the initial setup. Therefore, it’s not necessary to get everything exact at first. If a different configuration is more appropriate later, you can go back and change most of the Amazon Redshift settings.
Step 2: Populating Amazon Redshift with data
Your warehouse is only as good as the data in it. Fortunately, a number of ETL tools make it more efficient to continuously stream data from around your business and the applications you use. Application databases, third party apps like Salesforce and Zendesk, even CSV files – all of these can be easily fed into Amazon Redshift without any engineering effort.
Fivetran, an Amazon Redshift partner, is one such ETL tool (it’s a tool that we’re happy with at Mode). To connect Fivetran to your Amazon Redshift database, first configure your database to allow Fivetran to connect. Fivetran supports a variety of options for connecting, including connecting directly or by using an SSH tunnel. For more information about the steps, see the connection options.
As a final step, create an Amazon Redshift user for Fivetran. We recommend that you use another user than the master user. To create this user, log into the Amazon Redshift query editor (or a SQL client of your choice) and run the following commands:
After Amazon Redshift is configured:
- Create a new Fivetran account.
- Select I already have an existing warehouse, then choose Redshift.
- Fill out the form with your Amazon Redshift credentials, as shown in the following example, then choose Save.
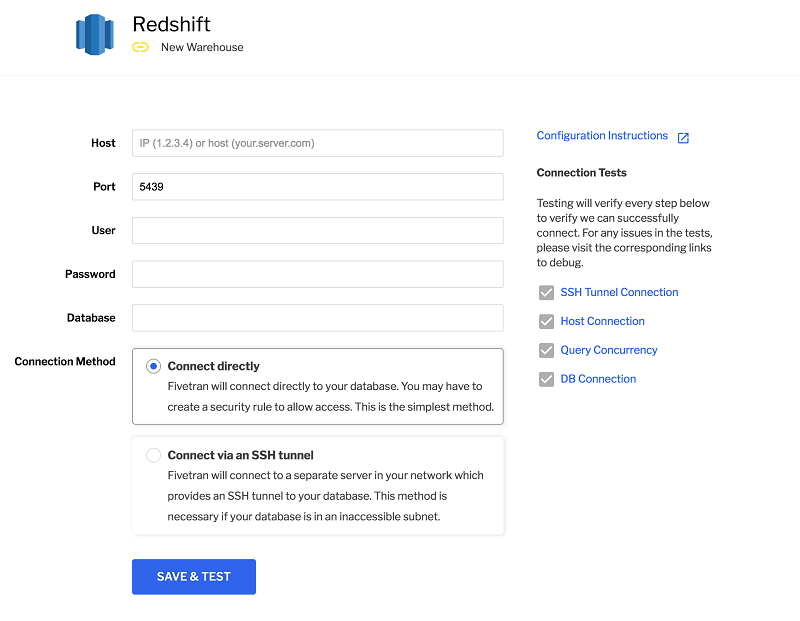
- After Fivetran is connected to Amazon Redshift, connect it with the data sources that you want to pull into Amazon Redshift. This process is now more efficient.
- In Fivetran, choose Connectors.
- Choose Add connector, then choose the data source that you want to integrate. Though the specifics vary by source, most of them follow the same pattern.
- Choose a schema in Amazon Redshift that you want to write your data to, and then follow the authorization flow that Fivetran automatically steps you through.
The following are examples of connection flows:

Connection flow for Salesforce

Connection flow for Google Analytics
By using similar flows, you can also connect other databases, such as Amazon RDS Postgres or the MySQL database, and directly upload CSVs.
When these connections are set up, data automatically syncs between your data sources and Amazon Redshift. If you want more control, Fivetran lets you choose which data to sync, and how often it’s updated.
Can’t find the data source you’re looking for? Other ETL tools, including Stitch Data, Segment, and ETLeap, provide similar services that are just as easy to set up. We recommend this guide when making a decision about which tool is right for you.
Step 3: Connecting Amazon Redshift to Mode
Finally, by connecting Mode to your Amazon Redshift, you can provide your entire company access to your data in a collaborative analytics environment.
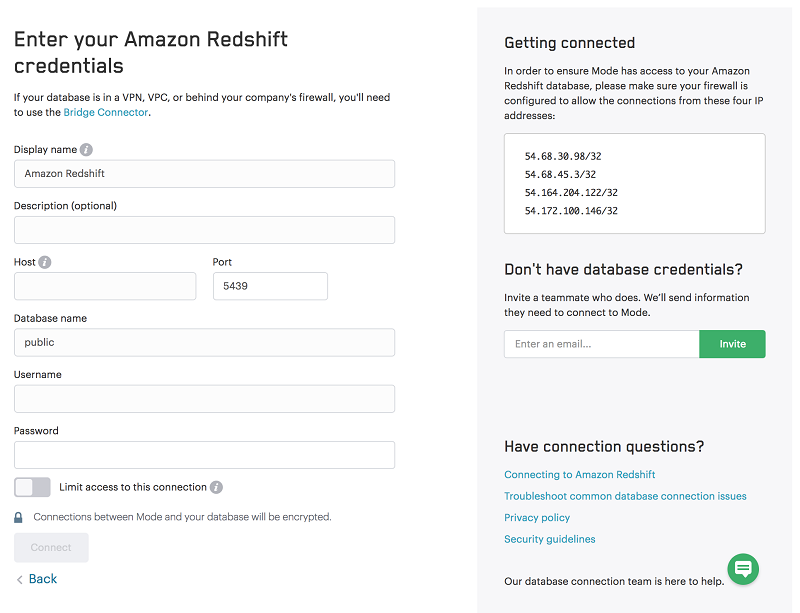
To connect Mode, configure your security groups so that Mode can access Amazon Redshift. If you’re connecting Mode directly to your cluster, follow the security groups documentation linked above to grant access to the following IP addresses:
54.68.30.98/32
54.68.45.3/32
54.164.204.122/32
54.172.100.146/32
Mode also offers alternative ways of connecting if you’re unable to modify your firewall.
After you’ve completed these steps, you need only enter your credentials on Mode’s data source connection page, as shown in the following example:
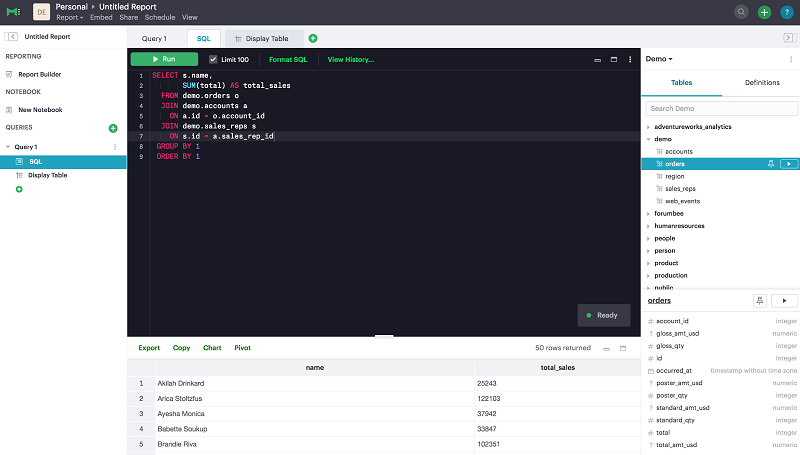
After the connection is made, choose who in your organization can access that connection. Then you can immediately query your data and build the analysis for your team from the Mode Editor, as shown in the following example:
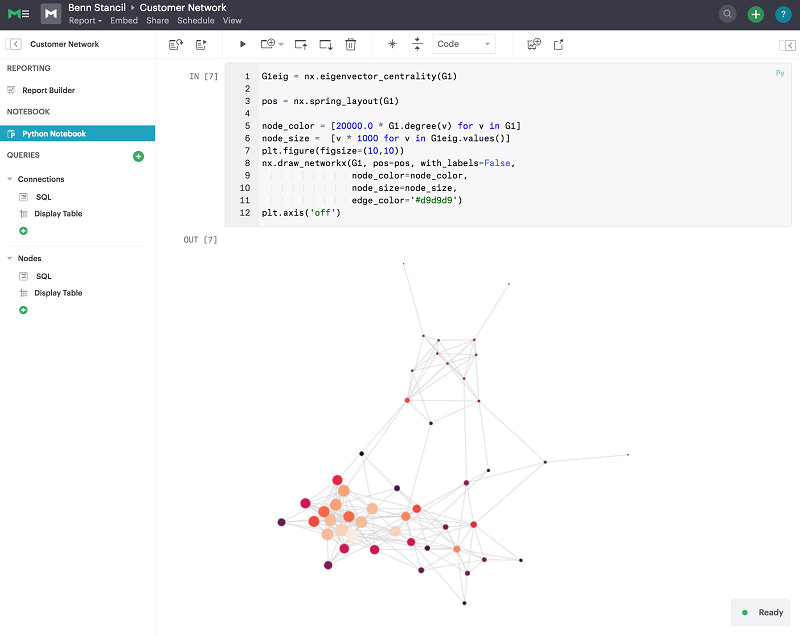
In addition to a SQL environment and visualization builder, Mode also offers integrated Python and R notebooks. Choose New Notebook in the left navigation bar to start a new Python or R instance that’s automatically populated with your query results as DataFrames. This enables data scientists to seamlessly create and share analysis directly with everyone around the company. Ultimately, this approach lets you build the most flexible platform for your analytical needs. Your business analysts and data scientists can now work in the same environment. They can collaborate seamlessly, and access the same data at all times.
Conclusion
This new architecture lets organizations to do more with their data, faster. Data teams that use Python and R can go beyond sharing static dashboards and reports; instead, they can also use popular forecasting and machine learning libraries like Prophet and TensorFlow. These libraries help teams find insights that they couldn’t have found otherwise. This lets teams deliver regular updates that keep everyone informed, and also answer strategic and high-value questions that drive key decisions. Moreover, Mode makes these analyses accessible to everyone around the business. Because the notebooks are fully managed, data scientists can share their work directly with stakeholders without any extra work from IT departments.
By combining Mode with Amazon Redshift, data teams also remove common bottlenecks in data integration, cleansing, or ETL processes that loads data into Amazon Redshift. With Amazon Redshift Spectrum, they can query data directly in their Amazon S3 data lake from a Mode dashboard or notebook. Moreover, they can combine these queries with data already loaded into the data warehouse.
Try it yourself
We’ve built an experience for you to get a feel for this stack. If you think it could work for your case, you can get started using Mode with Amazon Redshift in a matter of minutes. If you’re not already using Amazon Redshift, you can get started with a 2-month free trial and deploy the solution, as suggested. With Mode connected to Amazon Redshift, you can start exploring your data right away or try using one of the publicly available datasets.
About the Authors
 Benn Stancil is a cofounder and Chief Analyst at Mode, a company building collaborative tools for data scientists and analysts. Benn is responsible for overseeing Mode’s internal analytics efforts, and is also an active contributor to the data science community. In addition, Benn provides strategic guidance to Mode’s product direction as a member of the product leadership team.
 Ayush Jain is a Product Marketer at Amazon Web Services. He loves growing cloud services and helping customers get more value from the cloud deployments. He has several years of experience in Software Development, Product Management and Product Marketing in developer and data services.
 Himanshu Raja is a Senior Product Manager for Amazon Redshift. Himanshu loves solving hard problems with data and cherishes moments when data goes against intuition. In his spare time, Himanshu enjoys cooking Indian food and watching action movies.