Containers
Part 2: Observing and scaling MLOps infrastructure on Amazon EKS
In part 1 of this series, Introduction to observing machine learning workloads on Amazon EKS, we established several key foundational concepts. We explored the fundamental differences between monitoring machine learning (ML) and traditional workloads, emphasizing how ML systems require more specialized metrics and granular monitoring. We detailed the essential metrics needed across ML infrastructure, model performance, and workload deployment on Amazon Elastic Kubernetes Service (Amazon EKS), including critical indicators such as model accuracy, inference latency, and resource usage. Furthermore, we examined how different roles, from data scientists to DevOps engineers, have unique monitoring requirements that shape the overall observability strategy.
In this post, we focus on observing and scaling ML operations (MLOps) infrastructure on Kubernetes. MLOps platforms running on Amazon EKS provide powerful built-in capabilities for logging, monitoring, and alerting that are essential for maintaining healthy ML systems at scale. When deploying tools such as Airflow, JupyterHub, Ray, Kubeflow, or MLflow on Amazon EKS, you need a comprehensive observability strategy that uses both Amazon Web Services (AWS) services and cloud tooling. Amazon EKS integrates seamlessly with Amazon CloudWatch for logging and monitoring capabilities, but many organizations choose to implement other open source observability stacks into their ML workloads. The most common pattern involves using Prometheus for metrics collection, Grafana for visualization, and Kubernetes-native resources for automated scaling. You can use this setup to monitor everything from infrastructure metrics (CPU, memory, and GPU usage) to ML-specific metrics (model inference latency, training job progress, and batch processing throughput).
The unique challenges of MLOps monitoring
ML workloads present distinct monitoring challenges when compared to traditional applications. ML systems involve complex pipelines with multiple stages, such as data preprocessing, model training, validation, and inference, each with different resource requirements and failure modes. The computational demands have evolved from statistical models to complex neural networks requiring massive parallel processing power.
The democratization of large language models (LLMs), computer vision, and generative AI has created unprecedented demand for specialized hardware accelerators. Understanding the monitoring requirements for different types of compute infrastructure is crucial for building effective observability strategies. Before diving into monitoring implementations, we can examine the hardware landscape that powers modern ML workloads.
Understanding your ML hardware landscape
Accelerated computing represents a paradigm shift from traditional CPU-based processing to specialized hardware designed for parallel computation. Unlike general-purpose processors that excel at sequential tasks, accelerators are optimized for the mathematical operations that form the backbone of ML, such as matrix multiplications, convolutions, and tensor operations.
In particular, the emergence of transformer architectures has driven this evolution. Training models such as GPT, Llama, or Claude need to process billions of parameters through trillions of calculations. Traditional CPU architectures become inefficient for these highly parallel, mathematically intensive operations.
NVIDIA GPUs with CUDA
Compute Unified Device Architecture (CUDA) is a parallel computing platform and programming model developed by NVIDIA for general computing on graphical processing units (GPUs). CUDA cores are the fundamental computational units within NVIDIA GPUs that enable massive parallel processing for ML workloads. Modern consumer-grade GPUs, such as the NVIDIA RTX 4090 feature 16,384 CUDA cores when compared to typical CPU systems with 16 cores. This massive difference enables GPUs to excel at the parallel computations required for ML tasks.
Key features for ML workloads
- Parallel processing architecture: Distributes operations such as matrix multiplications across thousands of cores simultaneously
- High memory bandwidth: Essential for AI tasks that require frequent data access during processing
- Specialized tensor cores: Hardware specifically designed to accelerate deep learning matrix operations
Latest advancements (NVIDIA GPUs and AWS Custom silicon chips)
- NVIDIA Blackwell Architecture (B100/B200): The latest generation features 208 billion transistors with dual-die design, offering up to 18 PFLOPS in sparse FP4 tensor operations and 180 GB of HBM3E memory.
- NVIDIA H200 Tensor Core GPU: Based on Hopper architecture, offering 141 GB of HBM3e memory at 4.8 TB/s bandwidth—nearly double the H100’s capacity with 1.4 times more memory bandwidth.
- AWS Trainium2 (2025): Delivers up to four times the performance of first-generation Trainium with 20.8 petaflops of FP8 compute and 30-40% better price performance than comparable GPU instances.
- AWS Inferentia2: Optimized for inference workloads, offering up to four times higher throughput and ten times lower latency when compared to Inferentia, with 32 GB of HBM per chip.
Building your monitoring strategy framework
With this understanding of the diverse hardware landscape and their specific characteristics, we can now build a comprehensive monitoring strategy that addresses the unique requirements of each accelerator type. The key is to layer your monitoring approach: infrastructure metrics form the foundation, while application specific metrics provide insights into ML workflow performance.
Essential metrics by hardware type
Usage hardware metrics:
- Usage percentage: Tracks compute capacity usage across all accelerator types
- Memory usage patterns: Prevents bottlenecks and identifies optimization opportunities
- Temperature monitoring: Critical for preventing thermal throttling
- Power consumption: Essential for cost optimization and capacity planning
NVIDIA GPU-specific metrics:
- CUDA core usage:
DCGM_FI_DEV_GPU_UTILprovides standard GPU usage metrics - Tensor core activity:
DCGM_FI_PROF_GR_ENGINE_ACTIVEshows graphics/compute engine usage - Memory bandwidth usage: Critical for identifying data transfer bottlenecks
- Streaming Multiprocessor (SM) occupancy: Indicates how efficiently the GPU’s compute units are being used
Hardware health indicators:
- Fan speed and temperature: Prevents overheating and performance degradation
- Error Correcting Code (ECC) errors: Volatile ECC SB / DB monitoring for memory reliability
- Multi-Instance GPU (MIG) metrics: For A100/H100 deployments using MIG partitioning
MLOps specific performance indicators:
- Samples per second per GPU: Direct measure of training throughput
- Loss convergence rate: Correlation between hardware usage and model improvement
- Gradient synchronization latency: Critical for distributed training efficiency
- Cost per trained sample: Direct cost efficiency measurement
AWS Neuron specific metrics
Neurocore performance:
- NeuronCore usage: Gain a granular view of memory and vCPU usage across NeuronCores. This helps you understand how effectively resources are being used and when it might be the time to rebalance workloads or scale the resources.
- Model execution latency: End-to-end inference time for deployed models.
- Execution status: Monitor how many model inference runs and complete successfully per second, and track failed or incomplete inferences.
System health monitoring:
- Error rates: Compilation failures and runtime errors
- Hardware health indicators: Chip temperature, power consumption, and overall system stability
- vCPU usage: Keep an eye on vCPU usage to establish that your models aren’t overburdening the infrastructure
Implementing Prometheus for metrics collection
We have walked through which metrics we need to monitor across different hardware types, so we can explore how to collect and operationalize these metrics using Prometheus, the actual standard for Kubernetes monitoring.
Understanding Prometheus
Prometheus is an open source monitoring and alerting toolkit, widely adopted in the Kubernetes ecosystem. It collects and stores time-series data as metrics, making it ideal for monitoring MLOps infrastructure. Prometheus uses a pull-based model, scraping metrics from configured targets at regular intervals. This approach is well-suited for dynamic environments such as Kubernetes, where services might come and go frequently. Amazon Managed Service for Prometheus is a fully managed Prometheus-compatible service that you can use to monitor environments securely and reliably, such as Amazon EKS, Amazon Elastic Container Service (Amazon ECS), and Amazon Elastic Compute Cloud (Amazon EC2). The following is a screenshot of targets from which Prometheus is pulling the metrics.

Figure 1. A screenshot of Prometheus UI showing targets from which this Prometheus server is pulling metrics
Prometheus exposition formats
Prometheus expects metrics to be exposed in a specific text-based format. This format typically includes a metric name, labels (key-value pairs for more context), and the metric value. MLOps tools such as Airflow, JupyterHub, and Kubeflow often expose metrics in this format by default or through plugins. For example:
Although Prometheus is popular, it isn’t the only option. Cloud providers offer their own monitoring solutions, such as CloudWatch for Amazon EKS. When choosing a monitoring system for MLOps workloads, consider factors such as scalability, integration with existing tools, and specific metrics needed for ML workflows. Prometheus’s wide adoption and integration with Kubernetes make it a solid choice for most MLOps setups.
The kube-prometheus-stack
In this section we break down the kube-prometheus-stack components, which is a collection of Kubernetes manifests that provides a complete monitoring solution.
- Prometheus Operator: The
kube prometheus operatoris the brain behind the whole setup. It watches the Kubernetes API for custom resources such as ServiceMonitor, PodMonitor, Prometheus, and Alertmanager objects. - Kube-state-metrics:
kube-state-metricsis a metrics generator, not a scraper. It watches the Kubernetes API and exports cluster state as metrics. It doesn’t monitor CPU or memory usage—that’s Node Exporter’s job.kube-state-metricsis purely about the health and state of Kubernetes objects. - Node Exporter:
prometheus-node-exporteris deployed as a DaemonSet. It gathers system-level metrics such as CPU usage, memory usage, disk I/O, filesystem stats, and network throughput. - Grafana:
kube-prometheus-stack-grafanais your visualization layer. It’s where you build dashboards, divide and detail metrics, and make pretty graphs that turn into 2 a.m. on-call alerts. It connects directly to Prometheus as a data source and pulls whichever metrics you want to observe. This pod typically runs three containers: Grafana itself, a config reloader that reloads Grafana configuration on-the-fly, and a sidecar that imports some prebuilt dashboards and data sources automatically. - Prometheus Server:
kube-prome-prometheus-0is deployed as a statefulset, not a regular deployment. This is due to Prometheus needing stable network identities and persistent storage, because it’s not only spinning up stateless web servers. Typically, this StatefulSet is backed by a block storage device (a PersistentVolumeClaim), where Prometheus writes its time series database (TSDB) to disk. This TSDB is where Prometheus stores all your scraped metrics that is compressed, chunked, and optimized for fast reads.
Out-of-the-box, Prometheus scrapes essential metrics from multiple sources that are critical for ML operations:
- Node Exporter provides hardware-level metrics (CPU, memory, and disk I/O) that help you identify resource bottlenecks affecting model training speed.
- kube-state-metrics tracks Kubernetes object states, helping you monitor ML job completions and pod health.
- System components (API server, etcd, and scheduler) provide cluster-level metrics that impact job scheduling and overall platform reliability.
Understanding these default metrics is crucial because ML workloads often fail in subtle ways. For example, a failing model training job might not be because of your code, but rather node-level memory pressure or scheduler queuing delays. When troubleshooting ML pipeline issues, start by checking these foundation metrics before diving into application-specific metrics from your ML tools. For example, if your Ray training job is running slowly, then checking Node Exporter metrics might reveal GPU memory constraints, while kube-state-metrics might show if pods are being evicted because of resource pressure. This layered understanding, from hardware to Kubernetes to ML applications, is essential for effective MLOps troubleshooting.
ServiceMonitor and PodMonitor are custom resources used by the Prometheus Operator to dynamically configure scrape targets. You can use them to define which services or pods should be monitored without manually updating Prometheus configuration. The following is an example of ServiceMonitor for an MLflow deployment:
Implementing scaling based on custom metrics
You can use custom metrics to scale your MLOps components based on application-specific data rather than just CPU or memory usage. This is particularly useful for ML workloads where traditional resource metrics may not accurately reflect system load. The Prometheus Adapter translates Prometheus metrics into a format that Kubernetes’ autoscaler can understand.
Monitoring and scaling an application
To monitor and scale an MLOps application, you typically expose relevant metrics (for example, number of active model serving requests), scrape these metrics with Prometheus, and use them to inform scaling decisions. This pattern applies across tools such as Airflow, Ray, and Kubeflow, so that you can scale based on workload-specific indicators. The following is an example of creating a ServiceMonitor that defines how Prometheus should scrape metrics from a service for a Ray cluster:
The following is an example of scaling workloads horizontally. Horizontal Pod Autoscaler (HPA) can use custom metrics to scale your MLOps workloads. This is an HPA for scaling a JupyterHub deployment based on the number of active users:
Visualizing ML operations with Grafana
Grafana is a popular open source platform for visualizing time-series data. It integrates seamlessly with Prometheus so that you can create dashboards that display metrics from your MLOps infrastructure. You can use Grafana’s flexibility to create custom visualizations tailored to specific ML workflows and components. Amazon Managed Grafana is a fully managed and secure data visualization service for open source Grafana that customers can use to query, correlate, and visualize operational metrics, logs, and traces for their applications from multiple data sources.
When exploring Grafana for MLOps monitoring, create dashboards focusing on these essential metrics across your stack:
- Infrastructure metrics: CPU usage, memory usage, disk I/O, and GPU usage indicate resource constraints that could impact model training and serving performance.
- System-level metrics: Network throughput, pod restart counts, and node status help identify stability issues before they affect production workloads.
- Application-specific metrics including the following:
- Airflow task success rates and DAG duration for workflow monitoring
- Ray cluster resource allocation and task queue depth for distributed training optimization
- Kubeflow model serving latencies and request throughput for SLA compliance
- MLflow experiment tracking metrics for training progress monitoring
You can use Grafana to combine these metrics in a single view and correlate issues across layers. For example, you can link high model serving latency to underlying CPU constraints or network congestion, as shown in the following figure.

Figure 2. Screenshot of Grafana dashboard showing the number of requests and cache usage percentage
This general pattern of exposing metrics, scraping them with Prometheus, using them for auto scaling, and visualizing them with Grafana can be applied across various MLOps tools. You can follow this approach to create a unified monitoring and scaling solution for your entire MLOps infrastructure, regardless of any specific tools which are in use.
Monitoring with third party solutions
When to consider third-party solutions:
Modern observability platforms have evolved to meet the unique challenges of monitoring AI/ML infrastructure and workflows. These solutions offer the following specialized features tailored for ML operations:
- GPU monitoring: Deep integration with NVIDIA DCGM and AWS Neuron SDK for comprehensive accelerator monitoring
- ML framework integration: Native support for TensorFlow, PyTorch, and other frameworks with automatic metric discovery
- Automated anomaly detection: AI-powered detection specifically tuned for ML workload patterns
- Cost optimization: Real-time insights into resource allocation and cost optimization opportunities
Evaluation criteria
When selecting an observability solution for AI/ML workloads, consider the following:
- Scale of ML operations: Volume of models, training jobs, and inference requests
- Infrastructure environment: Cloud, hybrid, or multi-cloud deployments
- Integration requirements: Compatibility with existing tools and workflows
- Team expertise: Available skills for configuration and maintenance
- Budget constraints: Total cost of ownership including licensing and operational overhead
Today’s monitoring tools have transformed to address the specific demands of tracking AI and ML systems. These modern observability platforms include custom-built capabilities designed specifically for managing and monitoring ML operations and infrastructure, providing real-time insights into model training, resource usage, and overall performance. Leading platforms in this space have developed capabilities such as GPU monitoring, custom ML framework integrations, and automated anomaly detection specifically for AI workloads. Data scientists and ML engineers can use them to track key metrics such as loss, accuracy, and convergence in real-time, while also providing visibility into resource allocation and cost optimization opportunities.
The value of these observability solutions for model training lies in their comprehensive view of the entire ML pipeline, from data preparation to model deployment and prediction services. Teams can use these platforms for real-time visibility into training progress and resource usage, thereby detecting issues early, optimizing performance, and making data-driven decisions about infrastructure scaling. Advanced features such as automated ML infrastructure discovery and AI-powered anomaly detection further streamline operations so that teams can focus on improving models rather than troubleshooting infrastructure.
Leading observability partners excel in combining infrastructure monitoring with security insights, helping teams quickly detect and troubleshoot issues across their containerized workloads. These advanced platforms integrate various data sources to provide a holistic view of both the operational health and security posture of complex, distributed systems. DevOps and security teams can use these tools to unify metrics, logs, and traces with security telemetry, and collaborate more effectively, identifying and resolving potential issues before they impact production environments. This integrated approach to observability and security is particularly valuable in the context of AI/ML workloads, where the stakes of both performance and data protection are often high.
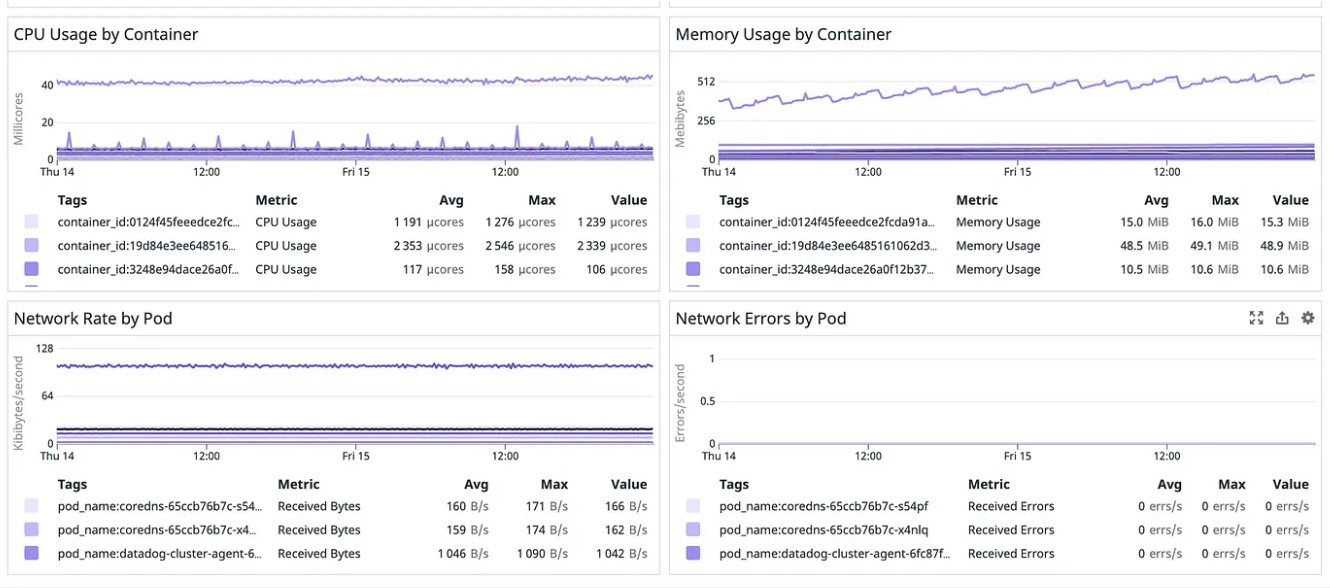
Figure 3. Screenshot of Grafana dashboard showing the CPU and Memory usage
When selecting an observability solution for AI/ML workloads, organizations must consider factors such as the scale of their ML operations, their infrastructure environment (cloud, hybrid, or multi-cloud), integration requirements, budget constraints, and team expertise. Some solutions excel in providing deep, AI-driven insights with minimal configuration, while others offer greater flexibility and control for teams with specific needs. Ultimately, the right choice depends on finding a balance between comprehensive ML-specific monitoring capabilities and alignment with the organization’s broader observability strategy.
Conclusion
Effective monitoring of ML infrastructure on Amazon EKS requires a layered approach that addresses the unique characteristics of modern AI workloads. From understanding the hardware landscape (whether NVIDIA GPUs with CUDA cores or AWS custom silicon) to implementing comprehensive monitoring strategies, each component plays a crucial role in maintaining robust ML operations at scale.
The integration of AWS services, such as Amazon CloudWatch, open source tools such as Prometheus and Grafana, and specialized MLOps platform capabilities, provides a robust foundation for observability. Organizations can use this comprehensive approach to:
- Optimize resource usage: Monitor GPU and accelerator usage to maximize cost efficiency
- Maintain high availability: Proactively detect and resolve issues before they impact production workloads
- Verify compliance: Track governance requirements across the ML lifecycle
- Scale effectively: Use ML-specific metrics to drive automated scaling decisions
- Control sots: Gain visibility into resource consumption and optimization opportunities
As ML workloads continue to grow in complexity and scale, implementing a comprehensive monitoring strategy becomes increasingly critical. The key is building a monitoring infrastructure that provides both broad visibility across your infrastructure and deep insights into your ML operations.
In our next post, we focus on the crucial aspect of cost monitoring for ML infrastructure and models on Amazon EKS. We explore how to implement cost optimization strategies using tools such as Kubecost, and their integration with AWS Cost Explorer and AWS Budgets. This comprehensive cost monitoring approach helps organizations maintain efficient ML operations while optimizing their infrastructure spend.
About the authors
 Elamaran (Ela) Shanmugam is a Senior Container Specialist Solutions Architect at Amazon Web Services with over 20 years of experience in enterprise systems and infrastructure. Ela specializes in container technologies, app modernization, observability, and machine learning, Agentic AI, helping AWS Global Financial Services customers and partners design scalable and secure container workloads. Based in Tampa, Florida, Ela contributes to open source projects, speaks at events, mentors, and creates technical content.
 Sanjeev Ganjihal is a Sr. Specialist Solutions Architect for Containers at AWS. Sanjeev specializes in Service Mesh, Platform Engineering, Generative AI, Prompt Engineering, GitOps, IAC, Autoscaling, Cost Optimization & Observability. He helps customers in modernizing their applications by transitioning to containerized solutions, implementing AWS best practices, and steering their journey through cloud transformation. He is actively spending time on integrating AI with cloud-native solutions, delving into the realms of generative AI, prompt engineering, and harnessing data on Kubernetes. Outside of work he likes playing cricket and spends his time with his family.
 Isha Dua is a Senior Solutions Architect based in San Francisco Bay Area. She helps AWS Enterprise customers grow, by understanding their goals and challenges. She offers guidance to companies on architecting their applications in a cloud native manner, while making sure they are resilient and scalable. She’s passionate about machine learning technologies and Environmental Sustainability.