Containers
Proactive Amazon EKS monitoring with Amazon CloudWatch Operator and AWS Control Plane metrics
Organizations running Kubernetes workloads on Amazon Elastic Kubernetes Service (Amazon EKS) need comprehensive monitoring for optimal cluster performance and reliability. Although Amazon EKS manages the control plane, maintaining workload health requires monitoring capabilities. This post explores using the Amazon CloudWatch monitoring, including new Amazon EKS metrics and the CloudWatch Observability Operator, to gain deeper visibility into cluster operations, detect issues, understand bottlenecks, and maintain healthy EKS clusters.
Understanding basic CloudWatch metrics
Before Amazon EKS 1.28, control plane metrics were available only through the Kubernetes API server’s /metrics endpoint (Prometheus format). Amazon EKS 1.28+ automatically sends core Kubernetes control plane metrics to CloudWatch in the AWS/EKS namespace at no extra cost. These metrics are accessible through Amazon EKS console dashboards and CloudWatch. Key metric categories include the following:
- API server metrics: Monitor API server health through total requests, HTTP 4XX/5XX errors, and throttling to detect bottlenecks or performance degradation.
- Scheduler metrics: Monitor pod scheduling attempts and pending pods (
active/backoff/gated/unschedulablequeues) to detect scheduling bottlenecks, such as under-resourced worker nodes. - etcd metrics: Monitor database size and performance to maintain a healthy etcd cluster.
Enhanced monitoring with CloudWatch Observability Operator
The following figure shows the architecture for viewing application and cluster metrics through CloudWatch Container Insights and the Amazon EKS console pre-built dashboards.
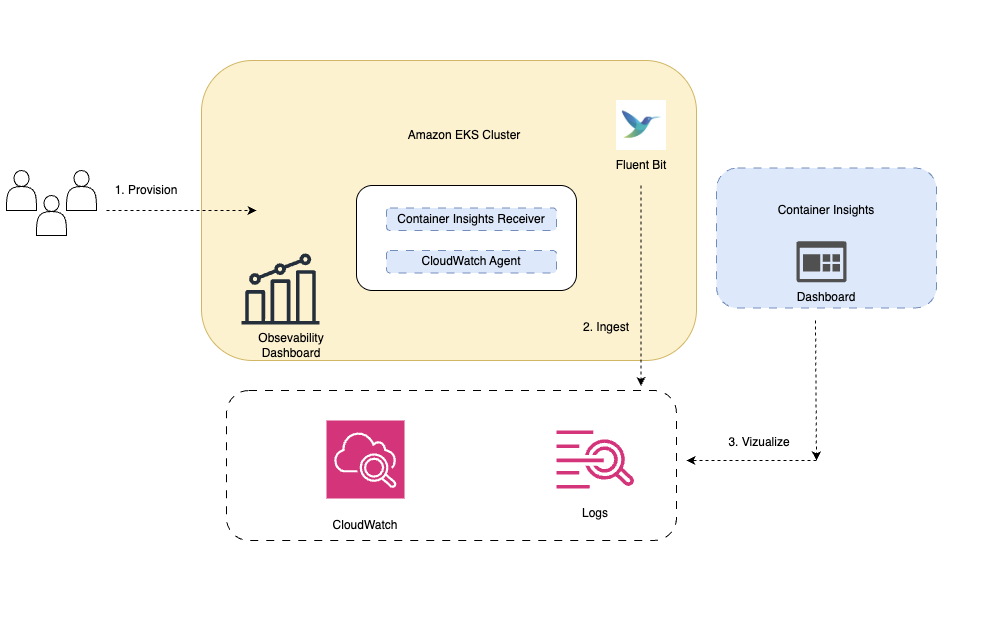
Figure1: Architecture showing enhanced monitoring with CloudWatch Observability Operator for EKS clusters
CloudWatch monitors cloud resources and applications. The CloudWatch Observability Operator, when added to Amazon EKS as an Amazon EKS add-on, automatically instruments applications using CloudWatch Application Signals and Container Insights. It collects logs, metrics, and traces from containerized environments, sending telemetry data to CloudWatch. You can use pre-built dashboards to track Amazon EKS infrastructure and application health, helping identify potential issues early.
Prerequisites
The following prerequisites are necessary to complete this solution:
- An Amazon Web Services (AWS) account
- Follow the Getting Started section in the Amazon EKS documentation to install AWS CLI, kubectl, and eksctl v0.211.0 on your dev machine
Walkthrough
In this section, we create a new EKS cluster and walkthrough the new monitoring dashboards and Kubernetes control plane metrics.
Setup
Start by setting up environment variables.
Installing and configuring the CloudWatch Observability Operator
To install and configure the CloudWatch Observability Operator, use eksctl to create a 1.32 cluster with the operator enabled as an add-on. Create a cluster configuration file with the following specifications:
After the cluster creation completes, the CloudWatch Observability Operator is installed and ready to collect metrics from your cluster.
Basic CloudWatch metrics
Amazon EKS 1.28+ automatically enables control plane monitoring. To view metrics:
- Log in to the Amazon EKS console.
- Go to Amazon EKS > choose your cluster > Overview > Monitor cluster > Control plane monitoring observability dashboard.
The dashboard displays control plane metrics for cluster health, as shown in the following figure. For metric details, refer to Amazon EKS enhances Kubernetes control plane observability.

Figure 2: Amazon EKS observability dashboard displaying comprehensive control plane metrics
CloudWatch Container Insights
Enable CloudWatch Container Insights for EKS clusters to automate collection of metrics, logs, and traces from containerized workloads. This provides deep insights into cluster, service, and pod health/performance.
To fully enable Container Insights with the setup, apply the following AWS Identity and Access Management (IAM) configurations:
After enabling Container Insights, you can access performance dashboards that provide views at multiple levels: Cluster, Node, Namespace, Service, Workloads, Pod, and Container, with metrics such as CPU, memory, network, and status for each level.
The Container Insights dashboard summarizes cluster/control-plane metrics, displaying status and alarms, as shown in the following figure. It uses CPU/memory thresholds to flag high resource usage, enabling preemptive fixes to avoid performance issues.
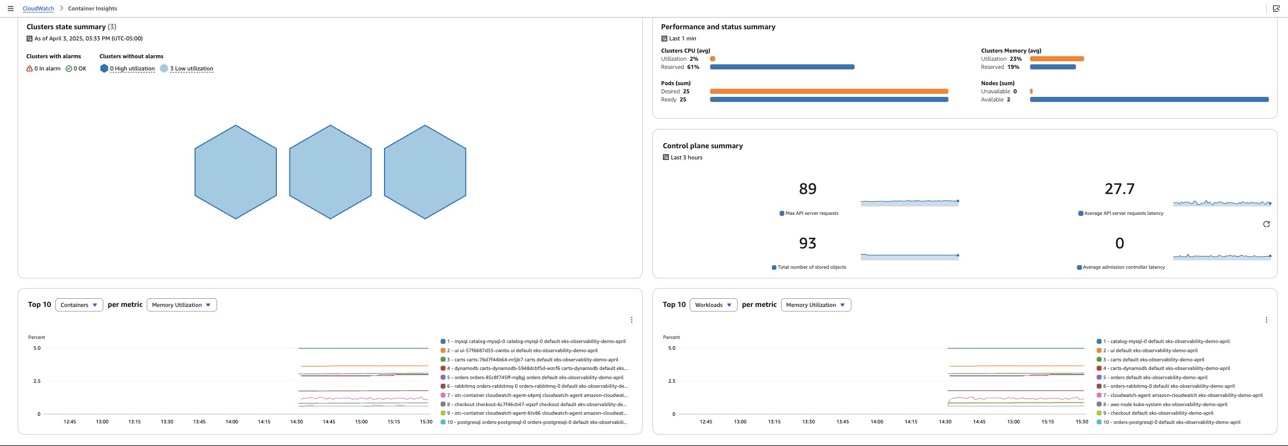
Figure 3: CloudWatch Container Insights dashboard with comprehensive cluster monitoring views
For a complete list of available metrics, see the Container Insights documentation, and for deeper insights into enhanced observability features, refer to Announcing Amazon CloudWatch Container Insights with Enhanced Observability for Amazon EKS on EC2.
CloudWatch Application Signals
CloudWatch Application Signals automates monitoring for AWS workloads with minimal setup, auto-instrumenting apps to collect metrics, traces, and logs.
Key benefits:
- No-code change: Monitor apps without code changes
- Unified dashboards: View performance, logs, and user activity in one place
- Pre-built dashboards: Track traffic, latency, availability, and resource use
- Faster fixes: Correlated data speeds up issue detection/resolution
To demonstrate Application Signals, deploy a sample application:
To enable Amazon CloudWatch Application Signals for the retail store application, as shown in the following figure, follow these steps:
- In CloudWatch console, enable Application Signals.
- Choose EKS platform and choose the eks-observability-demo cluster.
- Confirm the CloudWatch Observability EKS add-on is created.
- Choose Console setup, choose all Java services in the default namespace.
- Choose Done.
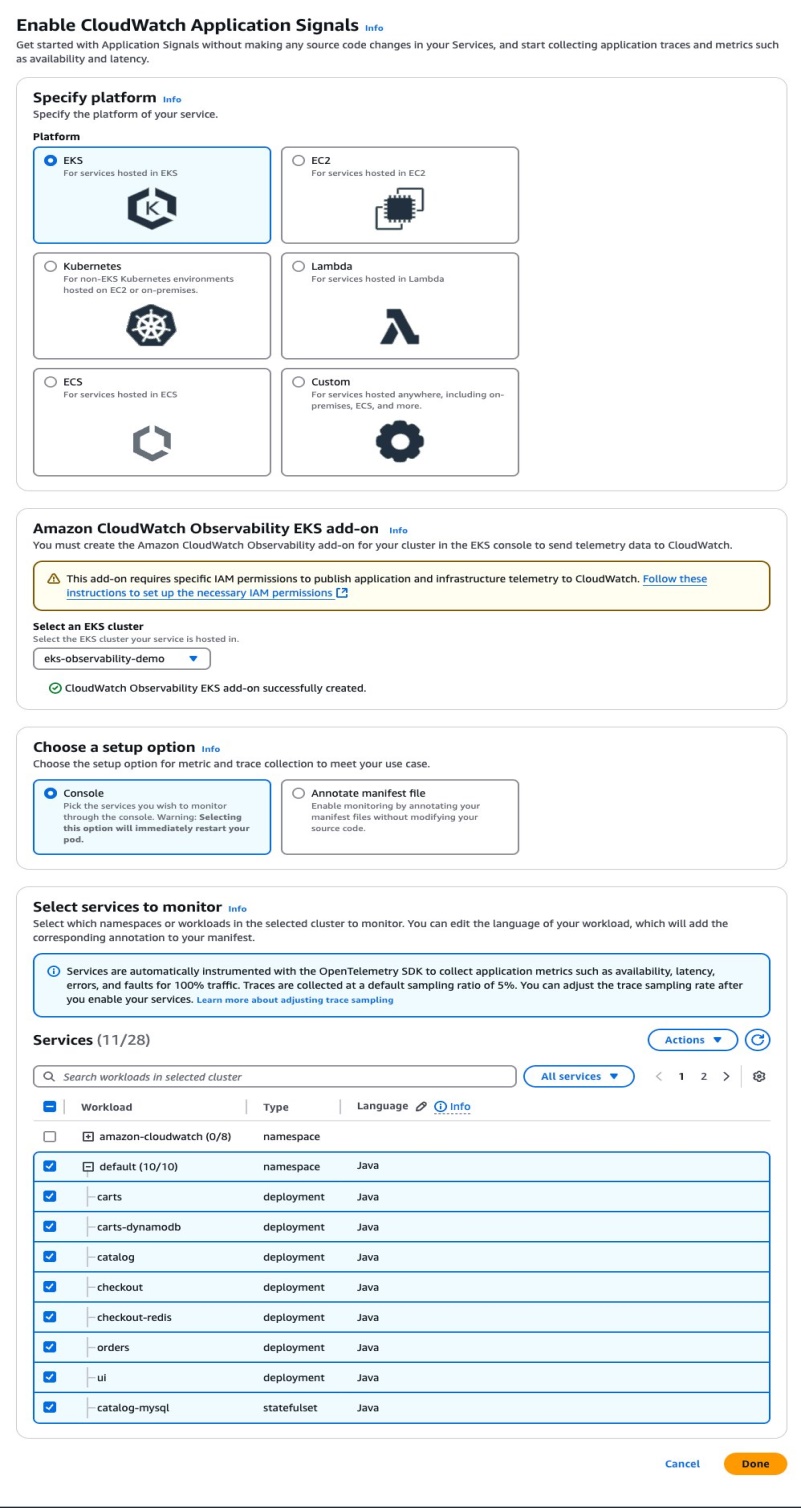
Figure 4: Enabling Application Signals for retail store microservices
After setup, check the CloudWatch console’s Application Signals Services to confirm monitoring is active. It lists your retail store app’s Java services with telemetry collected at a 5% sampling rate, as shown in the following figure.
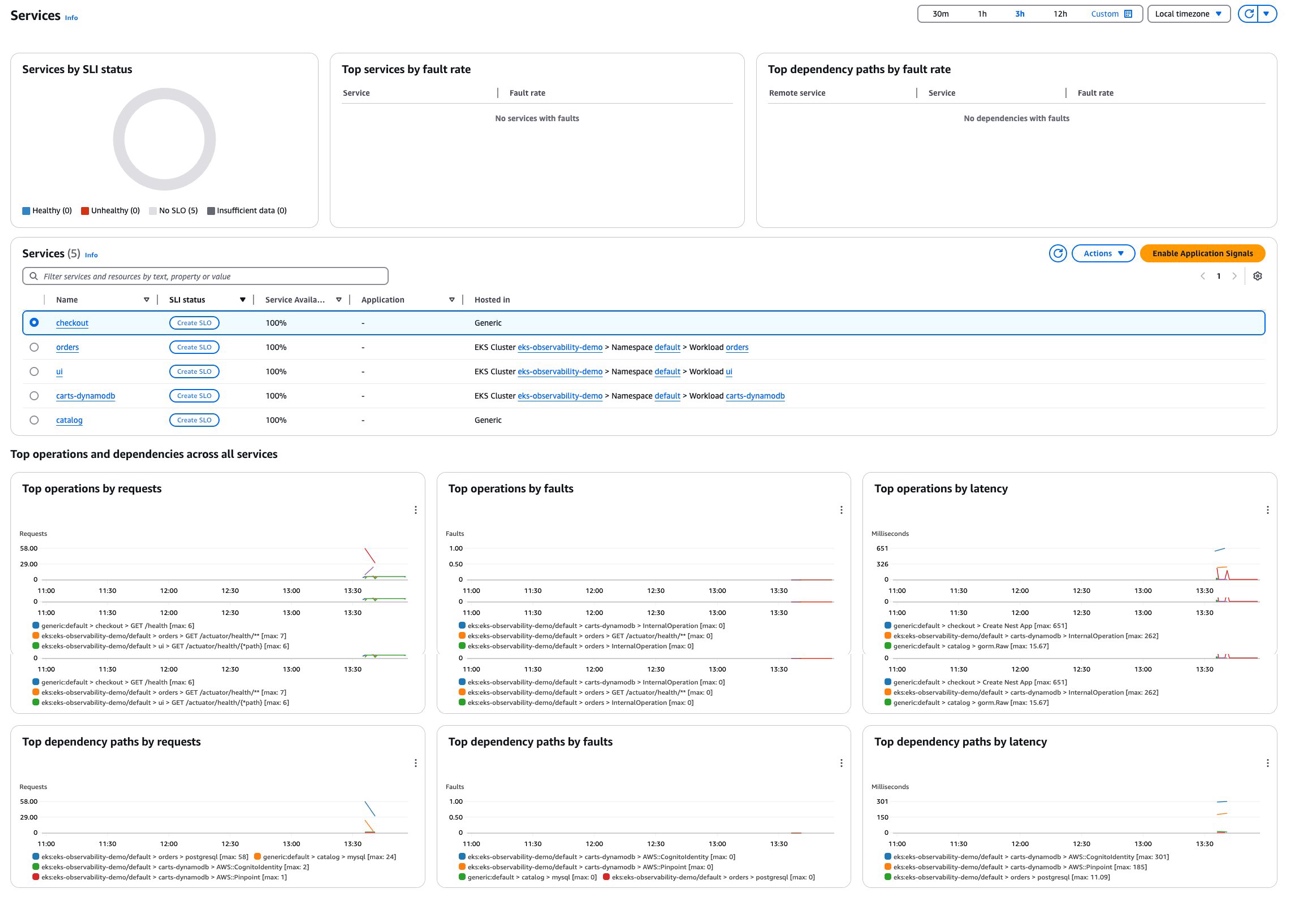
Figure 5: Application Signals monitoring in CloudWatch console
For detailed implementation guidance, go to Setting up Application Signals for Amazon EKS and learn about automatic instrumentation capabilities in the CloudWatch Application Signals announcement.
Create anomaly detection alerts for cluster
You can use Amazon EKS enhanced monitoring to create more monitoring metric and use CloudWatch anomaly detection to automatically identify unusual patterns in your EKS cluster metrics. The following example uses metric node_cpu_utilization for creating anomaly detection alarm to detect unusual CPU spikes in the EKS cluster.
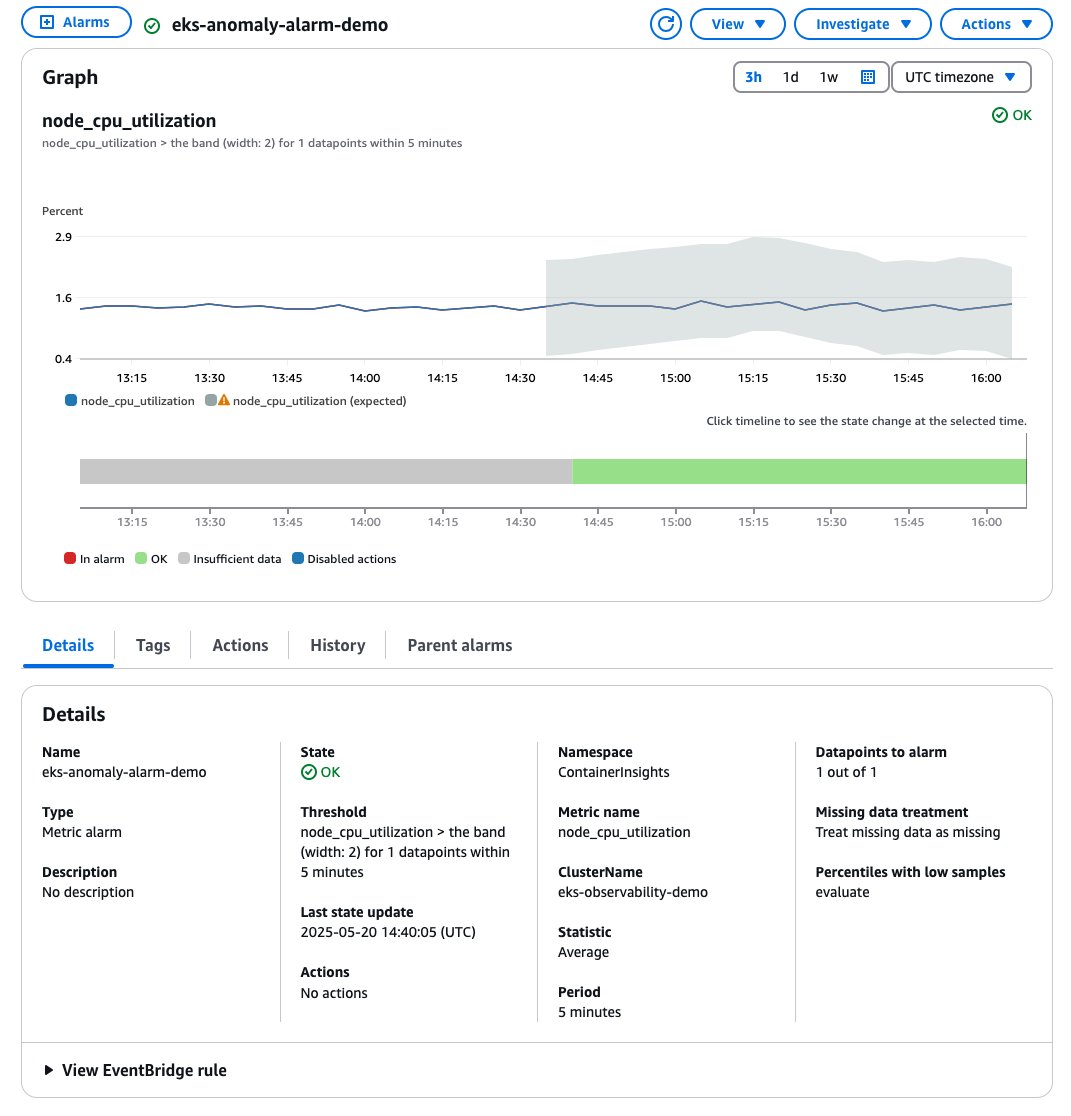
Figure 6: CloudWatch anomaly detection configuration for Amazon EKS node CPU monitoring
The anomaly detection model uses machine learning (ML) to analyze historical metric patterns and automatically determines the normal operating range for your EKS cluster. When the metric deviates from this expected range, it can indicate potential issues requiring attention.
Real-world monitoring scenarios
A common challenge in Amazon EKS operations is identifying the root cause of failures. The following section shows how enhanced metrics can help diagnose and resolve operational issues effectively.
Detecting scheduling issues
Scheduling issues in EKS clusters can affect application availability. With observability enabled, use CloudWatch to monitor scheduler performance and identify bottlenecks. The key metrics include the following:
scheduler_pending_pods: Number of pods waiting to be scheduled (queues: active, backoff, gated, unschedulable). High unschedulable pods suggest resource/node capacity issues.scheduler_schedule_attempts_UNSCHEDULABLE: Failed scheduling attempts due to constraints (for example insufficient CPU/memory). This indicates resource constraint.scheduler_schedule_attempts_ERROR: Tracks failed scheduling attempts due to internal scheduler problems, which indicates potential control plane issues.pod_status_pending: Monitors the overall count of pending pods, helping identify broader scheduling issues across the cluster.
For example, a high scheduler_schedule_attempts_UNSCHEDULABLEcould indicate inadequately resourced worker nodes, requiring node group scaling, resource optimization, or reviewing affinity rules, as shown in the following figure.
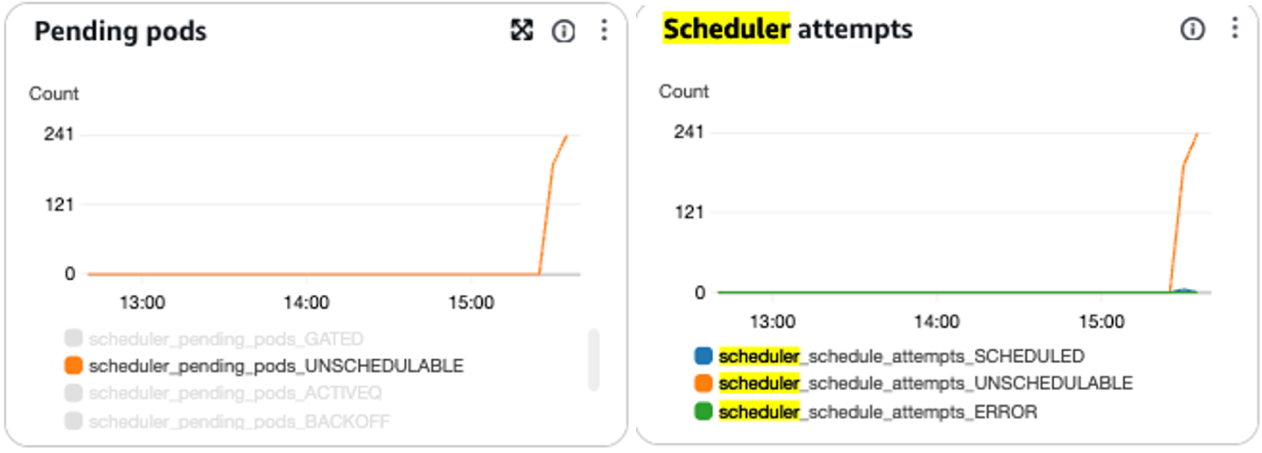
Figure 7: Charts displaying scheduler metrics for scheduling attempts and pending pods in CloudWatch
Tracking API server performance
Amazon EKS API server performance monitoring is crucial for maintaining cluster health and preventing service disruptions. With Amazon EKS version 1.28 and above, you can use CloudWatch metrics to monitor API server performance and request patterns. The key metrics to watch include the following:
apiserver_request_total_5XX: Tracks HTTP requests resulting in server errors (5XX status codes), indicating API server internal issuesapiserver_request_total_429: Monitors requests rejected due to rate limiting, showing when clients exceed throttling thresholdsapiserver_flowcontrol_request_concurrency_limit(enhanced observability metric): Shows the number of threads used by currently running requests in the APF system
Experimental metrics:
apiserver_flowcontrol_rejected_requests_total(enhanced observability metric): Indicates requests rejected by the APF subsystemapiserver_current_inqueue_requests(enhanced observability metric): Displays the number of requests currently queued by the API server
One typical performance degradation is the throttling issue. The API server implements API Priority and Fairness (APF) to protect itself from overload, with default limits of 600 inflight requests per API server (400 non-mutating and 200 mutating requests). Check out the Amazon EKS Best Practice Guide for more details. When it reaches the limit, the API server responds with the HTTP 429 status code.
The following is an example that uses enhanced monitoring metrics to overview throttled APIs for an overloaded cluster. The graph shows a significant spike at 19:26 UTC with WATCH operations reaching 46 requests and LIST operations at 38 requests. This pattern indicates high API server load, which could trigger throttling events if the combined load approaches limit.

Figure 8: API server throttling metrics showing WATCH, LIST, and POST operations in the CloudWatch console
You can analyze which API operation caused throttling by running CloudWatch Log Insights query on the observability dashboard, and identifying throttled clients, as shown in the following figure. You can do this to take proactive actions when performance degradation or throttling issues are detected.

Figure 9: Throttled clients showing in the Amazon EKS console, CloudWatch Log Insights section
Monitoring admission webhook health
Kubernetes admission webhooks are critical components in EKS clusters, powering essential features such as the AWS Load Balancer Controller and Pod Identity Webhook. These webhooks enable the IAM Roles for Service Accounts (IRSA) functionality and provide runtime mutation and validation capabilities, such as automatically injecting sidecar containers, managing external AWS resources, and validating Kubernetes object configurations. For detailed guidance, go to Managing webhook failures on Amazon EKS.
Although webhooks provide more functionalities for Kubernetes clusters, unexpected webhook failures can silently prevent critical components from deploying. With Amazon EKS version 1.28 and above, you can use CloudWatch metrics to monitor webhook performance and health. The key metrics available include:
apiserver_admission_webhook_admission_duration_seconds: Measures the latency of webhook admission operations, helping identify performance bottlenecksapiserver_admission_webhook_rejection_count: Tracks the number of rejected admission webhook requests, indicating potential configuration or compatibility issues
These metrics enable CloudWatch alarms to detect webhook performance degradation, rejection spikes, or anomalies. Use pre-built Amazon EKS console dashboards or build custom CloudWatch dashboards to track webhook health trends.
The following graph shows enhanced rejection metrics (for example ADMIT and VALIDATING admission webhook rejections), which pinpoint configuration issues or failures affecting cluster operations.
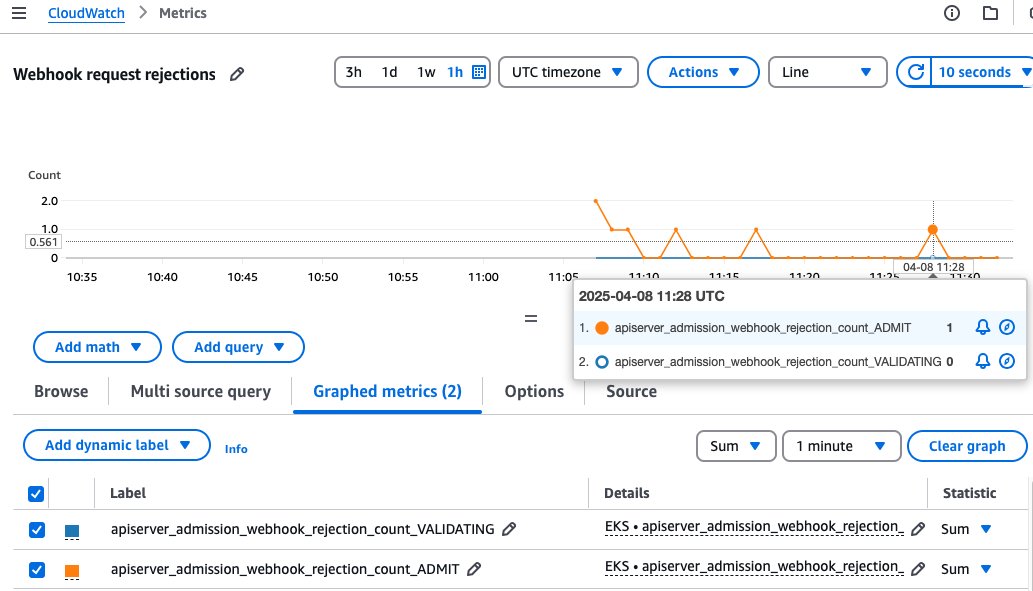
Figure 10: Webhook rejection metrics for ADMIT and VALIDATING operations in CloudWatch
You can use the CloudWatch Log Insights query link to investigate broken webhooks. The logs reveal a webhook failure for a nginx deployment, with an error indicating the AWS Load Balancer webhook service was unavailable, corresponding to the spike in ADMIT webhook rejections seen in the metrics graph. This correlation between metrics and logs helps quickly pinpoint the root cause: a non-functioning webhook service that needs to be restored, as shown in the following figure.
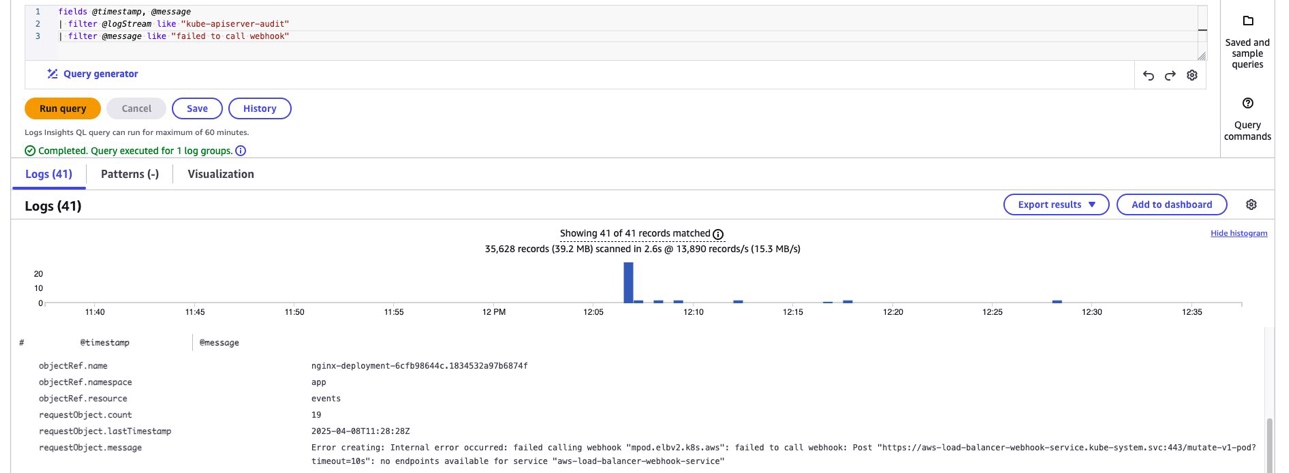
Figure 11: CloudWatch Log Insights query showing webhook failure logs for AWS Load Balancer Controller
etcd storage monitoring
etcd is the key-value store that serves as the backing database for all Kubernetes cluster data. Amazon EKS provisions etcd with a maximum recommended database size of 8 GB. Monitoring etcd storage is crucial, because exceeding this limit can cause the cluster to become read-only, preventing any modifications to cluster resources. The following are key metrics to monitor etcd database, also shown in the following figure:
apiserver_storage_size_bytes: Tracks the total size of the etcd databaseapiserver_storage_objects(enhanced observability metric): Shows the count of objects by type stored in etcd
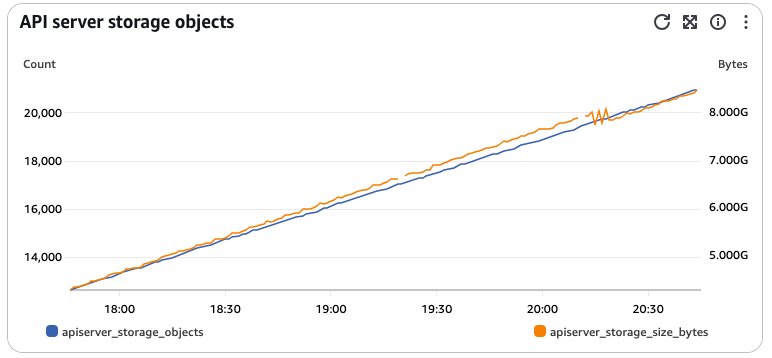
Figure 12: Graph showing etcd database storage metrics with object count and size growth
You can implement proactive monitoring by setting up CloudWatch alarms that trigger when the etcd database size reaches 80% of its 8 GB limit (approximately 6.4 GB). The graph shows a real example where the etcd storage size (apiserver_storage_size_bytes) grew rapidly, crossing the configured 6.4 GB threshold, changing the alarm status to the “In alarm” state. If approaching the size limit, then you can take immediate action by deleting unnecessary resources, optimizing resource specifications, and reviewing applications causing frequent object updates to maintain healthy cluster operations.

Figure 13: CloudWatch alarm graph showing an etcd storage alarm triggered when exceeding the threshold
Cleaning up
To avoid incurring future charges, remove any custom CloudWatch alarms and delete the EKS cluster with the following command:
Conclusion
This post demonstrates how to use Amazon EKS free metrics and the Amazon CloudWatch Observability Operator for enhanced visibility, proactive monitoring, and efficient troubleshooting of EKS clusters. To get started with EKS monitoring:
- Monitor your cluster with the observability dashboard
- Install CloudWatch Observability add-on
- Configure CloudWatch Application Signals
- Amazon CloudWatch generative AI observability
- Amazon EKS documentation
About the authors
 Asif Haque is a Technical Account Manager, dedicated to serving automotive customers in the US. Within AWS Enterprise Support’s Automotive Strategic Industry organization, he assists large automotive companies on their cloud journey and helps them implement highly-scalable and resilient cloud architectures. Before joining AWS, Asif excelled as a DevOps architect and Operational Lead. In his spare time, Asif enjoys spending time with his family and traveling.