Containers
Managing etcd database size on Amazon EKS clusters
Note: etcd_db_total_size_in_bytes or apiserver_storage_db_total_size_in_bytes has been renamed to apiserver_storage_size_bytes since EKS v1.28. Please use the corresponding metric to monitor database size.
Introduction
Amazon Elastic Kubernetes Service (Amazon EKS) makes it easy to deploy, manage, and scale containerized applications using Kubernetes. Kubernetes clusters use etcd, a consistent and highly available key value store, as the backing store for all cluster data. All Kubernetes objects like pods, services, ingress, and more are stored within etcd in a key-value format. As your cluster grows, so does the number of resources stored in etcd. In extreme cases, you could exceed the etcd database size limit. In this post, we’ll share why monitoring the etcd database size is important, and what you can do when you approach or exceed the database size limit. The guidance provided in this post applies to all currently supported versions of Amazon EKS, which are versions 1.22 through 1.25 as of writing this post.
Why should I care about monitoring the etcd database size?
etcd is an open-source, distributed, consistent key-value data store. It is a graduated Cloud Native Computing Foundation (CNCF) project. All the objects that are part of a Kubernetes cluster are persistently stored and tracked in etcd. etcd is meant to be used as a consistent key-value store for configuration management, service discovery, and coordinating distributed work. etcd documentation provides details on use cases and comparison with other systems. When you create a cluster, Amazon EKS provisions the maximum recommended database size for etcd in Kubernetes, which is 8GB. While 8 GB of etcd database is sufficient for most customer use cases, there are both valid and accidental scenarios, where the maximum allowed database size can be exceeded. To understand this better, let’s take a look at how etcd operates behind the scenes. etcd uses a multi-version concurrency control (MVCC) mechanism to make concurrent updates to the keys of the objects stored in it. Every update to an object creates a separate revision of the key. Every revision is a full copy of the object. The revision numbers provide a way to establish the order in which the changes occur. Due to MVCC mechanism, multiple older versions of the key can exist in etcd at any point in time. As a result, it is important to note that the space consumed by etcd grows not only due to addition of new objects, but also due to updates to existing objects. For example, kube-scheduler, which is a Kubernetes cluster control plane component, can fail to schedule a pod when sufficient memory is not available on a worker node. Every time the scheduler reevaluates the pod for scheduling, it patches the pod object with the latest status of the resource constraints. This patching can lead to multiple revisions of the pod in etcd.
When the database size limit is exceeded, etcd emits a no space alarm and stops taking further write requests. In other words, the cluster becomes read-only, and all requests to mutate objects such as creating new pods, scaling deployments, etc., will be rejected by the cluster’s API server. Further, users won’t be able to delete objects or object revisions to reclaim etcd storage space. This is because deletion relies on the compaction operation to clean up objects, and compaction is not allowed when the no space alarm is active (see related etcd issue on this behavior). While compaction frees up space within the etcd database, it doesn’t free up file system space taken up by etcd database. To return the space back to the operating system, and to drop the size of etcd database, the defrag operation needs to run.
This demonstrates the importance of monitoring clusters’ etcd database size, so that mitigation steps can be taken to avoid exceeding the size limit, and hence prevent the cluster from getting into a read-only mode. Amazon EKS actively monitors a cluster’s etcd database, and tries to notify customers when the database size is nearing the limit. But this reach-out is done on a best-effort basis, and we recommend that customers proactively monitor the etcd database size following the instructions below.
Walkthrough
How to monitor etcd database size?
The Kubernetes API server exposes many metrics that are useful for monitoring and analysis. These metrics are exposed through a metrics endpoint that refers to the metrics HTTP API. Amazon EKS exposes this endpoint on the Amazon EKS Control plane. You can monitor the metric etcd_db_total_size_in_bytes to track the etcd database size. To view the raw metric, you can run the kubectl command with the –raw flag:
While this endpoint is useful if you are looking for point-in-time data, you typically want to monitor and analyze this metric over time. To do this, you can deploy a monitoring solution like Prometheus to your cluster. To learn more about this, see Control plane metrics with Prometheus in Amazon EKS documentation and monitoring etcd metrics in Amazon EKS best practices guide. Once you have Prometheus setup, you can use pre-created alert rules such as etcdBackendQuotaLowSpace and etcdExcessiveDatabaseGrowth to setup alerting on etcd storage usage and trends. This helps you proactively monitor etcd database usage and avoid overrunning the limit.
How to detect when etcd is out of space?
Amazon EKS Control plane logging feature provides audit and diagnostic logs directly from the cluster’s control plane to Amazon CloudWatch Logs in your account. One of the log types that can be enabled is Kubernetes Audit logs. Audit logs provide a record of the individual users, administrators, or system components that have affected your cluster. For more information on enabling audit logs, see Amazon EKS Control plane logging in documentation. When the cluster exceeds the limit of etcd’s database size, the audit logs show an error response string database space exceeded. You can use the following Amazon CloudWatch Logs insight query to look for the timestamp of when this error message was first seen.
See the following screenshot for an example of the error message in the audit log. You can see that the cluster reached the database size limit at around 8:50AM on Nov 17th.

What to do on approaching etcd database size limit?
Here, we’ll look at ways you can identify when your cluster is fast approaching the database size limit (but has not exceeded the limit yet). When this happens, you need to do two things. First, identify what is leading to the rapid consumption of the etcd database space. Often, this is attributed to unintentional usage patterns or a misconfiguration. Second, after you identify what is driving the space consumption, then you can clean up the objects to reclaim free space.
How do I identify what is consuming etcd database space?
Object count
Often, it’s the count of total objects stored in etcd that leads to an increase in storage consumption. The Kubernetes API server exposes a metric that shows the count of objects by type. If you are on a Kubernetes version less than 1.22, then use the etcd_object_count metric. If you are on version 1.22 or later, use the apiserver_storage_object_counts metric.
kubectl command for versions 1.22 and later:
kubectl command for versions 1.21 and earlier below:
Below, you can see sample output of the command. In this example, one of the object types has more than 2 million objects.
Object size
Sometimes, it’s not the number of objects in etcd that leads to an increase in space consumption, but is the larger size of a few objects. You can apply certain optimizations to reduce the per-object size. For example, instead of embedding a large Binary large object (BLOB) directly in a pod specification, you can use references. This can be achieved by using a ConfigMap or Secret object to store the BLOB, and then referencing the ConfigMap or Secret from the pod. This helps bring down the pod spec size significantly. For examples of how to reference secrets in a pod, see Distribute Credentials Securely Using Secrets Kubernetes in Kubernetes documentation.
You can fetch the object size by running the following kubectl command to output the object in YAML format. You can then inspect the size of the output file to figure out the object size. This command can be run per namespace to find out which namespace is taking up the most space.
Once you have identified the pod spec that needs to be optimized, save a copy of original specification, and then test the size of the updated spec using the command described above.
Request volume
You can analyze the request volume to the Kubernetes API server over a specific period of time to identify anomalous trends in request patterns. These anomalies can potentially correlate to a surge in etcd space consumption. You can monitor the API server metric apiserver_request_total to see the total request volume. If there’s an unusually sharp spike in requests, then you can use the following Amazon CloudWatch Logs Insights query against Kubernetes audit logs to filter requests by type and user agent. This will help you understand more about the request and its caller.
Requests by User Agent:
Requests by Universal Resource Identifier (URI)/Verb:
For example, the below query output shows that a service mesh agent made a lot of requests in a short period of time. The large number of create and update requests can lead to a significant increase in the etcd database size. Now that you have identified the request caller, you can investigate whether these requests are really required, and/or if they can be reduced.

Object revision updates
Sometimes, the etcd database size grows because a few objects go through rapid updates. In this case, the total object count or the size per object is relatively small, but there are large number of revisions per object.
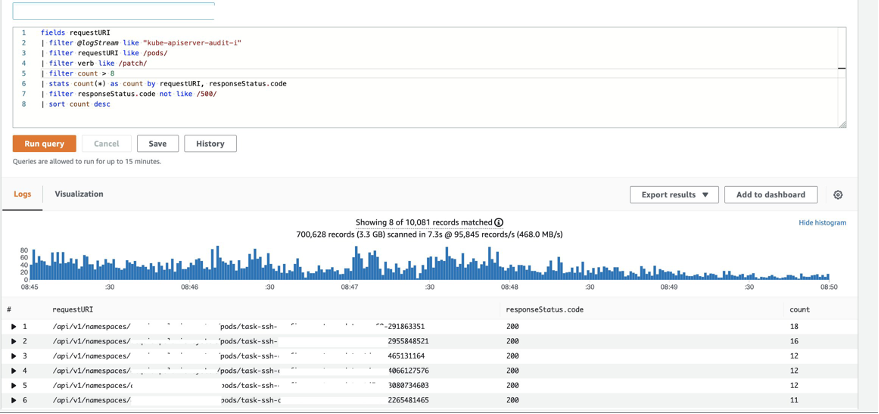
You can run the following Amazon CloudWatch Logs Insights query against the Kubernetes audit logs to show objects (pods in the case) that have been patched more than eight times.
For example, the query output shows that a pod named task-ssh is being updated multiple times.
Now that you’ve identified the object that is undergoing rapid updates, you can run the following Amazon CloudWatch Logs Insights query against the API server audit logs, and inspect the contents of the patch that is being applied.
You can review the output of the above query to gain insights into why the object is changing at a fast pace. Typically it’s some anomalous behavior on the workload that leads to frequent object updates. For example, this behavior could be due to a crash loop triggered by insufficient memory on the worker node, or could be due to retry attempts on failure to start a deployment. Once you have identified the root case for this behavior, you can put mitigations in place to reduce the number of revisions per object.
How to reclaim etcd database space?
You can clean up unused or orphaned objects using kubectl delete command.
For example the shell script below shows how to delete the admissionreports.kyverno.io objects.
Notes:
- counter
- Depending on number of objects to be deleted, customer can change the for loop iterations count as required.
- limit
kubectl delete --now=true --wait=false --raw $requestURIpotentially times out without specifying appropriate limit due to the know issue, i.e. Github link. Please adjust limit parameter if hit the timeout error.
- To form requestURI
- In general resouce-uri is formed like this :
/apis/<group>/<version>/namespaces/<namespace>/<kind> - reference: https://kubernetes.io/docs/reference/using-api/api-concepts/#resource-uris
- In general resouce-uri is formed like this :
What to do if I have already exceeded the maximum etcd database size?
As mentioned in the earlier section “Why should I care about monitoring the etcd database size?”, when the cluster exceeds the maximum allowed etcd database size, it becomes read-only. This means that all the mutating (create/update) requests to the Kubernetes API server of your cluster will be rejected.
Conclusion
In this post, we showed you the importance of monitoring the etcd database size, and the steps you can follow to identify the drivers for increased space consumption, as well as mitigation steps to reclaim storage space.
Update in October 2023 – EKS auto recovery workflow
EKS now has an automatic recovery workflow for etcd no space alarms. If the cluster runs into no-space, this workflow will run compaction and defragmentation to free up space. It will also disarm the cluster. It is typically effective when there are multiple revisions per object, e.g. repeated pod status updates due to crash loop.
If your cluster is in a no space alarm, wait 15 minutes to see if the auto-recovery workflow resolves the alarm. If the workflow cannot free up space, e.g. because too many objects are created without clean-up, you will need to delete unwanted objects.
Can I delete objects during no-space alarm?
Objects that need to be updated before deletion cannot be deleted when etcd is in a no space alarm. Examples of such objects include running pods and objects with finalizers. Objects that do not need to be updated before deletion can be deleted even when etcd is in a no space alarm. Examples of such objects include configmaps and Kyverno admissionreports.
How many objects should I delete?
To review the objects that are taking up the space, please consult the object count metric discussed earlier in this blog. Delete atleast 20% of the unwanted objects using kubectl command.
Will the cluster become read-write again once I delete the objects?
The auto recovery cycle after object deletion will run compaction and defragmentation. This will free up space corresponding to the deleted objects and disarm the cluster.
What if I am not able to delete objects?
If the kubectl delete command for your object is failing with “mvcc: database space exceeded”, then the object deletion is trying to issue an update to etcd. You can try pick a different object type for deletion. If you’re unable to, you will need to reach out to AWS technical support to receive assistance to reclaim space, and hence make the cluster read-write again. This again shows the importance of proactively monitoring the etcd database size to avoid exceeding the limit.