AWS Cloud Operations Blog
Announcing Amazon CloudWatch Container Insights with Enhanced Observability for Amazon EKS on EC2
Amazon CloudWatch Container Insights is a fully managed monitoring and observability service that provides DevOps engineers, developers, SREs, and IT managers with out-of-the-box visibility into their containerized applications and microservice environments. With Amazon CloudWatch Container Insights, you can monitor, isolate, and diagnose issues in your Kubernetes clusters with minimal effort. It delivers infrastructure telemetry like CPU, memory, network, and disk usage for your clusters, services, and pods in the form of metrics and logs that can be easily visualized in the CloudWatch console.
Customers also have the capability to add CloudWatch alarms to get notified of anomalies for pro-active actions. Today, we are happy to launch Amazon CloudWatch Container Insights with enhanced observability for Amazon EKS, which takes this a step further by providing additional telemetry from Kubernetes control plane components like the API server and etcd. It also includes detailed health and performance metrics up to container level including per-pod, per-container and Kube-State metrics for faster problem isolation and troubleshooting.
With Kube-State metrics, customers can have a holistic visibility into the core components and overall health of a Kubernetes cluster, allowing users to monitor real-time state and quickly detect any issues or bottlenecks. Using detailed container-level metrics, you can now visually drill down and up across various cluster layers to easily spot issues like memory leaks in individual containers helping you to reduce your mean-time to resolution.
Another key benefit is the ability to identify risks and take pro-active action, even if you don’t have alarms set up yet. You can set alarms on unmonitored components or assign more resources to mitigate risks preemptively, avoiding degradation of the end user experience. Eventually, the enhanced observability feature facilitates early risk identification and proactive mitigation without relying on customer actions, helping prevent issues that could negatively impact end user experience.
How to enable enhanced observability for Amazon EKS?
You can get Enhanced Observability for your Amazon EKS Cluster with the Amazon CloudWatch Observability EKS Add-on. The Amazon EKS add-on provides an easy way to get enhanced observability into your Amazon EKS cluster. This add-on installs the CloudWatch agent and Fluent Bit, giving you infrastructure and container log insights. The CloudWatch agent sends key infrastructure metrics from the cluster nodes to CloudWatch. This allows you to monitor CPU, network, disk and other low-level node metrics. Fluent Bit ships container logs from the cluster to CloudWatch Logs. This gives you insights into application and system logs from your containers. To use the Amazon EKS add-on, set up the necessary IAM permissions in the IAM role used by your worker nodes in the cluster:
And then install the add-on as below replacing “my-cluster-name” with the name of your cluster:
That’s it! Amazon CloudWatch Container Insights will now be enabled for your EKS cluster. To enable easy onboarding, same add-on is also available on EKS console under the add-ons tab which you can access on your Cluster Info view. You’ll start seeing enhanced metrics and logs in the CloudWatch console. The EKS add-on provides an easy way to get observability into your EKS clusters. With just a couple commands, you can enable rich monitoring and troubleshooting for your Kubernetes workloads on AWS. Once done, this should enable the enhanced observability for Amazon EKS as below:
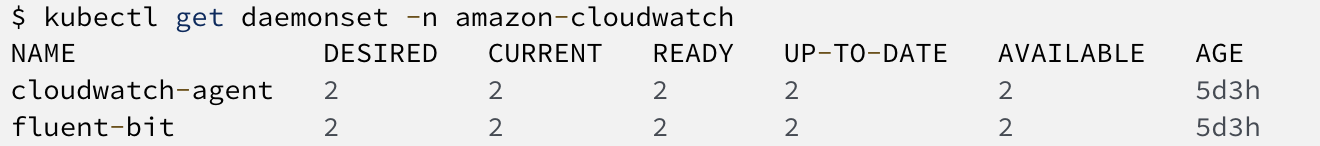
Kubectl output
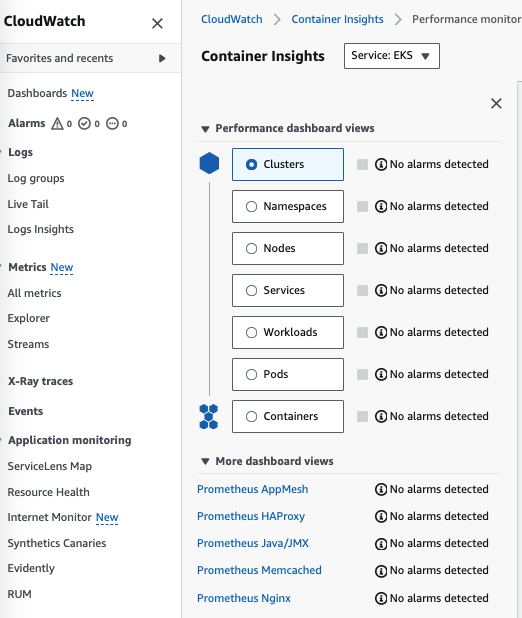
Once enabled, enhanced container insights page looks like below from AWS console, with the high level summary of your clusters, kube-state and control-plane metrics. The Container Insights dashboard shows cluster status and alarms. It uses predefined thresholds for CPU and memory to quickly identify which resources are having higher consumption, and enabling proactive actions to avoid performance impact.
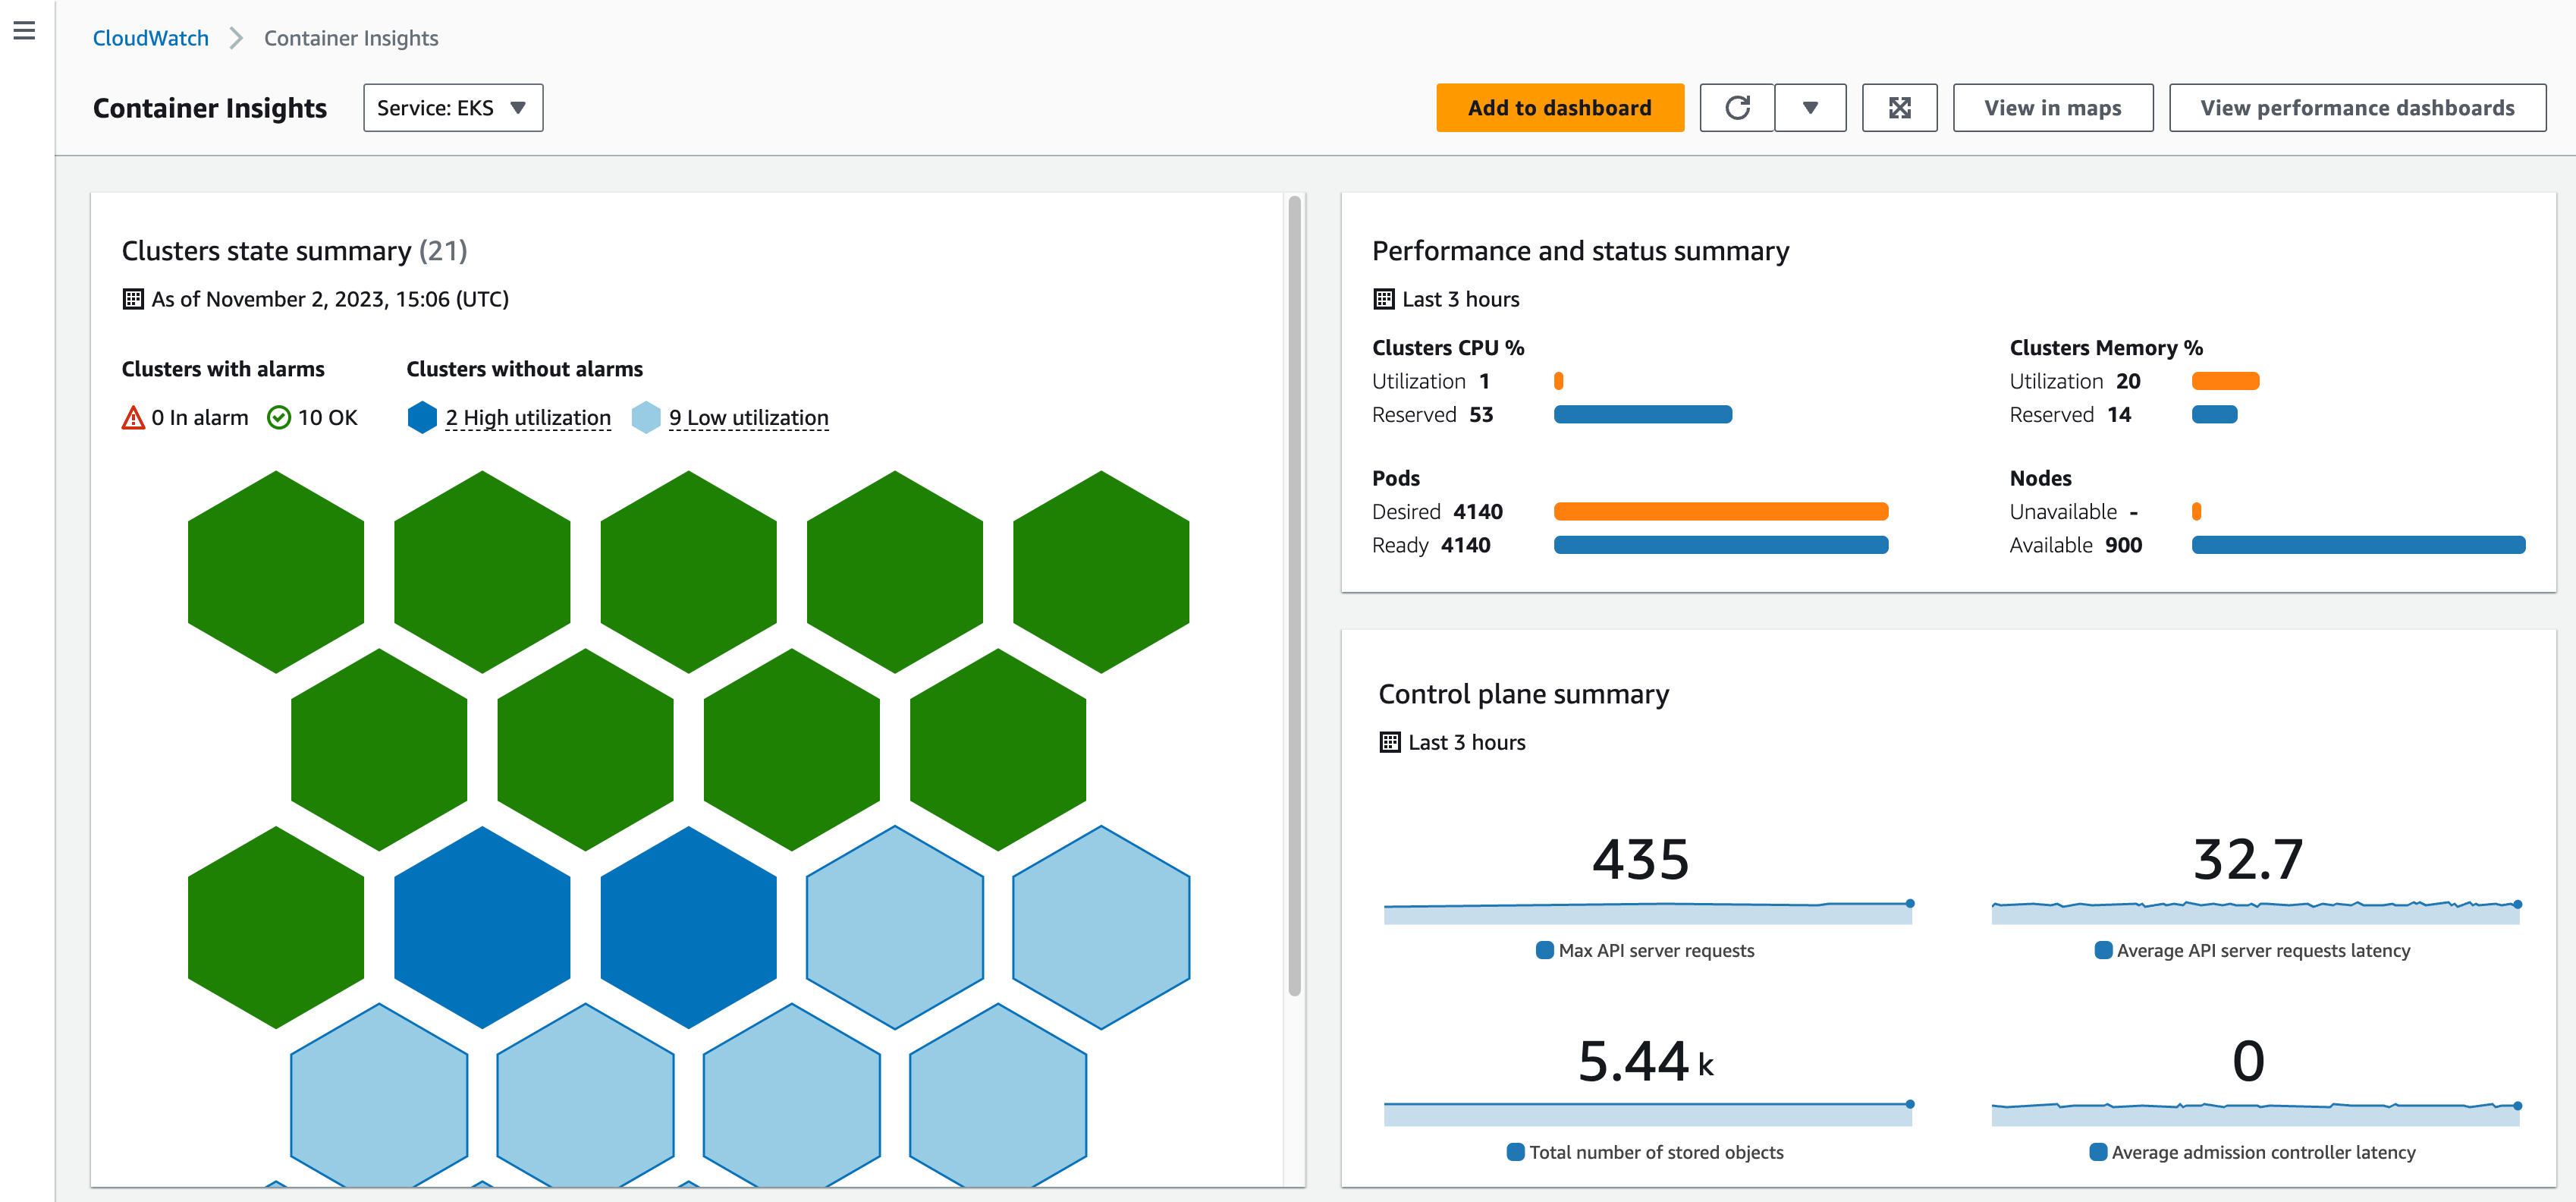
Container Insights – Dashboard
Also you have an option to view your Top 10 list by Cluster, Node, Pod, Workload and Container level as below. Based on their resource consumption, these are the critical charts you can use to identify risky components even without alarms before usage hits 100%.
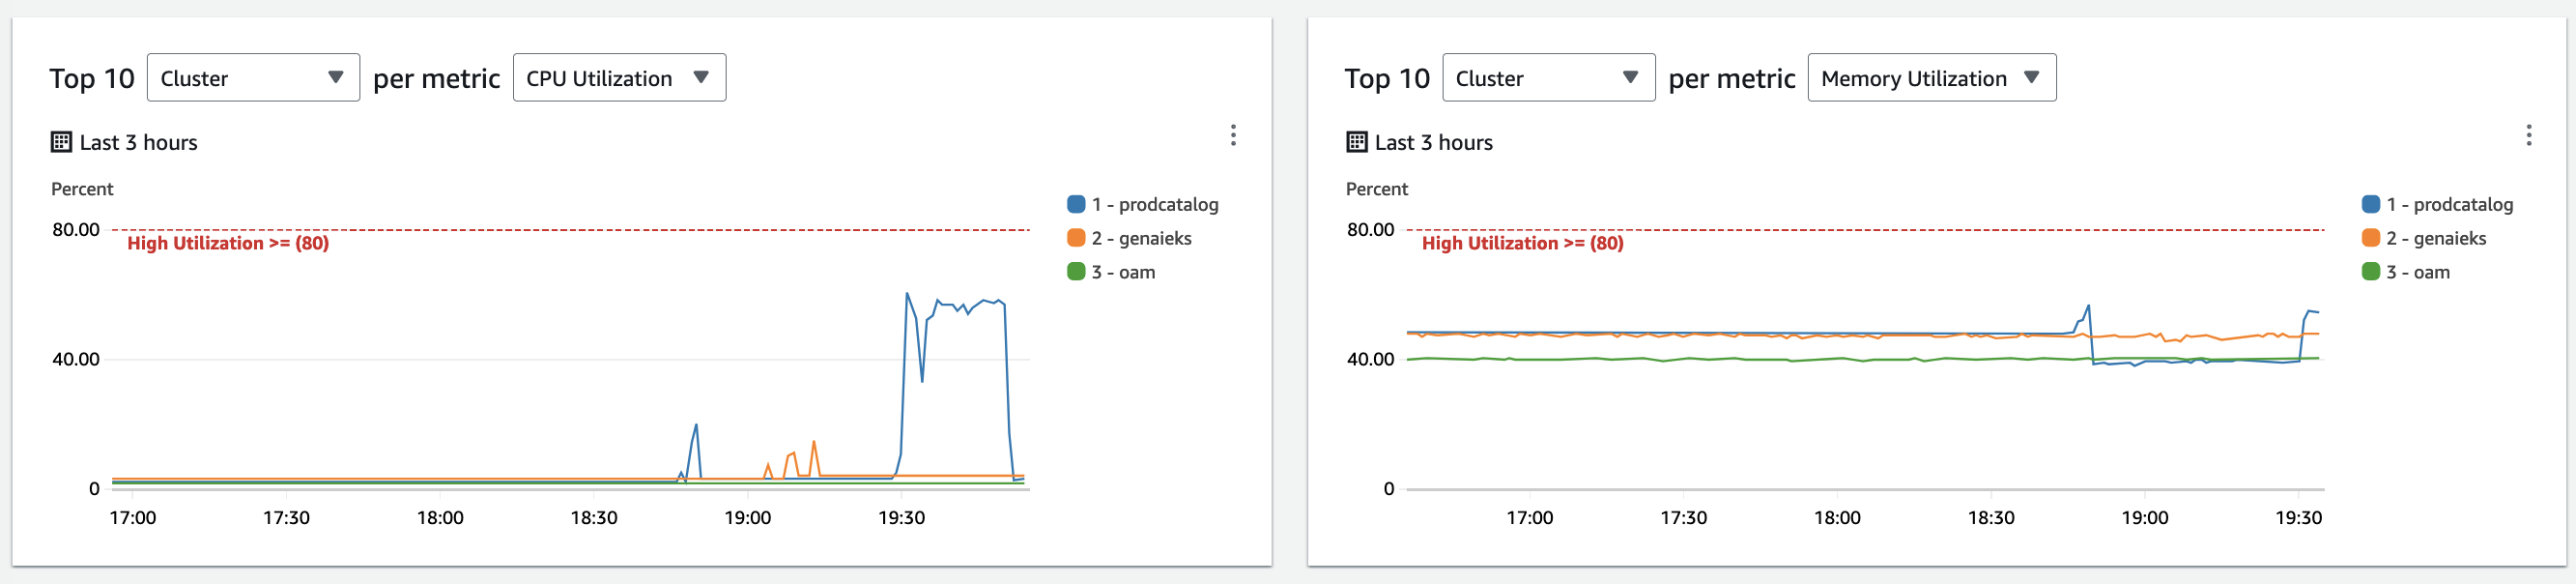
Top 10 list view
In the clusters overview section shown below, we list the clusters based on their criticality. If they are in an alarmed state, they will be displayed first. After that, the highest resource consuming clusters will be displayed next. Users can also use this list view to filter their clusters based on their needs.
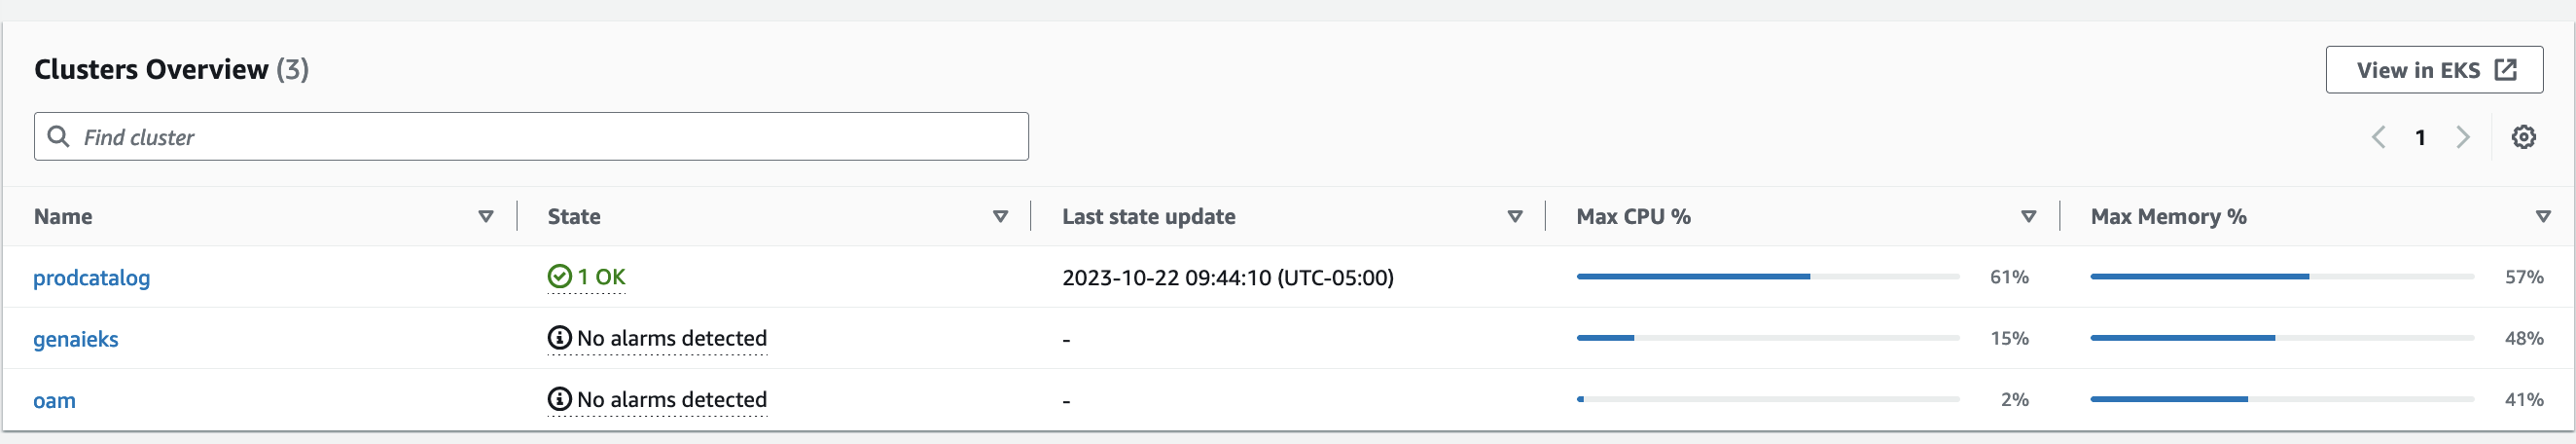
Clusters overview
It appears that the “prodcatalog” cluster’s utilization has exceeded 50% based on the above view. We can dive into more details by clicking on the cluster name, which opens the “Performance monitoring” dashboard. This monitoring dashboard provides various views to analyze performance, including:
- Cluster-wide performance dashboard view – Provides an overview of resource utilization across the entire cluster.
- Node performance view – Visualizes metrics at the individual node level.
- Pod performance view – Focuses on pod-level metrics for CPU, memory, network, etc.
- Container performance view – Drills down into utilization metrics for individual containers.
For example, we could start with the cluster-wide performance dashboard to get a high-level perspective. The different views allow methodically narrowing down to find the root cause, from cluster to node to pod to container.
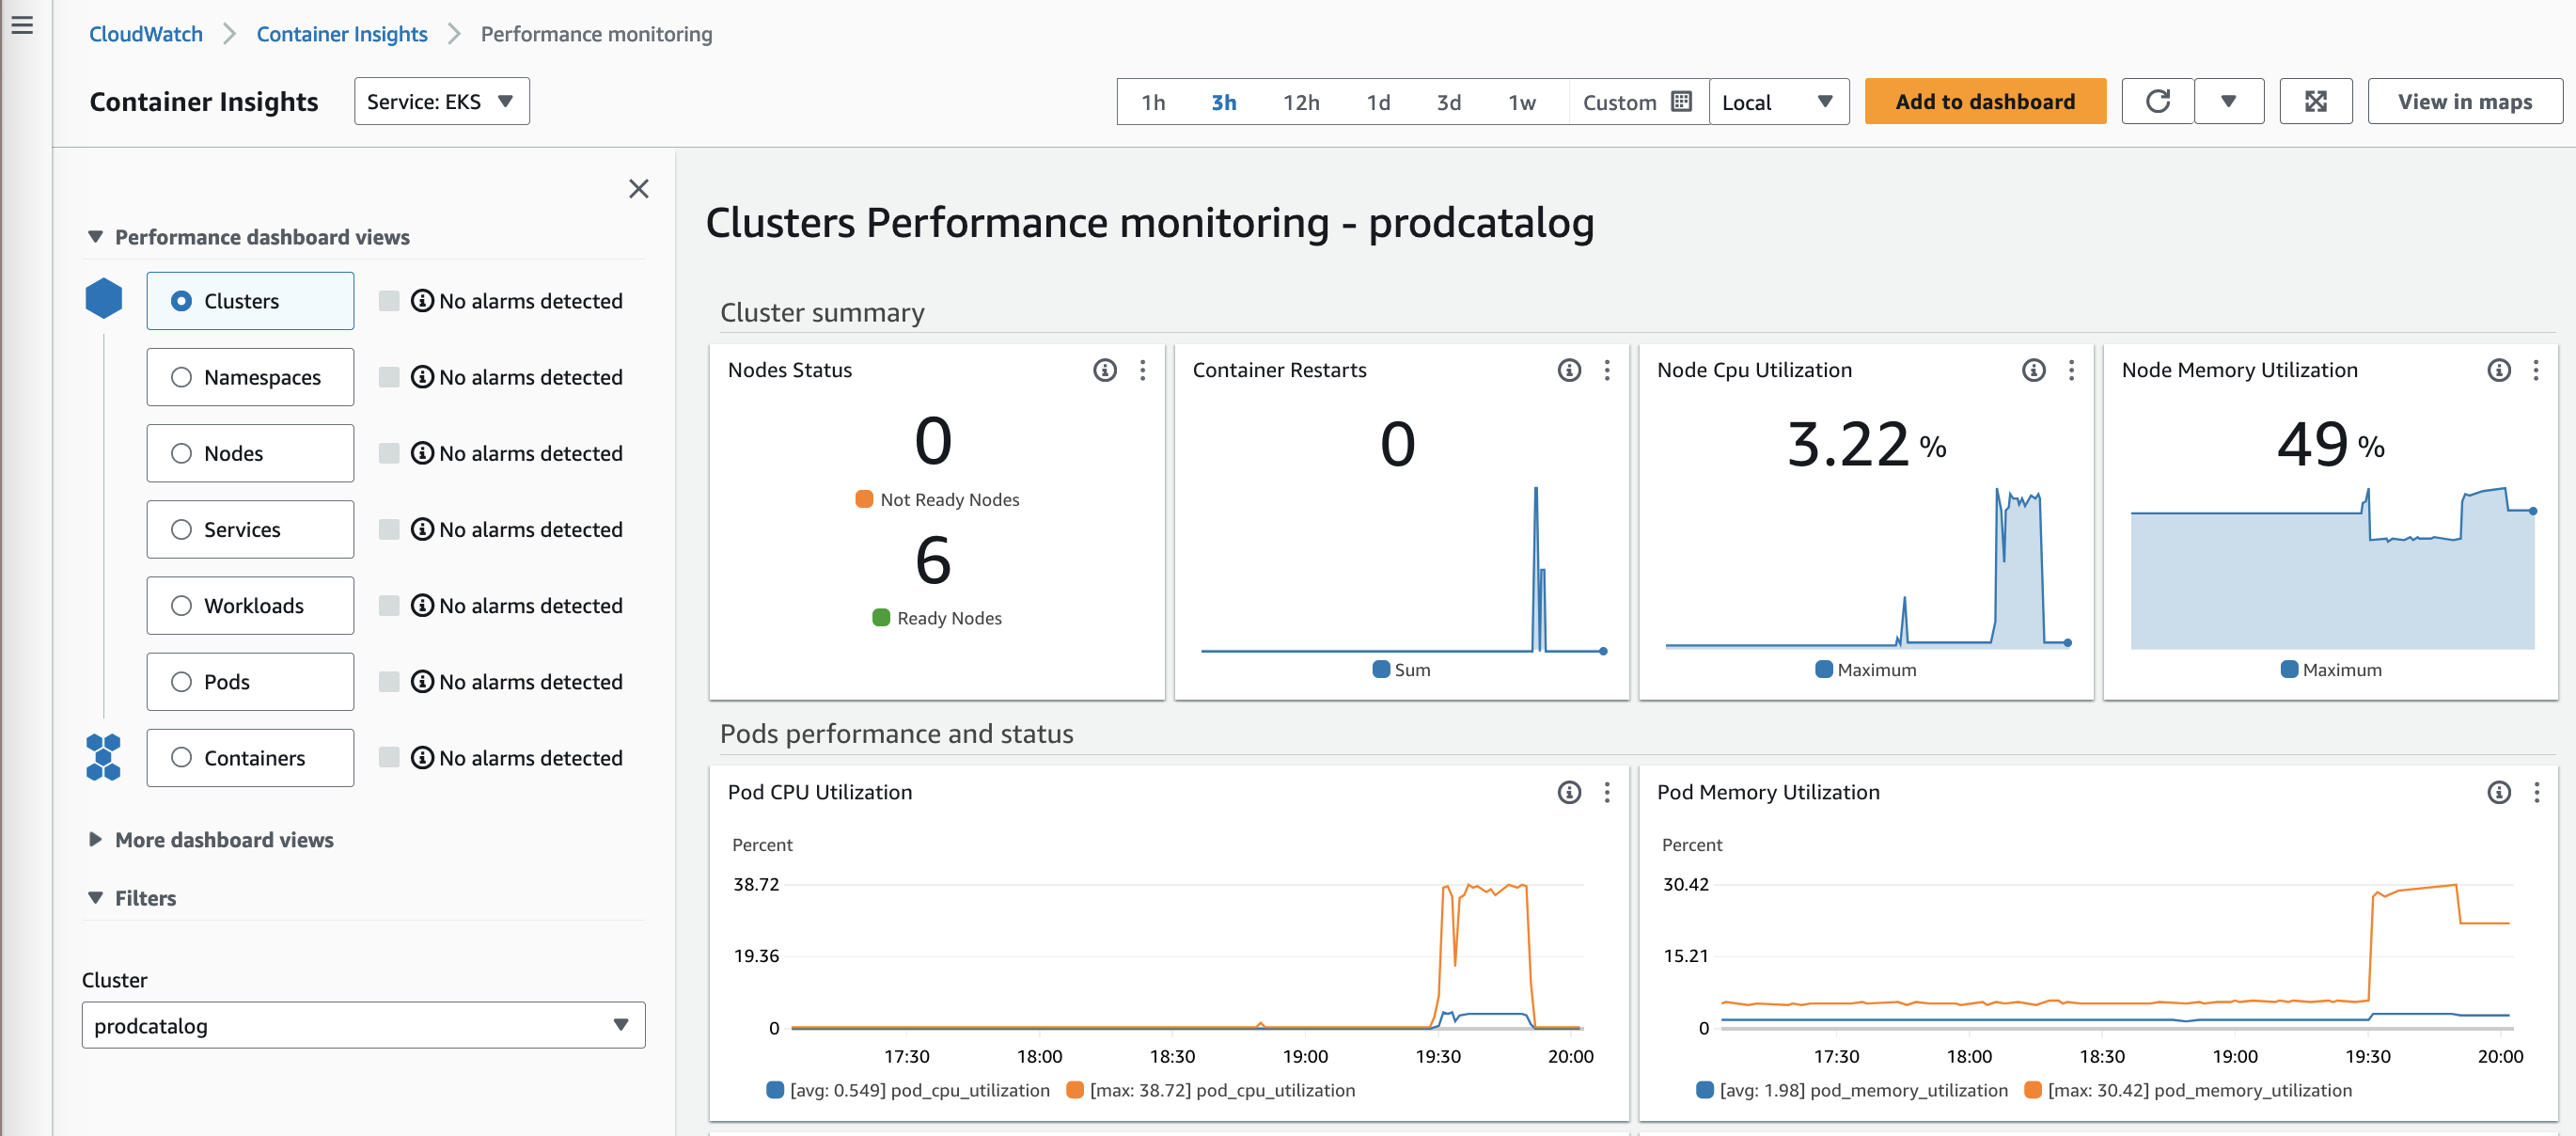
Clusters performance monitoring
As you could see below, looks like the CPU and memory utilization at the node level max spikes almost 60%.
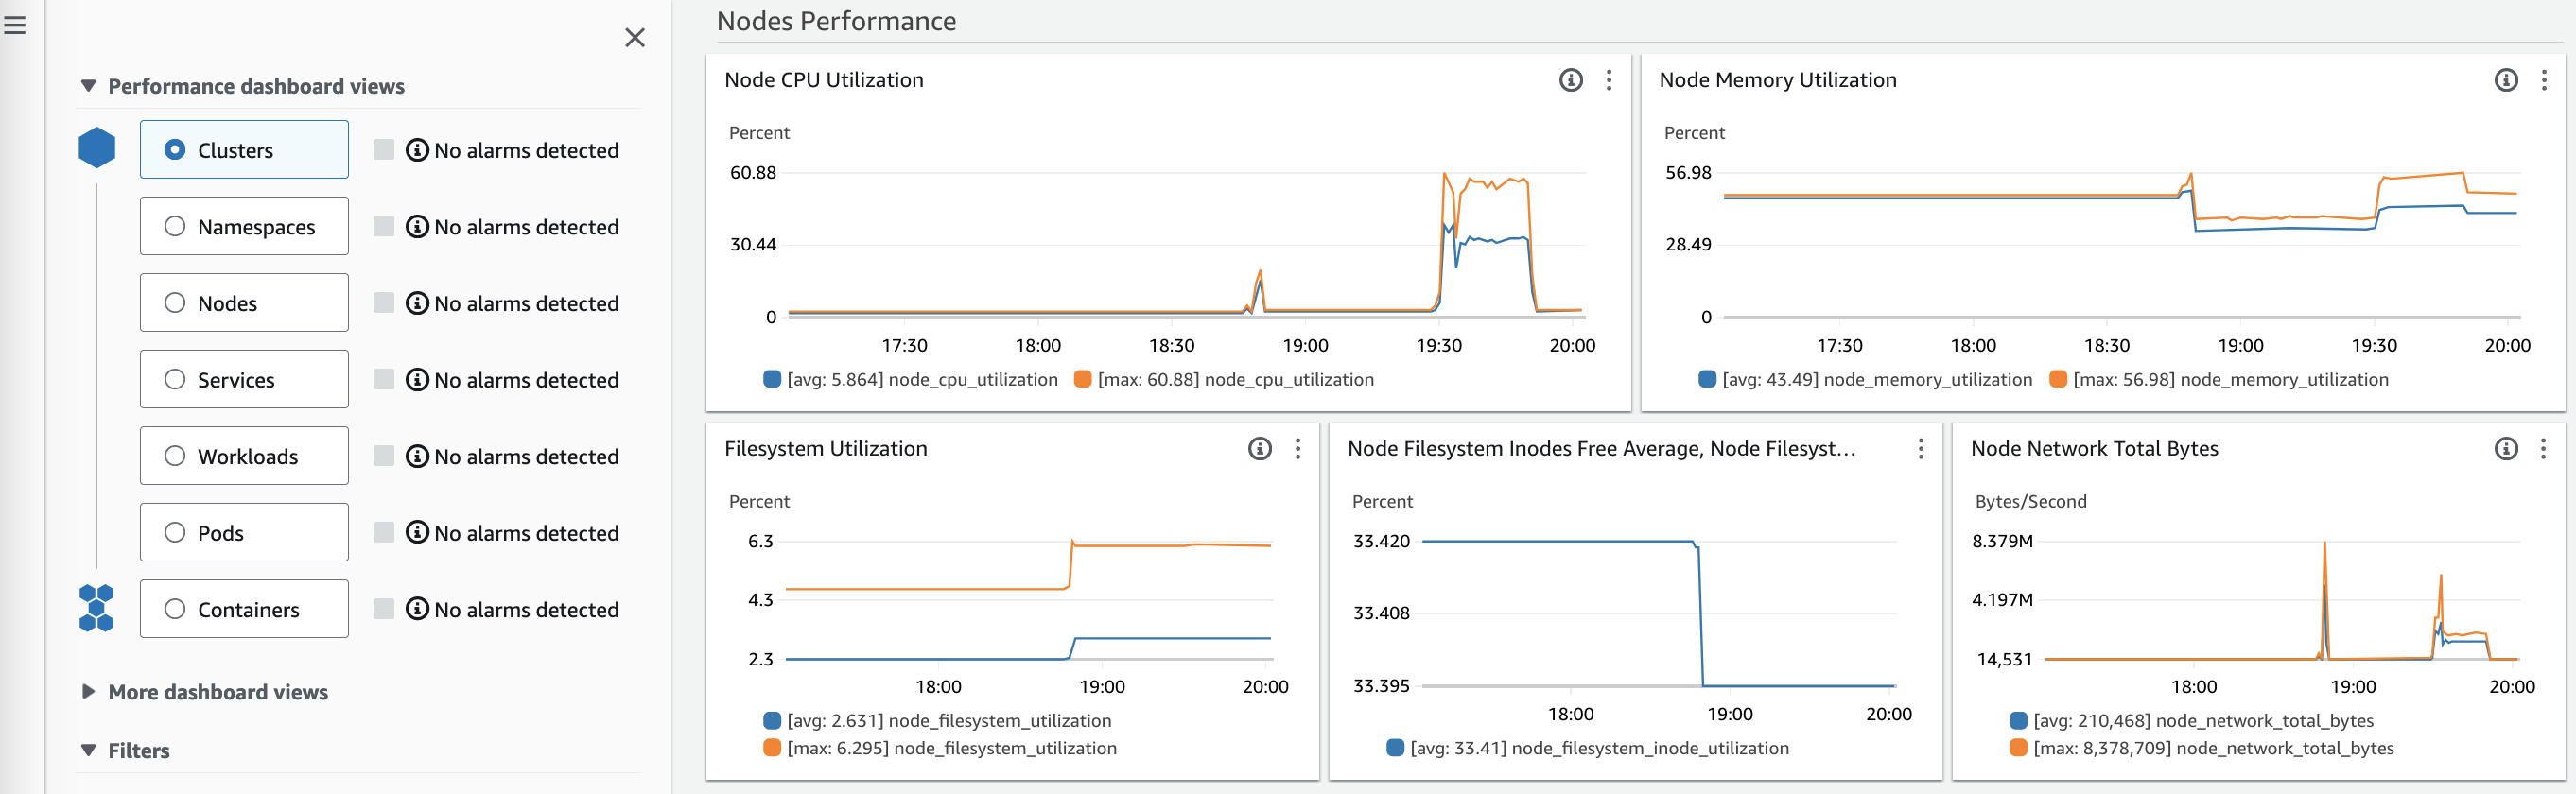
CPU and memory utilization at the node level
The Amazon CloudWatch Container Insights dashboards allow you to drill down into more detailed views to gain additional insights. For example, the containers view shows CPU and memory utilization relative to the pod limits. This view revealed that the fluent-bit container was peaking at 77% utilization. By diving into these different views, you can more easily identify the root cause of issues. The dashboards provide various views to analyze telemetry data from different dimensions.
When you drill into container-level details, the filters automatically populate with related components for that container. This enables users to quickly identify which node a failing container is on, and explore potential risks to other neighboring components on that node. Leveraging the nested views and automatic filtering makes root cause analysis highly efficient. This gives visibility into containerized workloads from high-level monitoring to pod and container metrics. This visibility helps troubleshoot and optimize container performance.
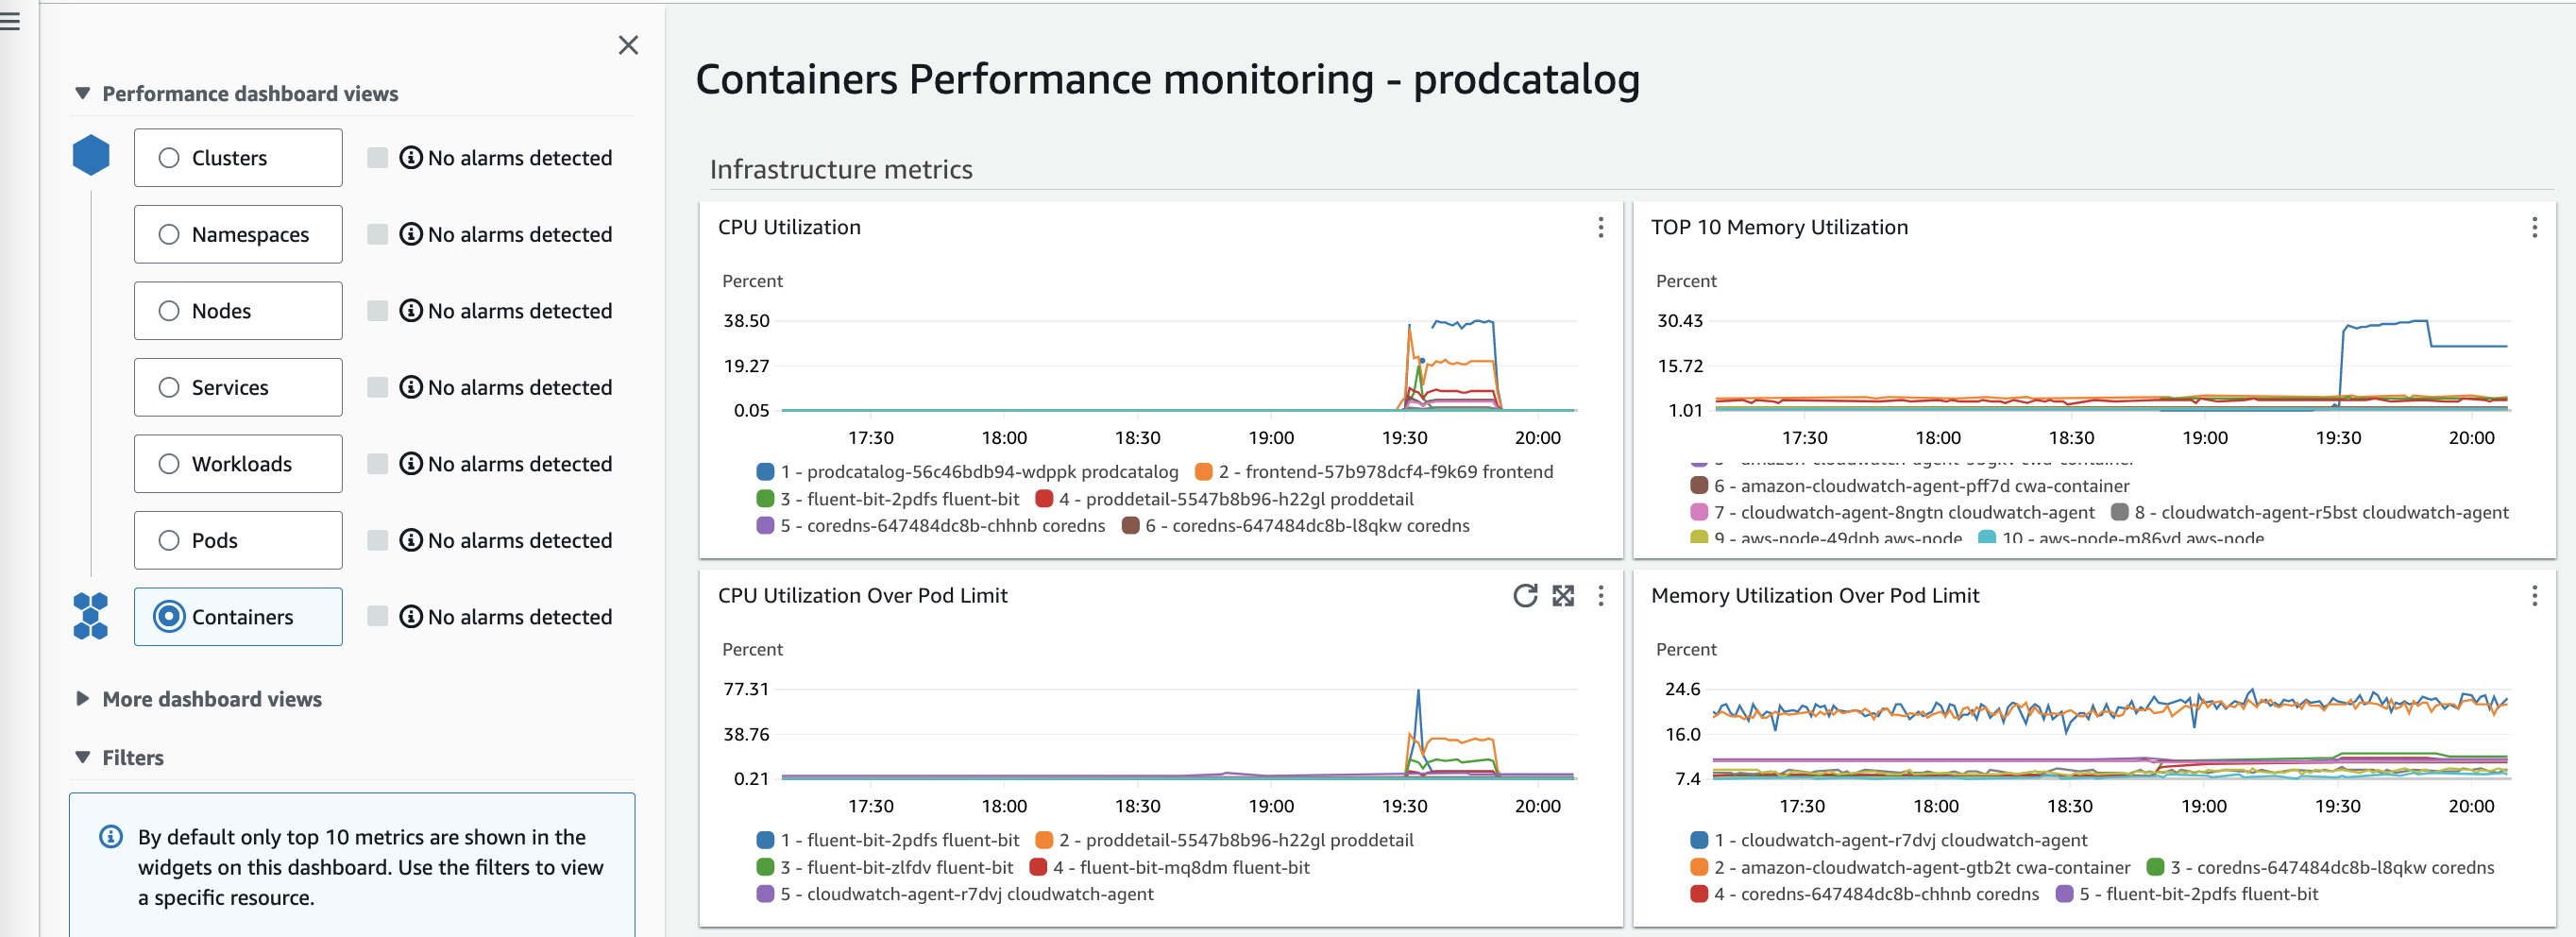
Containers performance monitoring
Node Performance dashboard view includes per node running pods, CPU and memory utilization etc. If you are interested to know more about the specific instance, you could use the filters to achieve the same.
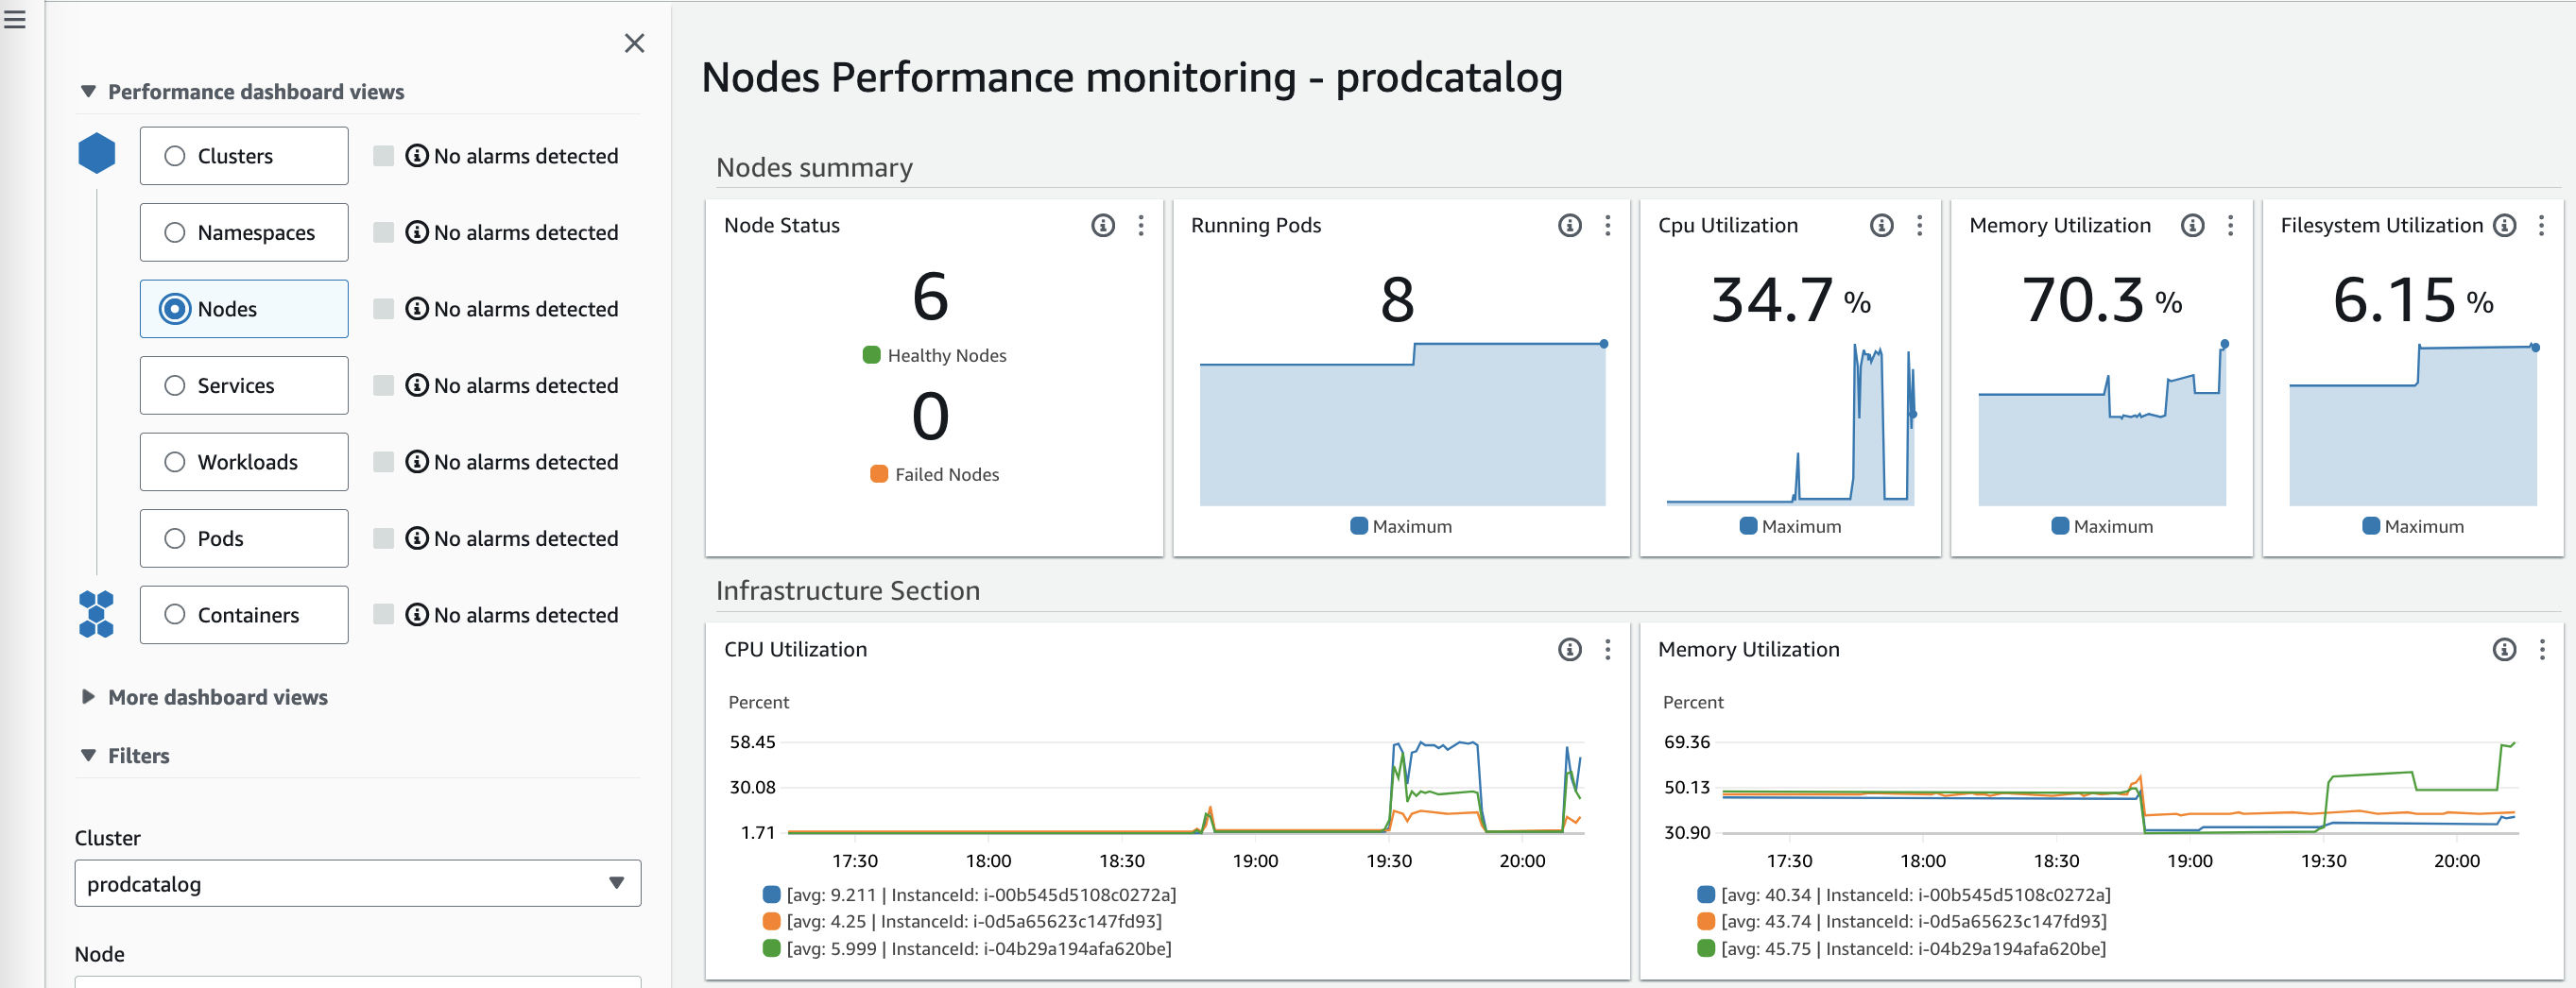
Nodes performance monitoring
The service dashboard view in Amazon CloudWatch Container Insights provides metrics for CPU, memory, and network performance of the pods of your Kubernetes service. With these insights, you can better optimize resource utilization and troubleshoot problems with your containerized services.
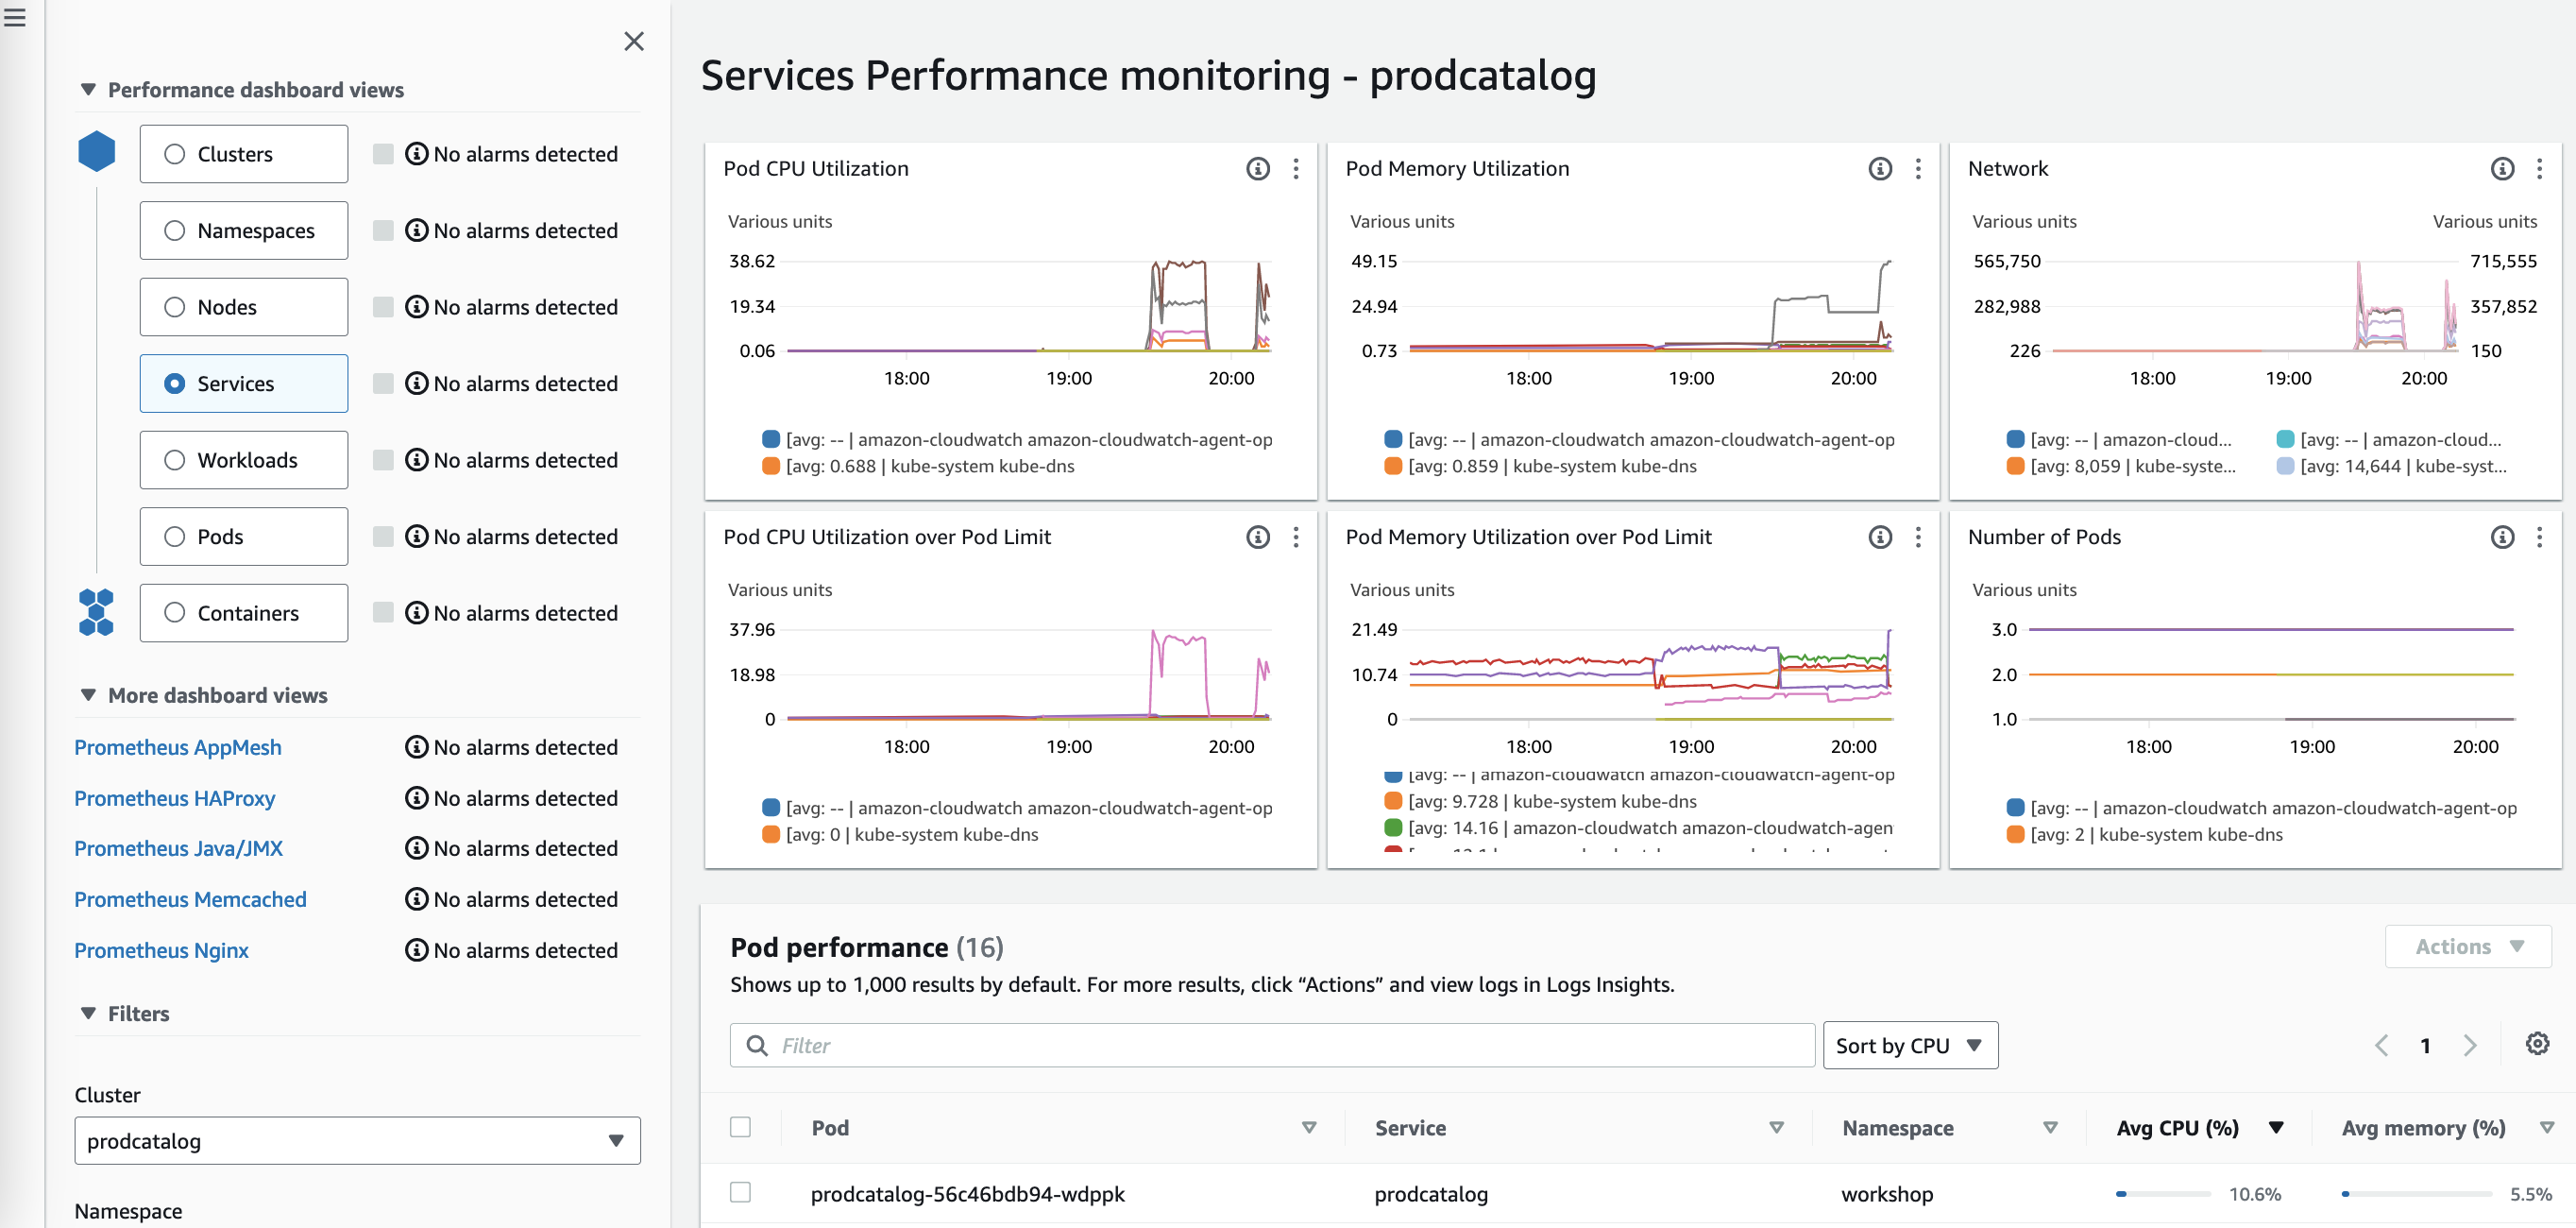
Services performance monitoring
In addition, there are Dashboard views for popular workloads such as Java, HAproxy, etc as shown below.
Dashboard views for popular workloads
You can also analyze your system and application logs in Amazon CloudWatch Container Insights. Simply click the three dots next to a metric and select “View logs” to access relevant logs. Logs Insights comes with pre-populated queries, making it easy to analyze and gain insights from your log data.
Useful graphs can also be added to your dashboard straight from Amazon CloudWatch Container Insights. When you find a graph with valuable data, click the three dots next to it and choose “Add to dashboard” to automatically add it to your dashboard for easy monitoring. It’s also simple to create alarms from these views. For example, to make an alarm for “CPU Utilization Over Pod Limit”, click the three dots and select “View in metrics”. This allows you to set up alarms based on that metric threshold. Leveraging these built-in options in Amazon CloudWatch Container Insights makes it easy to monitor, analyze, and create alerts for your containerized applications.
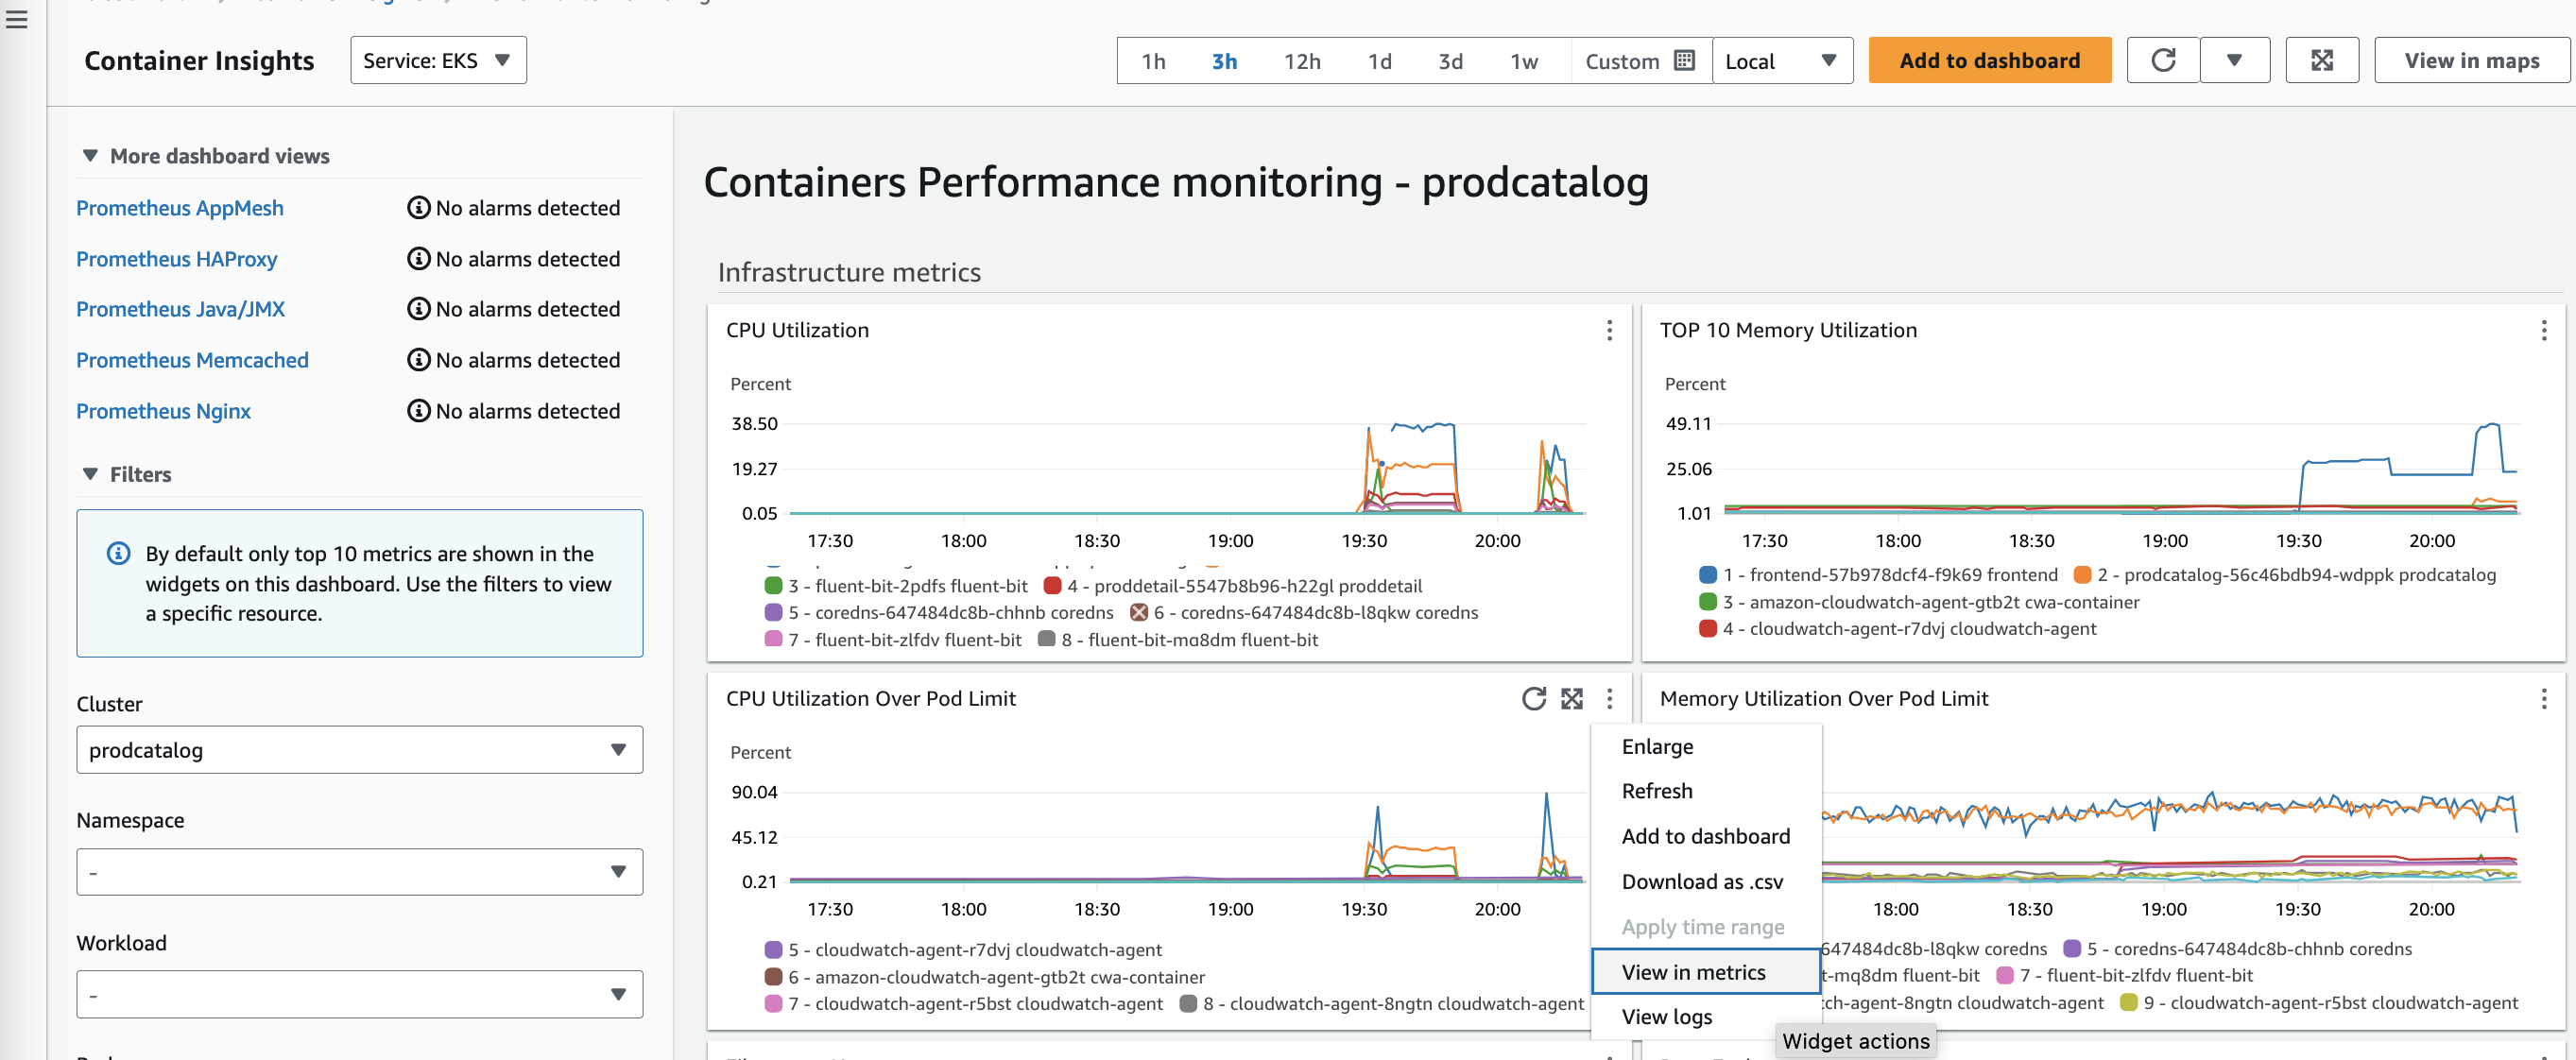
Create alarm – view in metrics
This brings the metrics view as below. From here you can click on the bell icon to create an alarm for this metric.
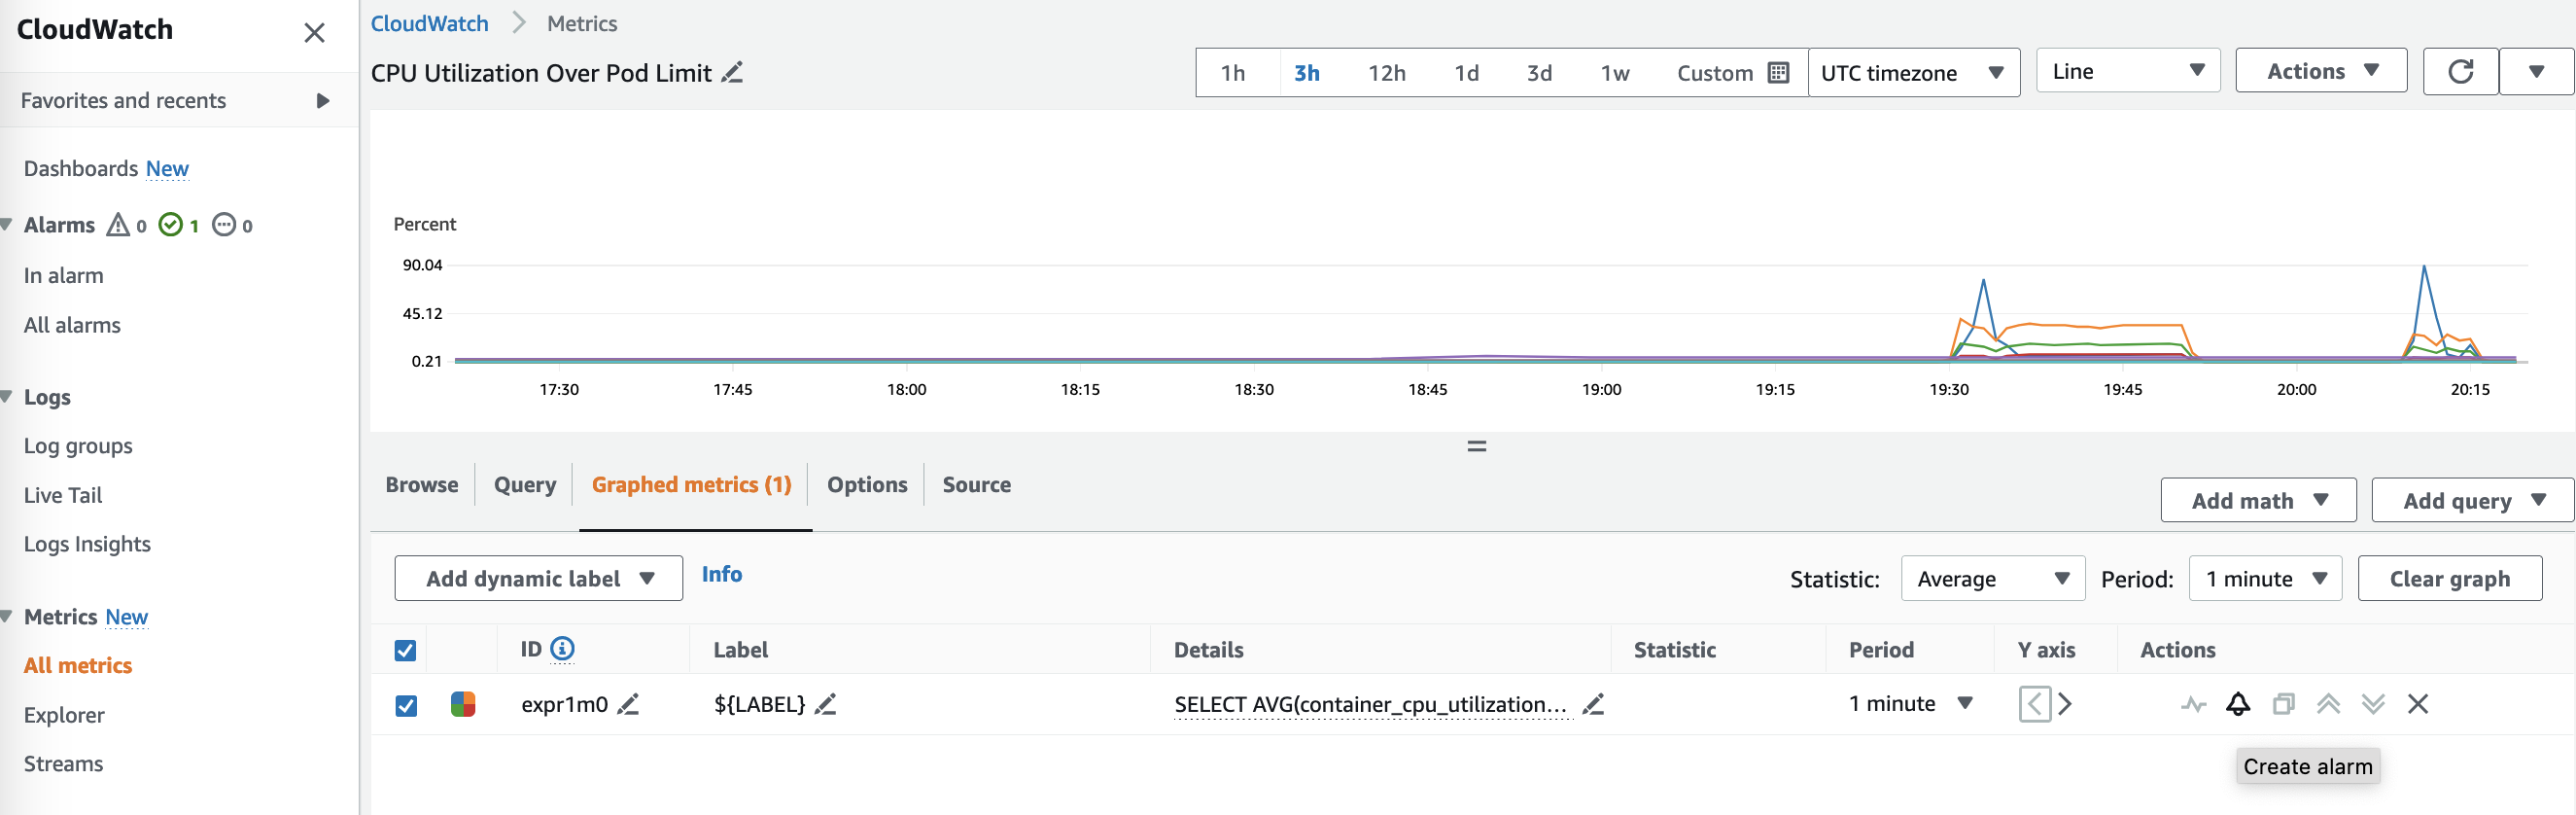
Create alarm – metrics view
This will open up the “Create Alarm” wizard and you can customize the values in the step by step guide to create an alarm. After you created the alarm, its visible from your Alarms dashboard as well.
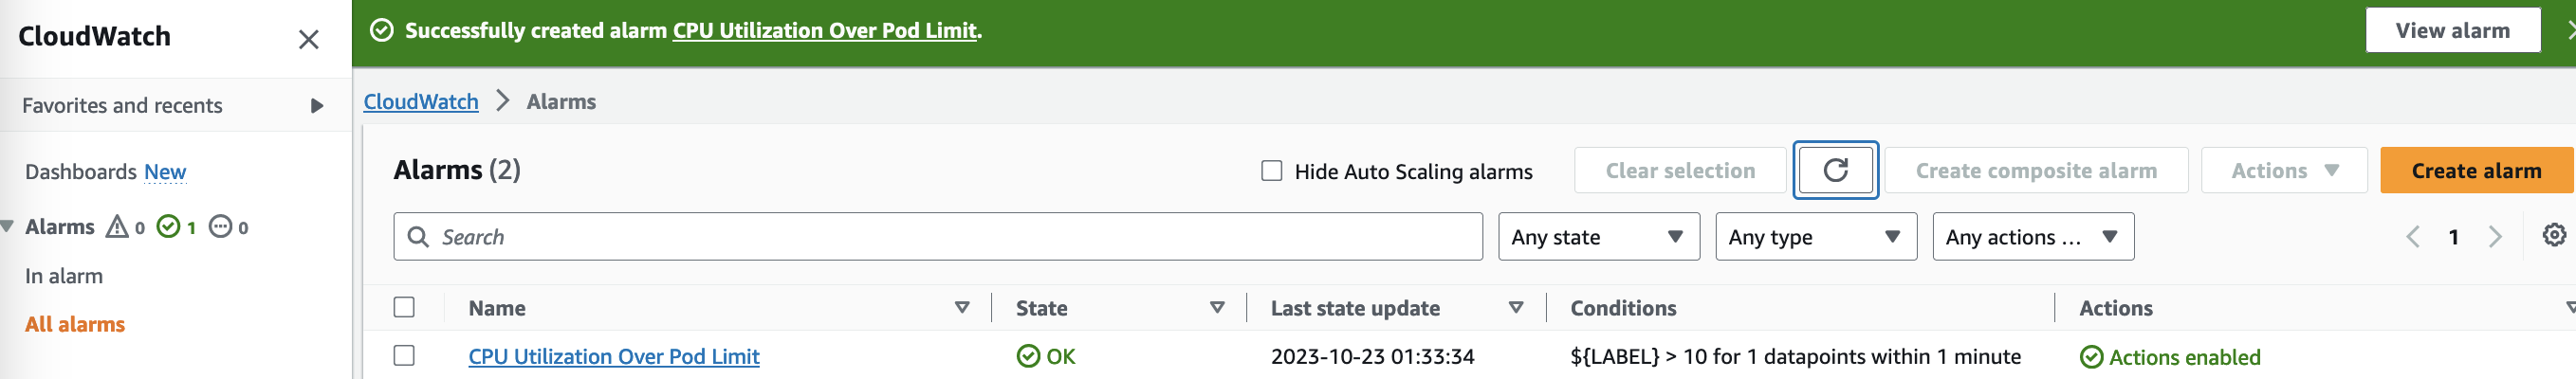
Create alarm wizard
All the new metrics are organized under the new “ContainerInsights” metrics namespace in your Cloudwatch metrics section.
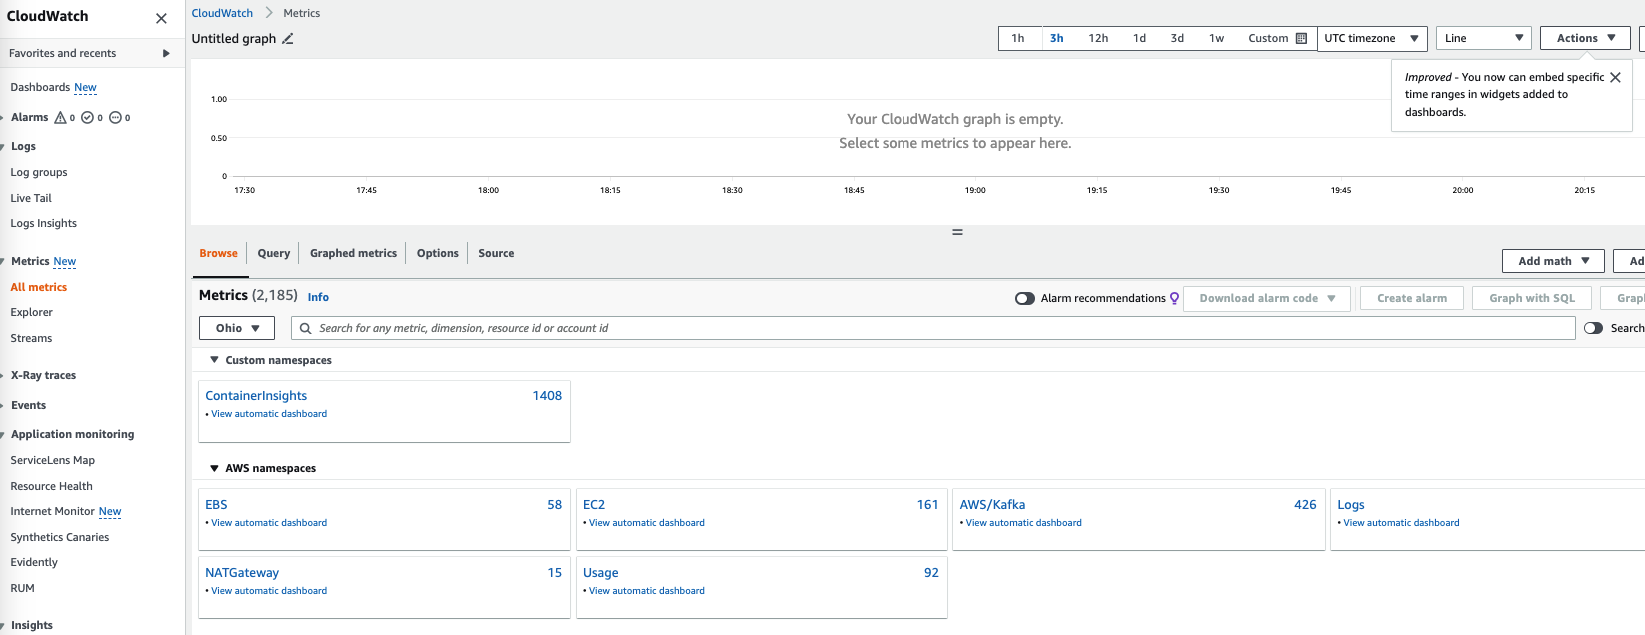
New “ContainerInsights” metrics namespace
When getting into “Container Insights”, you should be able to see various metrics as below.
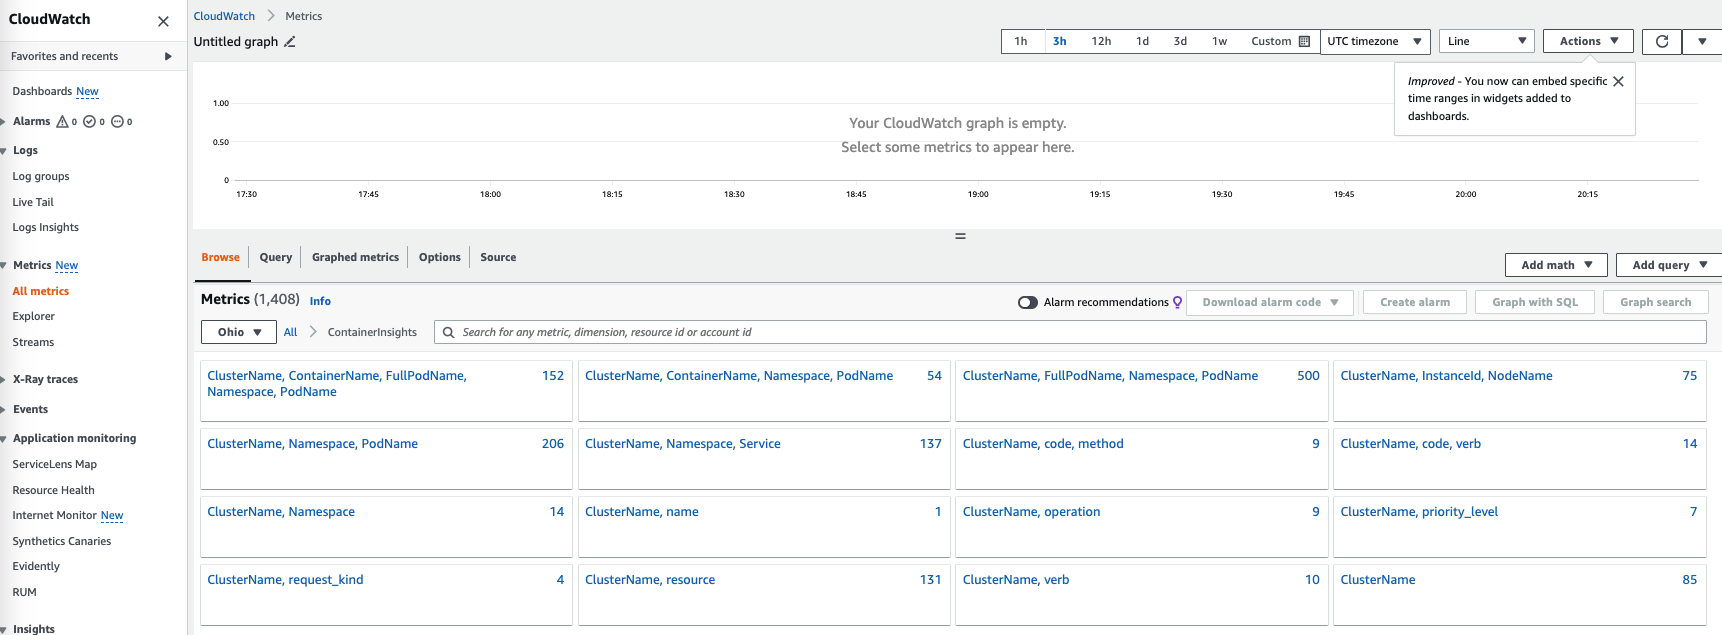
Enhanced Container Insights – various metrics
We are introducing a new unified pricing model for Amazon CloudWatch Container Insights on Amazon EKS that bundles metric storage and log ingestion into a single low-cost observation price point. This competitive pricing enables to provide enhanced observability by default, with no extra cost to collect additional metrics that fully monitor your clusters.
In this blog, we showed the various features introduced as part of the Amazon CloudWatch Container Insights with enhanced observability for Amazon Elastic Kubernetes Service. Amazon CloudWatch Container Insights provides an easy way to gain observability into container workloads on AWS, helping organizations monitor, troubleshoot, and optimize their containerized applications and microservices. With this launch, AWS has enhanced this service by expanding telemetry collection and providing an overall status dashboard. Organizations running containers on AWS can enable Amazon CloudWatch Container Insights with enhanced observability to get improved visibility and faster troubleshooting of their Kubernetes environments on EKS. This takes the guesswork out of monitoring container health and performance.
To learn more about this new improved observability for Amazon EKS, check out the documentation linked here.