In this post, we present a solution to get a head start on troubleshooting by sending an email after a reboot or failover with the last 10 minutes of important CloudWatch metrics, top queries, and related API calls performed on the instance.
AWS Performance Insights console for RDS will be deprecated on November 30, 2025. However, the Performance Insights API functionality will remain available and accessible. Refer to the documentation for more information.
Solution overview
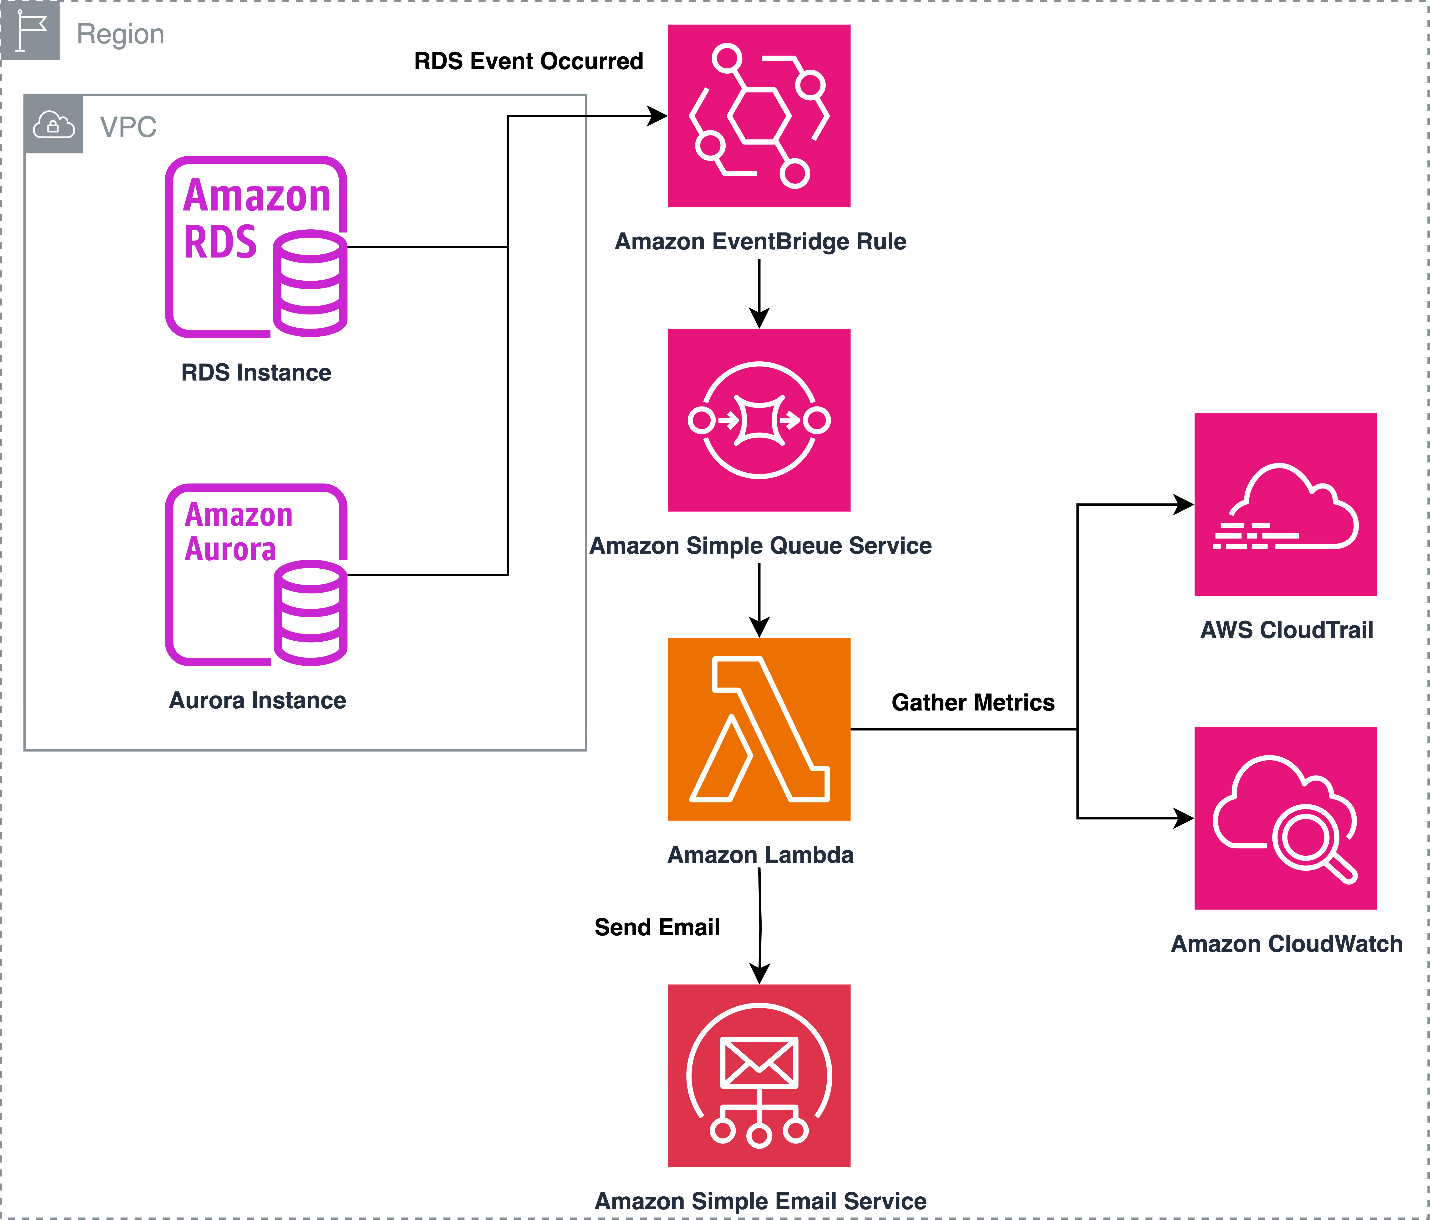
When an RDS or Aurora instance experiences an operational event such as a reboot or failover, an Amazon EventBridge rule identifies this and triggers an AWS Lambda function. This function will gather the last 10 minutes of metrics for the RDS impacted instance. This includes relevant CloudTrail events, CloudWatch metrics, and top SQL queries gathered from Performance Insights. An Amazon Simple Queue Service (Amazon SQS) queue adds a delay to the email, allowing additional time for potential CloudTrail events to be published. The Lambda function curates this information and sends it to a list of pre-configured emails using Amazon Simple Email Service (Amazon SES).
The following diagram shows the solution architecture.
You can configure which CloudWatch metrics you want to include in the email, length of time to gather data for (default 10 minutes), and who is emailed when an availability-impacting event occurs. In the following sections, we discuss how to set up the resources necessary for building it.
Prerequisites
For this walkthrough, you should have the following prerequisites:
For this solution, we create an AWS Identity and Access Management (IAM) policy that we later attach with the default Lambda execution role. This IAM policy allows Lambda to collect CloudWatch metrics, describe RDS instances, get Performance Insights data, gather CloudTrail data, and send emails using Amazon SES.
To create an IAM policy, complete the following steps:
On the IAM console, in the navigation pane, choose Policies.
Choose Create policy.
For Specify permissions, select JSON.
Enter the following JSON.
Note: You can add the applicable resources to the Resource section of the IAM Policy.
This section shows how to create the Lambda function that will be used to collect the information and send the email. We also modify the Lambda function with the proper code and IAM permissions.
Create the Lambda function
To create a Lambda function, complete the following steps:
On the Lambda console, in the navigation pane, choose Functions.
Choose Create function.
Enter a name for your Lambda function.
Specify Python 3.13 for Runtime.
For Execution role, select Create a new role with basic Lambda permissions.
Keep the rest of the options default and choose Create function.
Modify the default Lambda execution role
Complete the following steps to modify the default Lambda execution role:
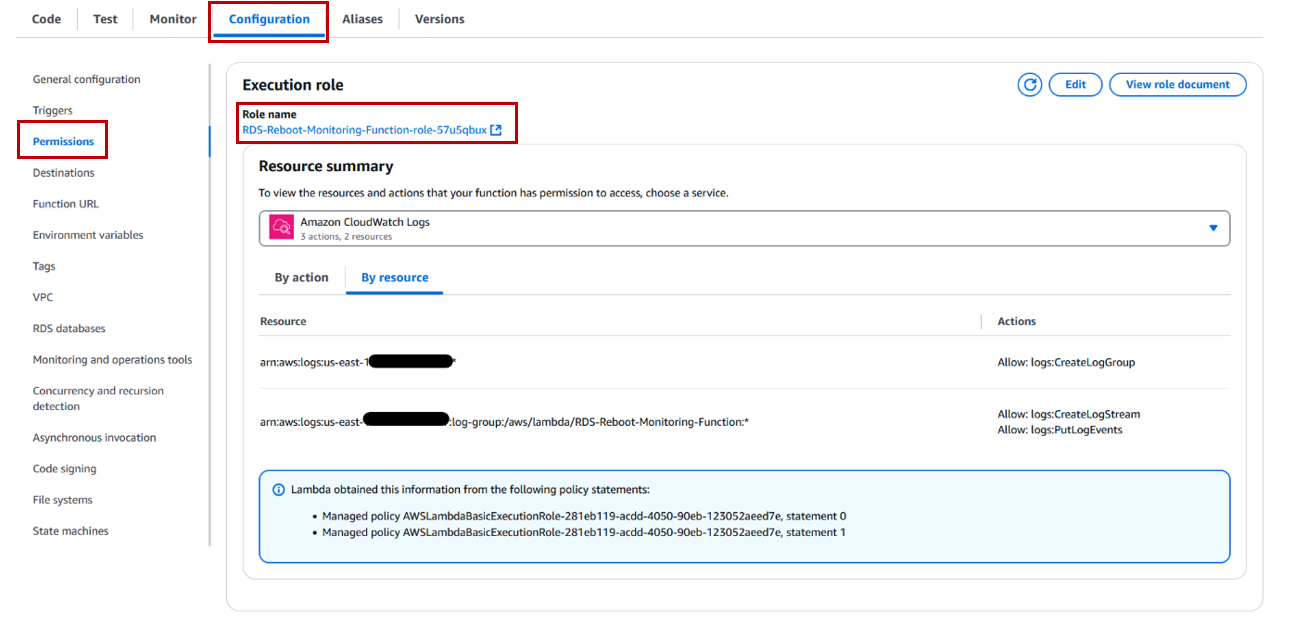
On the Lambda console, open the newly created Lambda function.
Choose the Configuration tab.
Choose Permissions in the navigation pane.
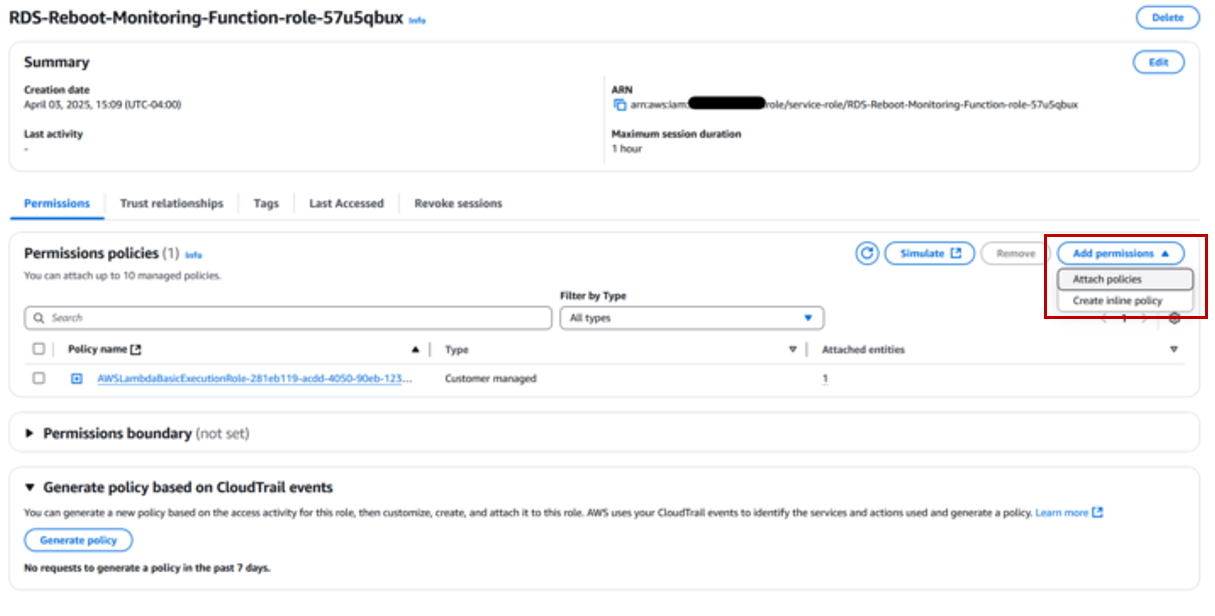
Choose the IAM role that was created when making the Lambda function.
On the IAM console, choose Add permissions and Attach policies.
Search for and select the policy that was created in the previous section, then choose Add permissions.
Search for and select AWSLambdaSQSQueueExecutionRole, then choose Add permissions.
Modify the Lambda function to include the code
Complete the following steps to modify the Lambda function:
On the Lambda console, choose Functions in the navigation pane.
Choose the function you created.
Enter the following code into the code source:
import boto3
import datetime
import os
import json
import re
import logging
from email.mime.multipart import MIMEMultipart
from email.mime.text import MIMEText

# Configure logging
logger = logging.getLogger()
logger.setLevel(logging.INFO)

# Event descriptions dictionary
EVENT_DESCRIPTIONS = {
    'Failover': {
        'description': '''A database failover has occurred. This means the primary database instance
has been automatically switched to the standby replica (in case of Multi-AZ deployments).

This can happen due to:
• An availability zone disruption
• The primary database instance becoming unresponsive
• Maintenance activities requiring failover
• Manual forced failover''',
        'common_actions': '''
• Verify application connectivity to the new primary instance
• Review CloudWatch metrics for performance impact
• Check for any ongoing AWS issues in the affected region
• Update application connection strings if necessary'''
    },
    'Recovery': {
        'description': '''A database recovery event has occurred. This indicates that RDS
has detected an issue and is attempting to recover the database instance to a healthy state.

This can happen due to:
• Database crash recovery
• Storage volume issues
• Operating system recovery''',
        'common_actions': '''Recommended actions:
• Review database logs for error messages
• Check recent database changes or operations
• Monitor instance metrics for recovery progress
• Verify data consistency after recovery'''
    },
    'Restart': {
        'description': '''The database instance has been rebooted. This can be either:
• A planned reboot (initiated by API call or maintenance)
• An unplanned reboot (due to crash or system issues)

Reboots can be required for:
• Operating system updates
• Parameter group changes
• Database engine patches
• Hardware maintenance''',
        'common_actions': '''
• Verify database connectivity after reboot
• Check if pending changes were applied
• Review logs for reboot cause
• Validate application functionality'''
    },
    'Availability': {
        'description': '''An availability event has occurred affecting the database instance.
This could indicate:
• Instance becoming unavailable
• Network connectivity issues
• Storage problems
• Other infrastructure-related issues''',
        'common_actions': '''Recommended actions:
• Check instance status and connectivity
• Review recent configuration changes
• Monitor system resources
• Verify backup availability'''
    }
}

# Documentation links
RDS_EVENT_DOC = "https://docs.aws.amazon.com/AmazonRDS/latest/UserGuide/USER_Events.Messages.html"

def validate_email(email):
    """Validate email format using basic checks"""
    pattern = r'^[a-zA-Z0-9._%+-]+@[a-zA-Z0-9.-]+\.[a-zA-Z]{2,}$'
    return bool(re.match(pattern, email))

def get_validated_emails():
    """Get and validate sender and recipient emails from environment variables"""
    try:
        # Get and clean sender email
        sender_email = os.environ['SENDER_EMAIL'].strip()
        if not validate_email(sender_email):
            raise ValueError(f"Invalid sender email format: {sender_email}")

        # Get and clean recipient emails
        recipient_emails_raw = os.environ['RECIPIENT_EMAILS']
        # Split by comma and handle multiple delimiter types
        recipient_emails = [email.strip() for email in re.split('[,;]', recipient_emails_raw)]
        # Remove empty strings and validate each email
        recipient_emails = [email for email in recipient_emails if email]

        invalid_emails = [email for email in recipient_emails if not validate_email(email)]
        if invalid_emails:
            raise ValueError(f"Invalid recipient email format(s): {', '.join(invalid_emails)}")

        if not recipient_emails:
            raise ValueError("No valid recipient emails provided")

        return sender_email, recipient_emails

    except KeyError as e:
        raise KeyError(f"Missing required environment variable: {str(e)}")

def format_metric_value(metric, value):
    """Format metric values based on metric type"""
    if metric == 'FreeableMemory':
        return f"{value / (1024 * 1024):.2f} MB"
    elif metric.endswith('Latency'):
        return f"{value * 1000:.2f} ms"
    elif metric.endswith('Throughput'):
        return f"{value:.2f} MB/s"
    elif metric.endswith('IOPS'):
        return f"{value:.2f}"
    elif metric == 'DatabaseConnections':
        return f"{value:.0f}"
    else:
        return f"{value:.2f}%"

def process_event(event_data):
    try:
        # Get and validate emails
        try:
            sender_email, recipient_emails = get_validated_emails()
        except (ValueError, KeyError) as e:
            logger.error(f"Email validation error: {str(e)}")
            return {
                'statusCode': 400,
                'body': f'Email validation failed: {str(e)}'
            }

        # Extract basic event information
        try:
            db_instance_arn = event_data.get('resources', [])
            if not db_instance_arn:
                raise ValueError("No resources found in event data")

            db_instance_arn = db_instance_arn[0]
            if not db_instance_arn:
                raise ValueError("Empty resource ARN")

            instance_name = db_instance_arn.split(':')[-1]
            if not instance_name:
                raise ValueError("Could not extract instance name from ARN")

            # Required fields for proper event processing
            event_source = event_data.get('source')
            if not event_source:
                raise ValueError("Event source not found")

            event_detail_type = event_data.get('detail-type')
            if not event_detail_type:
                raise ValueError("Event detail type not found")

            event_id = event_data.get('id')
            if not event_id:
                raise ValueError("Event ID not found")

            logger.info(f"Successfully extracted event information - Instance: {instance_name}, "
                       f"Source: {event_source}, Type: {event_detail_type}, ID: {event_id}")

        except (KeyError, IndexError, ValueError) as e:
            logger.error(f"Failed to extract required event information: {str(e)}")
            logger.error(f"Event data: {json.dumps(event_data)}")
            return {
                'statusCode': 400,
                'body': f'Invalid event data: {str(e)}'
            }


        # Parse event time using standard library
        event_time = datetime.datetime.fromisoformat(event_data.get('time').replace('Z', '+00:00'))
        start_time = event_time - datetime.timedelta(minutes=10)

        # Process event type
        event_details = event_data.get('detail', {})
        event_category = event_details.get('EventCategories', ['Unknown'])[0]
        event_message = event_details.get('Message', 'No specific message provided')

        # Define event type mappings and find matching type
        event_types = [
            ('reboot', 'Reboot'),
            ('restart', 'Restart'),
            ('recovery', 'Recovery'),
            ('failover', 'Failover')
        ]
        matching_types = [event_type for keyword, event_type in event_types
                         if keyword in event_message.lower()]
        trigger_type = matching_types[0] if matching_types else event_category

        logger.info(f"Processing event for DB instance: {instance_name}")
        logger.info(f"Event details - Source: {event_source}, Type: {event_detail_type}, ID: {event_id}")
        logger.info(f"Event time: {event_time}, Trigger type: {trigger_type}")
        logger.debug(f"Event message: {event_message}")

        # Set up AWS clients
        cloudwatch = boto3.client('cloudwatch')
        ses = boto3.client('ses')
        pi = boto3.client('pi')
        rds = boto3.client('rds')
        cloudtrail = boto3.client('cloudtrail')

        # Set the metric details
        namespace = 'AWS/RDS'
        metrics = [
            'CPUUtilization',
            'WriteLatency',
            'WriteThroughput',
            'WriteIOPS',
            'ReadLatency',
            'ReadThroughput',
            'ReadIOPS',
            'FreeableMemory',
            'DatabaseConnections'
        ]

        logger.info(f"Collecting metrics for time window: {start_time} to {event_time}")

        # Prepare metric data queries
        metric_data_queries = []
        for i, metric in enumerate(metrics):
            metric_data_queries.append({
                'Id': f'metric_{i}',
                'MetricStat': {
                    'Metric': {
                        'Namespace': namespace,
                        'MetricName': metric,
                        'Dimensions': [
                            {
                                'Name': 'DBInstanceIdentifier',
                                'Value': instance_name
                            }
                        ]
                    },
                    'Period': 60,
                    'Stat': 'Average'
                }
            })

        # Retrieve and process the metric data
        response = cloudwatch.get_metric_data(
            MetricDataQueries=metric_data_queries,
            StartTime=start_time,
            EndTime=event_time
        )

        metric_data = {}
        for i, metric in enumerate(metrics):
            data_points = list(zip(response['MetricDataResults'][i]['Timestamps'],
                                   response['MetricDataResults'][i]['Values']))
            data_points.sort(key=lambda x: x[0])
            metric_data[metric] = data_points

        # Get instance details and Performance Insights data
        instance_info = rds.describe_db_instances(DBInstanceIdentifier=instance_name)
        resource_id = instance_info['DBInstances'][0]['DbiResourceId']
        logger.info(f"Retrieved instance details for {instance_name} (Resource ID: {resource_id})")

        # Extract instance attributes
        instance_details = instance_info['DBInstances'][0]
        instance_class = instance_details.get('DBInstanceClass', 'N/A')
        engine = instance_details.get('Engine', 'N/A')
        engine_version = instance_details.get('EngineVersion', 'N/A')
        availability_zone = instance_details.get('AvailabilityZone', 'N/A')
        region = availability_zone[:-1] if availability_zone != 'N/A' else 'N/A'
        storage_type = instance_details.get('StorageType', 'N/A')
        storage_size = instance_details.get('AllocatedStorage', 'N/A')
        multi_az = instance_details.get('MultiAZ', 'N/A')

        # Get instance tags
        tags_response = rds.list_tags_for_resource(
            ResourceName=db_instance_arn
        )
        instance_tags = tags_response.get('TagList', [])
        logger.info(f"Retrieved {len(instance_tags)} tags for instance {instance_name}")

        # Get Performance Insights data
        logger.info("Retrieving Performance Insights data")
        pi_response = pi.get_resource_metrics(
            ServiceType='RDS',
            Identifier=resource_id,
            StartTime=start_time,
            EndTime=event_time,
            MetricQueries=[
                {
                    'Metric': 'db.load.avg',
                    'GroupBy': {
                        'Group': 'db.sql_tokenized',
                        'Limit': 10
                    }
                }
            ],
            PeriodInSeconds=300
        )

        # Process Performance Insights data
        top_sql_digests = []
        if pi_response['MetricList']:
            for item in pi_response['MetricList']:
                if 'Dimensions' in item['Key']:
                    sql_id = item['Key']['Dimensions']['db.sql_tokenized.id']
                    sql_statement = item['Key']['Dimensions']['db.sql_tokenized.statement']
                    avg_load = sum(point['Value'] for point in item['DataPoints']) / len(item['DataPoints'])
                    top_sql_digests.append({
                        'HKID': sql_id,
                        'AverageDBLoad': avg_load,
                        'FullStatement': sql_statement
                    })
            logger.info(f"Retrieved {len(top_sql_digests)} SQL digests from Performance Insights")
        else:
            logger.info("No Performance Insights data available for the specified time range")

        # Get CloudTrail events
        logger.info("Retrieving CloudTrail events")
        cloudtrail_events = cloudtrail.lookup_events(
            LookupAttributes=[
                {
                    'AttributeKey': 'ResourceName',
                    'AttributeValue': instance_name
                },
            ],
            StartTime=start_time,
            EndTime=event_time
        )
        logger.info(f"Retrieved {len(cloudtrail_events['Events'])} CloudTrail events")

        # Create the email message
        msg = MIMEMultipart()
        msg['Subject'] = f'RDS Alert: {trigger_type} Event for {instance_name}'
        msg['From'] = sender_email
        msg['To'] = ', '.join(recipient_emails)

        # Organize data for email sections
        event_info = {
            'Trigger Type': trigger_type,
            'Event Type': event_detail_type,
            'Event Source': event_source,
            'Event Time': event_time,
            'Event ID': event_id,
            'DB Instance': instance_name,
            'Event Message': event_message
        }

        instance_info = {
            'Instance Class': instance_class,
            'Engine': f"{engine} {engine_version}",
            'Region': region,
            'Availability Zone': availability_zone,
            'Storage Type': storage_type,
            'Allocated Storage': f"{storage_size} GB",
            'Multi-AZ': multi_az
        }

        # Build email body sections
        sections = []

        # 1. Event Information Section
        event_section = "RDS Event Alert\n\n"
        for key, value in event_info.items():
            event_section += f"{key}: {value}\n"
        sections.append(event_section)

        # 2. Event Description and Documentation Section
        if trigger_type in EVENT_DESCRIPTIONS:
            desc_section = "Event Description:\n\n"
            desc_section += EVENT_DESCRIPTIONS[trigger_type]['description'] + "\n\n"
            desc_section += "Recommended Actions:\n"
            desc_section += EVENT_DESCRIPTIONS[trigger_type]['common_actions'] + "\n\n"
            desc_section += "For a complete list of RDS events and their descriptions, visit:\n"
            desc_section += f"{RDS_EVENT_DOC}"
            sections.append(desc_section)

        # 3. Instance Details Section
        instance_section = "Instance Details:\n"
        for key, value in instance_info.items():
            instance_section += f"{key}: {value}\n"

        if instance_tags:
            instance_section += "\nInstance Tags:\n"
            for tag in instance_tags:
                instance_section += f"{tag['Key']}: {tag['Value']}\n"
        else:
            instance_section += "\nNo tags found for this instance"
        sections.append(instance_section)

        # 4. Metrics Section
        metrics_section = f"RDS Metrics data for {instance_name} for the 10 minutes prior to the event:\n\n"
        for metric in metrics:
            metrics_section += f"\n{metric}:\n"
            metrics_section += "Timestamp (UTC) | Value\n"
            metrics_section += "-" * 40 + "\n"
            for timestamp, value in metric_data[metric]:
                formatted_value = format_metric_value(metric, value)
                metrics_section += f"{timestamp.strftime('%Y-%m-%d %H:%M:%S')} | {formatted_value}\n"
            metrics_section += "\n"
        sections.append(metrics_section)

        # 5. Performance Insights Section
        pi_section = "Top SQL Statements from Performance Insights (10 minutes prior to the event):\n"
        if top_sql_digests:
            for i, sql in enumerate(top_sql_digests, 1):
                pi_section += f"\n{i}. HKID: {sql['HKID']}\n"
                pi_section += f"   Average DB Load: {sql['AverageDBLoad']:.6f}\n"
                pi_section += f"   SQL Statement: {sql['FullStatement'][:500]}...\n"
                pi_section += "-" * 60 + "\n"
        else:
            pi_section += "No SQL statements found in Performance Insights for the specified time range.\n"
        sections.append(pi_section)

        # 6. CloudTrail Events Section
        cloudtrail_section = "CloudTrail Events (10 minutes prior to the event):\n"
        if cloudtrail_events['Events']:
            cloudtrail_section += "Timestamp (UTC) | Event Name | Username\n"
            cloudtrail_section += "-" * 60 + "\n"
            for event in cloudtrail_events['Events']:
                timestamp = event['EventTime'].strftime('%Y-%m-%d %H:%M:%S')
                event_name = event['EventName']
                username = event.get('Username', 'N/A')
                cloudtrail_section += f"{timestamp} | {event_name} | {username}\n"
        else:
            cloudtrail_section += "No CloudTrail events were found for the specified time range. "
            cloudtrail_section += "Please note that this does not guarantee there was no API call "
            cloudtrail_section += "during the event time. It is possible CloudTrail has not delivered it yet.\n"
        sections.append(cloudtrail_section)

        # Combine all sections with separators
        separator = "\n" + "-" * 60 + "\n\n"
        body = separator.join(sections)

        msg.attach(MIMEText(body, 'plain'))

        # Send the email using Amazon SES
        logger.info(f"Sending email notification to {len(recipient_emails)} recipients")
        ses.send_raw_email(
            Source=sender_email,
            Destinations=recipient_emails,
            RawMessage={'Data': msg.as_string()}
        )
        logger.info("Email sent successfully")

        return {
            'statusCode': 200,
            'body': 'Email sent successfully'
        }

    except Exception as e:
        logger.error(f"Error processing event: {str(e)}", exc_info=True)
        return {
            'statusCode': 500,
            'body': f'Error processing event: {str(e)}'
        }

def lambda_handler(event, context):
    logger.info(f"Received event: {json.dumps(event)}")

    for record in event['Records']:
        try:
            message_body = json.loads(record['body'])
            logger.info(f"Processing SQS message: {json.dumps(message_body)}")
            process_event(message_body)
        except Exception as e:
            logger.error(f"Error processing SQS message: {str(e)}", exc_info=True)
            logger.error(f"Failed message: {record['body']}")
            continue

    return {
        'statusCode': 200,
        'body': 'Processing complete'
    }
In the metrics section, you can configure additional CloudWatch metrics (such as DiskQueueDepth in RDS or DDLThroughput in Aurora) to include within the email if desired.
Choose Deploy to save the changes.
Add Lambda environment variables
Next, we add some environment variables that the preceding code is dependent on. Complete the following steps:
On the Lambda function details page, choose the Configuration tab.
Choose Environment variables in the navigation pane, then choose Edit.
Choose Add environment variable and add the following variables:
Add the key SENDER_EMAIL with the email that will send this message as the value.
Add the key RECIPIENT_EMAILS with the emails that will receive this message as the value.
Choose Save.
Change the Lambda function’s timeout value
To allow the Lambda function an ample amount of time to complete, you must increase the timeout value. Complete the following steps:
On the Lambda function details page, choose the Configuration tab.
Choose General configuration in the navigation pane, then choose Edit.
Edit the timeout value to at least 10 seconds.
Choose Save.
Verify sender and recipient emails using Amazon SES
To allow the previously configured emails within the Lambda function’s environment variables to send and receive emails, you must verify them in Amazon SES. Complete the following steps to verify each email:
On the Amazon SES console, choose Identities in the navigation pane.
Choose Create identity and choose Email address.
For Email address, enter the email address that you want to use.
To create your email address identity, choose Create identity.
After it’s created, you should receive a verification email within 5 minutes.
Check the inbox of the email address used to create your identity and look for an email from no-reply-aws@amazon.com.
Open the email and choose the link to complete the verification process for the email address.
After it’s complete, the identity status updates to Verified.
In this section, we create an SQS queue that will add a delay (if desired) to the email being sent. Adding a delay provides additional time for potential CloudTrail events to be published. You can configure this delay to your desired business requirements. Additionally, we add an SQS trigger to our Lambda function.
Create an SQS queue
Complete the following steps to create an SQS queue:
On the Amazon SQS console, choose Queues in the navigation pane.
Choose Create queue.
Enter a name for your queue.
Change Delivery delay to 5 minutes or to the desired duration it will take to receive an email after an availability-impacting event.
Leave everything else as default and choose Create.
Add a Lambda trigger
Complete the following steps to add a Lambda trigger:
On the Lambda console, choose Functions in the navigation pane.
Choose the function you created.
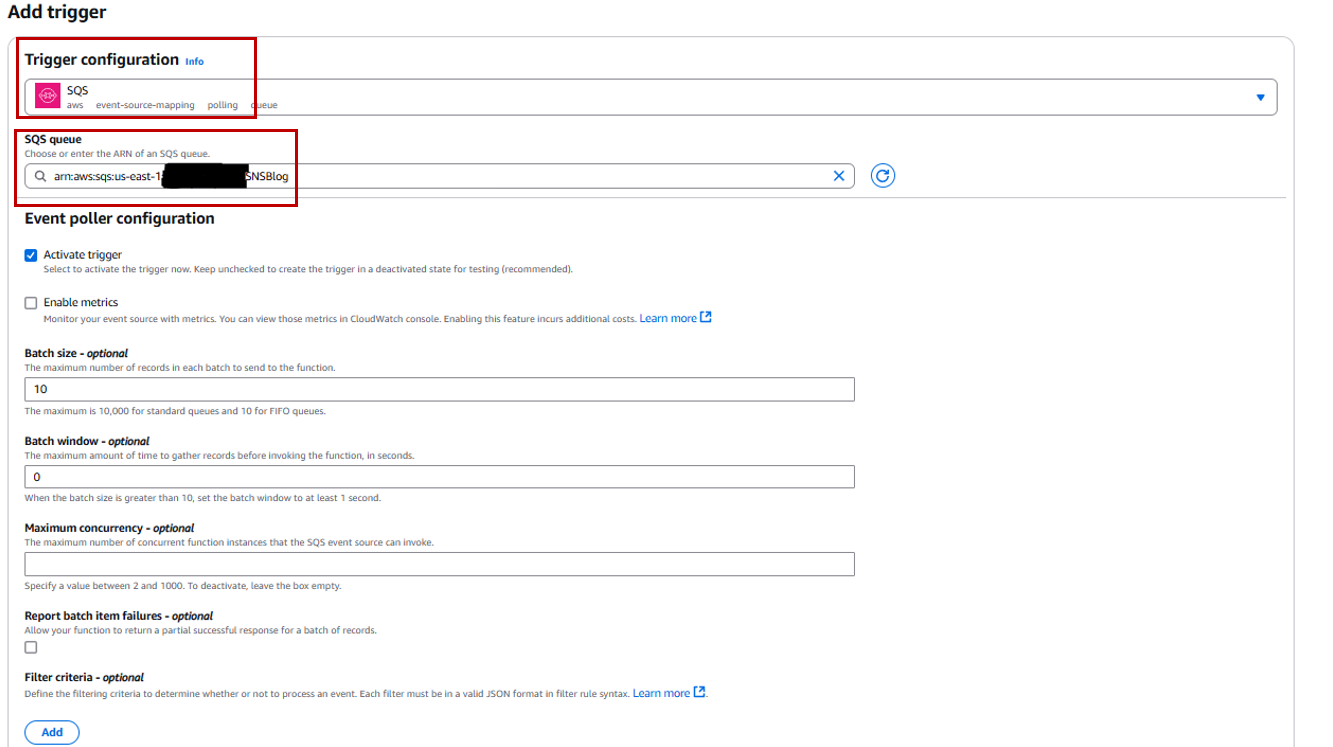
Choose Add trigger.
For Trigger configuration, choose SQS as the source and search for the SQS queue you created in the previous step.
Choose Add to finalize the trigger.
Create an EventBridge rule
In this section, we configure an EventBridge rule that will insert an event into our SQS queue whenever the monitored RDS instances exhibit a failover, recovery, or availability event. For a full list of Amazon RDS events, refer to Amazon RDS event categories and event messages. Compete the following steps to create the rule:
On the EventBridge console, choose Rules in the navigation pane.
Choose Create rule.
Enter a name for the EventBridge rule and choose Next.
For Event source, select AWS events or EventBridge partner events.
Enter the following custom pattern, and replace the db-instance-1 and db-instance-2 with the RDS instance names you want to monitor. Additionally, you can configure the RDS EventCategories that trigger this EventBridge rule according to your business requirements.
When implementing this solution, it’s important to be aware of potential edge cases. These considerations should be evaluated based on your specific use case and monitoring requirements.
CloudTrail Event Delivery
While the SQS queue delay (default 5 minutes) helps capture more CloudTrail events, CloudTrail does not guarantee event delivery within any specific timeframe. Events can occasionally take longer than 5 minutes to appear in CloudTrail logs. This means that even with the delay, some relevant API calls might not appear in the email report. When investigating incidents, it’s recommended to check CloudTrail logs directly for a more complete picture of API activity.
Multiple Event Notifications
A single incident can trigger multiple RDS events as a result, users might receive multiple email reports for what is effectively the same incident. For example:
A failover typically generates both a failover event and a reboot event
A multi-AZ failover might generate events for both the primary and standby instances
Some maintenance operations can trigger multiple related events in sequence
Performance Insights Data Collection
The API has rate limits that could affect data collection for frequent events
In this post, we demonstrated a custom solution that emails users a comprehensive report of their RDS or Aurora database activity prior to a reboot. This includes the previous 10 minutes of applicable API calls gathered in CloudTrail, important CloudWatch metrics, and top SQL queries gathered in Performance Insights. This report can help you better understand why the reboot occurred on your Amazon RDS or Aurora resources and swiftly diagnose it. Implement this solution to enhance your RDS operational visibility and reduce troubleshooting time during availability-impacting events.