AWS Database Blog
AI-powered tuning tools for Amazon RDS for PostgreSQL and Amazon Aurora PostgreSQL databases: PI Reporter
AWS offers several services to gather and analyze database performance metrics for Amazon Relational Database Service (Amazon RDS). This includes Amazon CloudWatch and CloudWatch Database Insights. Additionally, you can create custom dashboards for monitoring Amazon RDS for PostgreSQL and Amazon Aurora PostgreSQL-Compatible Edition with different tools (to learn more, see Create an Amazon CloudWatch dashboard to monitor Amazon RDS for PostgreSQL and Amazon Aurora PostgreSQL and Monitor Amazon RDS for PostgreSQL and Amazon Aurora PostgreSQL performance using PGSnapper).
With the advancements of artificial intelligence and machine learning (AI/ML), myriad solutions are available that use ML capabilities within the database monitoring space. These tools offer a range of features, from monitoring performance bottlenecks to operational issues. They also offer prescriptive recommendations to resolve the issues both proactively and reactively.
In this post, we explore an artificial intelligence and machine learning (AI/ML)-powered database monitoring tool for PostgreSQL, using a self-managed or managed database service such as Amazon RDS for PostgreSQL and Amazon Aurora PostgreSQL.
Considerations for monitoring
In this section, we discuss the metrics that are critical for every database. These metrics need to be monitored periodically to preserve historical information for comparing and benchmarking changes of workloads, database parameters, and other factors impacting performance. The following table lists the recommended metrics to monitor for your AWS managed databases.
| Source for Monitoring | Parameter/Metrics |
| Amazon CloudWatch | Database Connections |
| CPU Utilization | |
| Freeable Memory | |
| FreeStorageSpace | |
| ReadLatency, WriteLatency | |
| DiskQueueDepth | |
| ReadIOPS, WriteIOPS | |
| WriteThroughput, ReadThroughput | |
| ReplicaLag | |
| OldestReplicationSlotLag | |
| ReplicationSlotDiskUsage | |
| MaximumUsedTransactionIDs | |
| Amazon CloudWatch Database Insights | DatabaseLoad |
| IO Latency | |
| EBS IO | |
| LongestIdleInTransaction | |
| CPU Utilization (%) | |
| Sessions | |
| Tuples | |
| Transactions, Transaction in progress | |
| IO cache vs Disk read | |
| Deadlocks | |
| OS Processes | |
| pg_stat_progress_vacuum | Vacuum progress |
| pg_stat_activity | state of the query/idle_in_transaction |
For complete lists, refer to OS metrics in Enhanced Monitoring, SQL statistics for RDS PostgreSQL, CloudWatch Database Insights counters for Amazon RDS for PostgreSQL, Vacuum Progress Reporting and pg_stat_activity.
Here we are discussing an AI/ML based database monitoring and troubleshooting tool: PI Reporter, including its capabilities and use cases.
PI Reporter is an open source tool developed by an AWS solutions architect for capturing performance metrics and workload snapshots, generating in-depth comparison reports for Amazon Aurora PostgreSQL-Compatible Edition, and providing optional report analysis with the help of Amazon Bedrock.
PI Reporter
PI Reporter integrates with Amazon Bedrock, harnessing the capabilities of large language models (LLMs) like Anthropic’s Claude or Amazon Nova models to analyze individual snapshots and comparative data. Make sure you have access to the required models. This analysis generates comprehensive summaries, root cause analysis, and actionable recommendations for database performance issues found in the snapshot window.
With PI Reporter, you can do the following:
- Get a comprehensive HTML report on instance-related information in minutes
- Compare periodic reports to detect performance, workload, or configuration changes
- Assess if the instance can handle the workload and identify right-sizing needs
- Share instance statistics with third parties without compromising system security
- Receive LLM analysis, including root cause identification and recommendations
You can benefit from this tool in numerous scenarios. Here are some common examples: When you experience a sudden degradation in database performance, PI Reporter can take snapshots of both the affected period and a comparable period with normal database activity. The HTML comparison report immediately shows what changed and the possible root causes.
Another valuable use case involves assessing workload changes after you modify the database as planned. This includes situations such as when you release new major applications, upgrade to major database versions, migrate to new clusters using blue-green deployment, or make other significant changes. In these scenarios, you can take snapshots before and after the change to generate comparison reports.
For Amazon Aurora PostgreSQL Serverless instance monitoring, PI Reporter helps identify reasons for unexpected high Aurora Capacity Units (ACU) usage by comparing periods of expected and unexpected ACU utilization patterns.
These examples demonstrate just a few ways you can utilize the tool – the possibilities extend to any scenario where performance comparison and analysis are needed.
We designed the tool to be lightweight and straightforward to use. You can deploy it as a Node.js script on Amazon Elastic Compute Cloud (Amazon EC2) or on-premises. We include the portable version of the script, compiled for Linux x86 systems. For more information on the PI Reporter setup, refer to the GitHub repo.
Solution overview
The following diagram illustrates the PI Reporter architecture using AWS services.
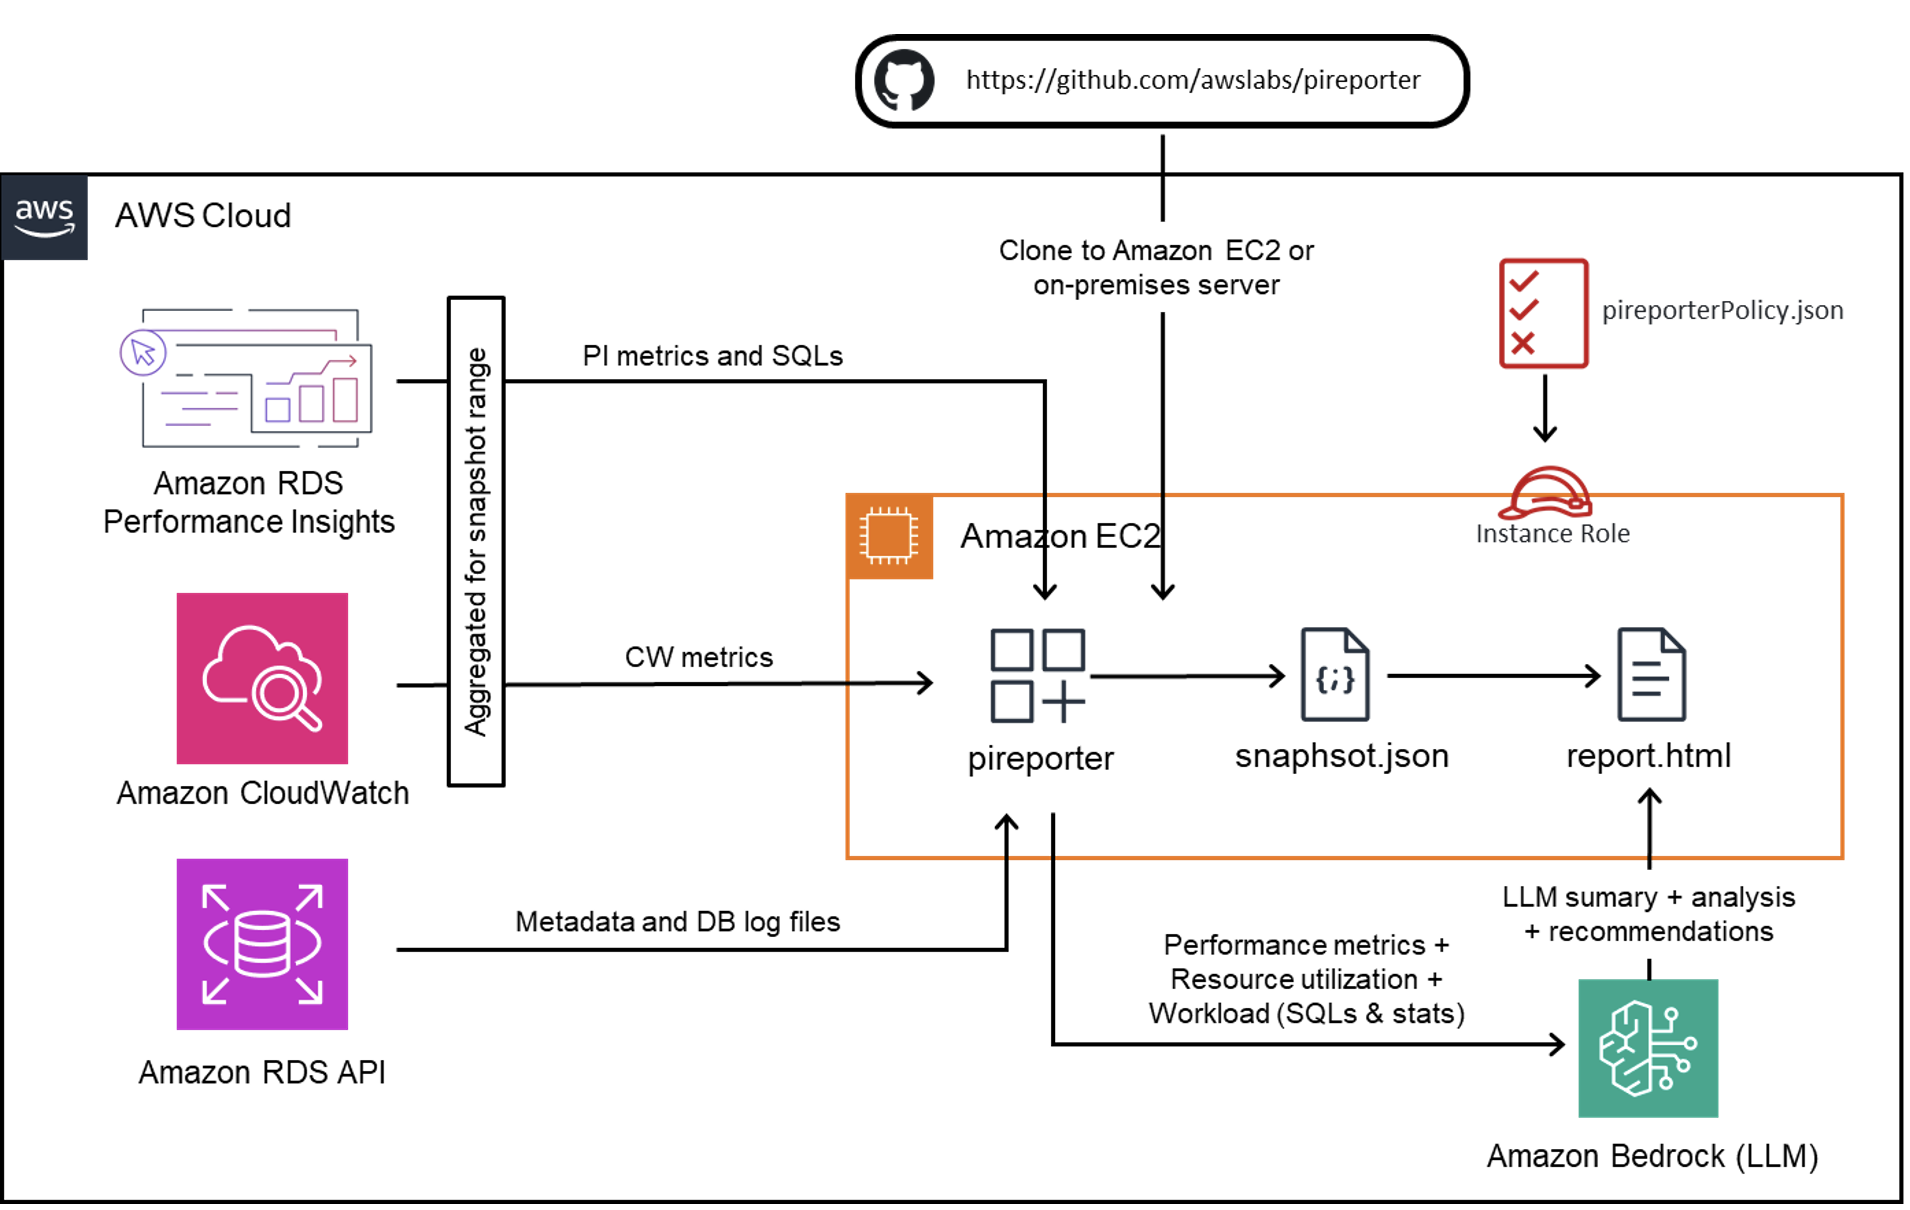
Here’s how the solution works. It consists of four layers:
- Data collection layer:
- Amazon CloudWatch Database Insights provides instance-level counter performance metrics and SQL-level metrics
- Amazon CloudWatch supplies infrastructure and resource metrics
- Amazon RDS provides metadata and database log file information
- Processing layer:
- The PI Reporter tool aggregates data from all data sources
- An instance role with appropriate permissions is required, configured through the pireporterPolicy.json IAM Policy
- The tool processes the collected data and generates a JSON snapshot file with consolidated metrics
- Analysis layer:
- For enhanced analysis, the solution integrates with Amazon Bedrock
- The system sends performance metrics, resource utilization data, and workload information (including SQL statistics) incorporated with relevant knowledge to Amazon Bedrock.
- Amazon Bedrock’s LLM capabilities provide the following:
- Comprehensive summaries
- In-depth analysis
- Actionable recommendations
- Output:
- The final output is generated as an HTML report containing both raw metrics and LLM-powered insights
- This architecture ensures comprehensive performance monitoring and analysis while maintaining security through proper IAM roles and permissions.
Prerequisites
Because PI Reporter uses information from Amazon CloudWatch Database Insights, you must first enable Amazon CloudWatch Database Insights.
The following are PostgreSQL-specific requirements that are common for tuning and troubleshooting tools:
- Enable the
pg_stat_statementsextension to collect per-query statistics. This extension is enabled by default in Aurora PostgreSQL. - By default, PostgreSQL databases truncate queries longer than 1,024 bytes. To increase the logged query size, change the
track_activity_query_sizeparameter in the DB parameter group associated with your DB instance. When you change this parameter, a database restart is required.
For more information, refer to the GitHub repo.
Install and run PI Reporter
PI Reporter is designed to be straightforward to use. You can download it from the GitHub repo on Amazon EC2 with Linux OS or another on an on-premises Linux host with access to the AWS Region where the Aurora PostgreSQL cluster is running.
Complete the following steps to install PI Reporter:
- Clone the repository to your local file system:
After cloning the repository, you will find the
pireporterPolicy.jsonAWS Identity and Access Management (IAM) policy file inside thepireporterdirectory. This policy includes the permissions required to run PI Reporter. These permissions are read-only and include only the mandatory ones. According to the policy, only instances and clusters with the tagpireporter:allowcan be accessed. You can modify the provided policy file if you want to relax the restriction conditions. - Attach the
pireporterPolicyto the instance role of the EC2 instance where you plan to run the tool. If you run the tool on-premises Linux host, then use your access key and secret key in the shared credentials file~/.aws/credentials. Install the latest version of the AWS CLI on the EC2 instance to connect to the RDS instance programmatically. The AWS SDK used in PI Reporter will automatically read the policy file on load. In this case the policy must be attached to the IAM entity to which the access key applies.The AWS Region will be automatically set to the region of the hosting EC2 instance, based on the instance metadata. You can override this by setting the AWS_REGION environment variable to the desired value, especially when you run the tool on-premises. - You have two options to run the tool:
- To use Node.js to run the pireporter tool, Node.js must be installed on the host from where you would like to generate report:
- To use a portable version (if you don’t want to install
Node.json the host), use the following command:
- To generate a snapshot for the particular period use the following command:
In the above example, the
create-snapshotcommand captures the data for a 15-minute time interval when it observes suspicious activity or unusual behavior. If not, it will exit and print the following messageNo performance data available from Performance Insights for the selected time frame. Please choose a time frame with application load or user activity.This may take anywhere from a few seconds to a minute, depending on the time window you have mentioned. Restrict snapshot boundaries to the period of interest to reduce the dilution of the metric average values. The command generates the JSON snapshot file in the snapshot’s subfolder. With the--commentargument, you can associate the comment with the generated snapshot. This comment will be passed to the LLM and can affect its reasoning behavior. - To generate an HTML report with generative AI analysis and recommendations for the captured snapshot, use the following command:
The argument
--ai-analyzesincludes the analysis of the LLM provided by Amazon Bedrock to the HTML report. The report is saved in thereportssubfolder.
You can check which LLM (Region and model ID) is used by the tool in the conf.json file. You can use LLMs in Amazon Bedrock that support the Converse API.
Considerations and recommendations
Because PI Reporter was created to identify changes in instance behavior to minimize the problem detection phase, the recommendation is to generate two snapshots:
- One for the problematic period when the instance behaves unusually
- One for a similar period when the instance was behaving normally
Then use --create-compare-report to generate a compare HTML report, which will help you review the metrics and SQLs that changed significantly.
The generative AI analysis for the compare period report will be more insightful with data from both periods. Both periods must meet the following requirements:
- Both periods must be of identical length
- The problematic snapshot must start at the time where the problem started
- The problematic snapshot must end where the problem ended, or some reasonable time after the start time if the problem still exists, such as 60 minutes
Also consider providing meaningful comments to the snapshots. You can provide hints to the LLM, such as to direct it to some particular areas or your observations as a user.
Generative AI can hallucinate or even provide some wrong assumptions. We tried to minimize this by providing additional context to the LLM that includes useful database engine-specific knowledge. We recommend using generative AI analysis in combination with a database specialist who can evaluate them.
Interpretation of the report
The part of the report that the LLM generates will be in a light blue box at the top of the HTML report. The generative AI section will start with a general summary, with its main findings and root cause of the problem, if any.
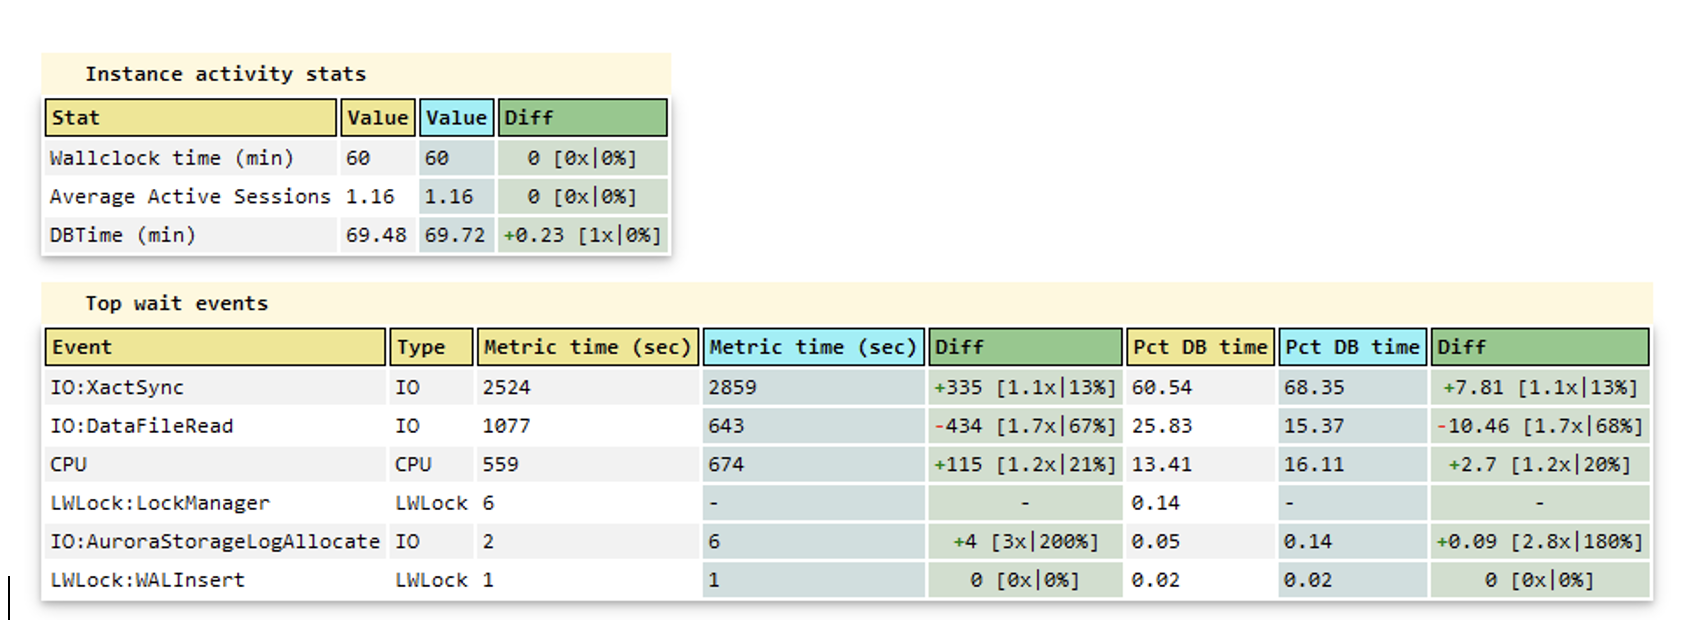
After the general report summary, there will be a summary for each section of the report, like general instance configuration, non-default parameters, wait events, OS metrics, DB metrics, and additional metrics like overall network throughput of the DB instance, which are calculated from other statistics and SQL sections. The report can even include the analysis of the database log files for the snapshot period, if the --include-logfiles argument was specified during snapshot creation.
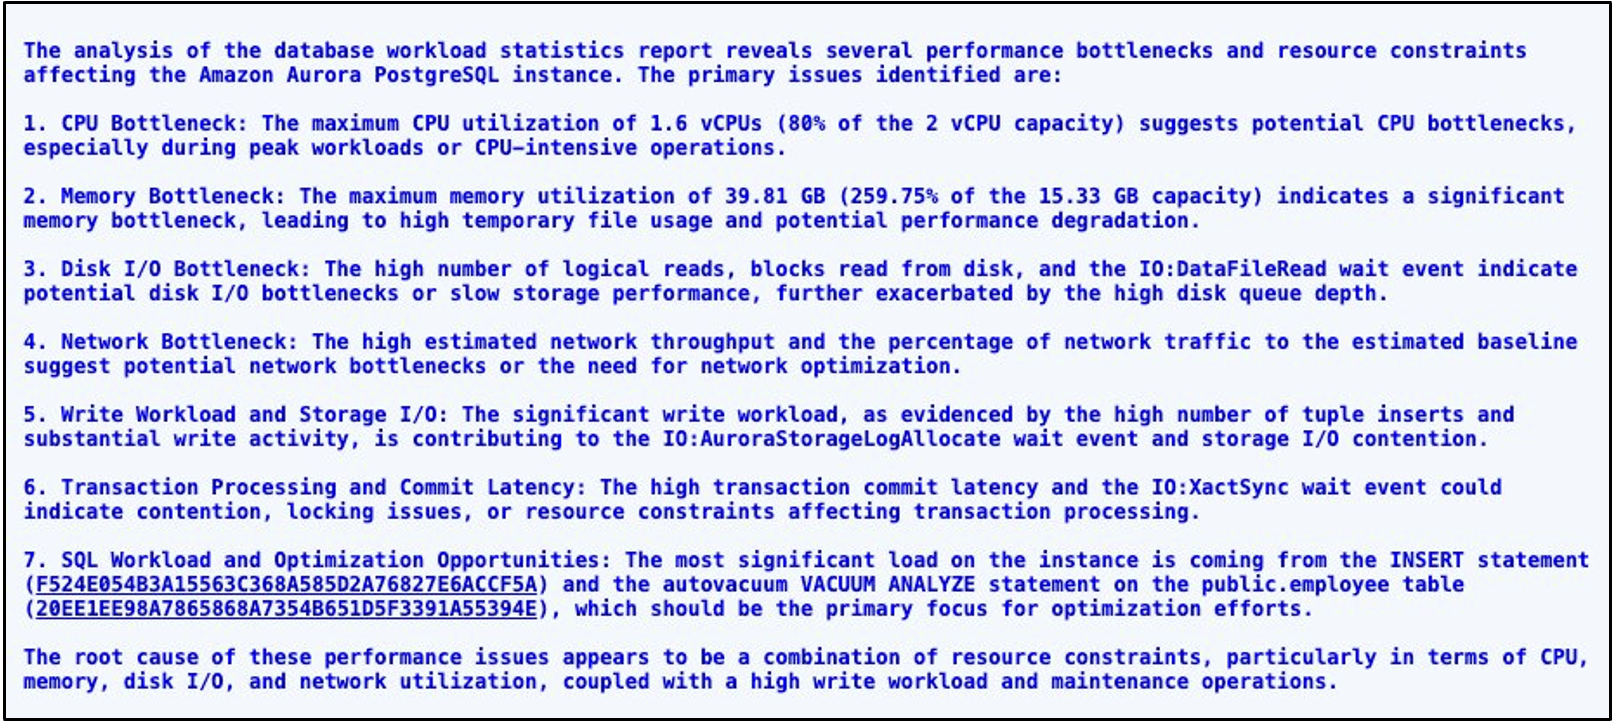
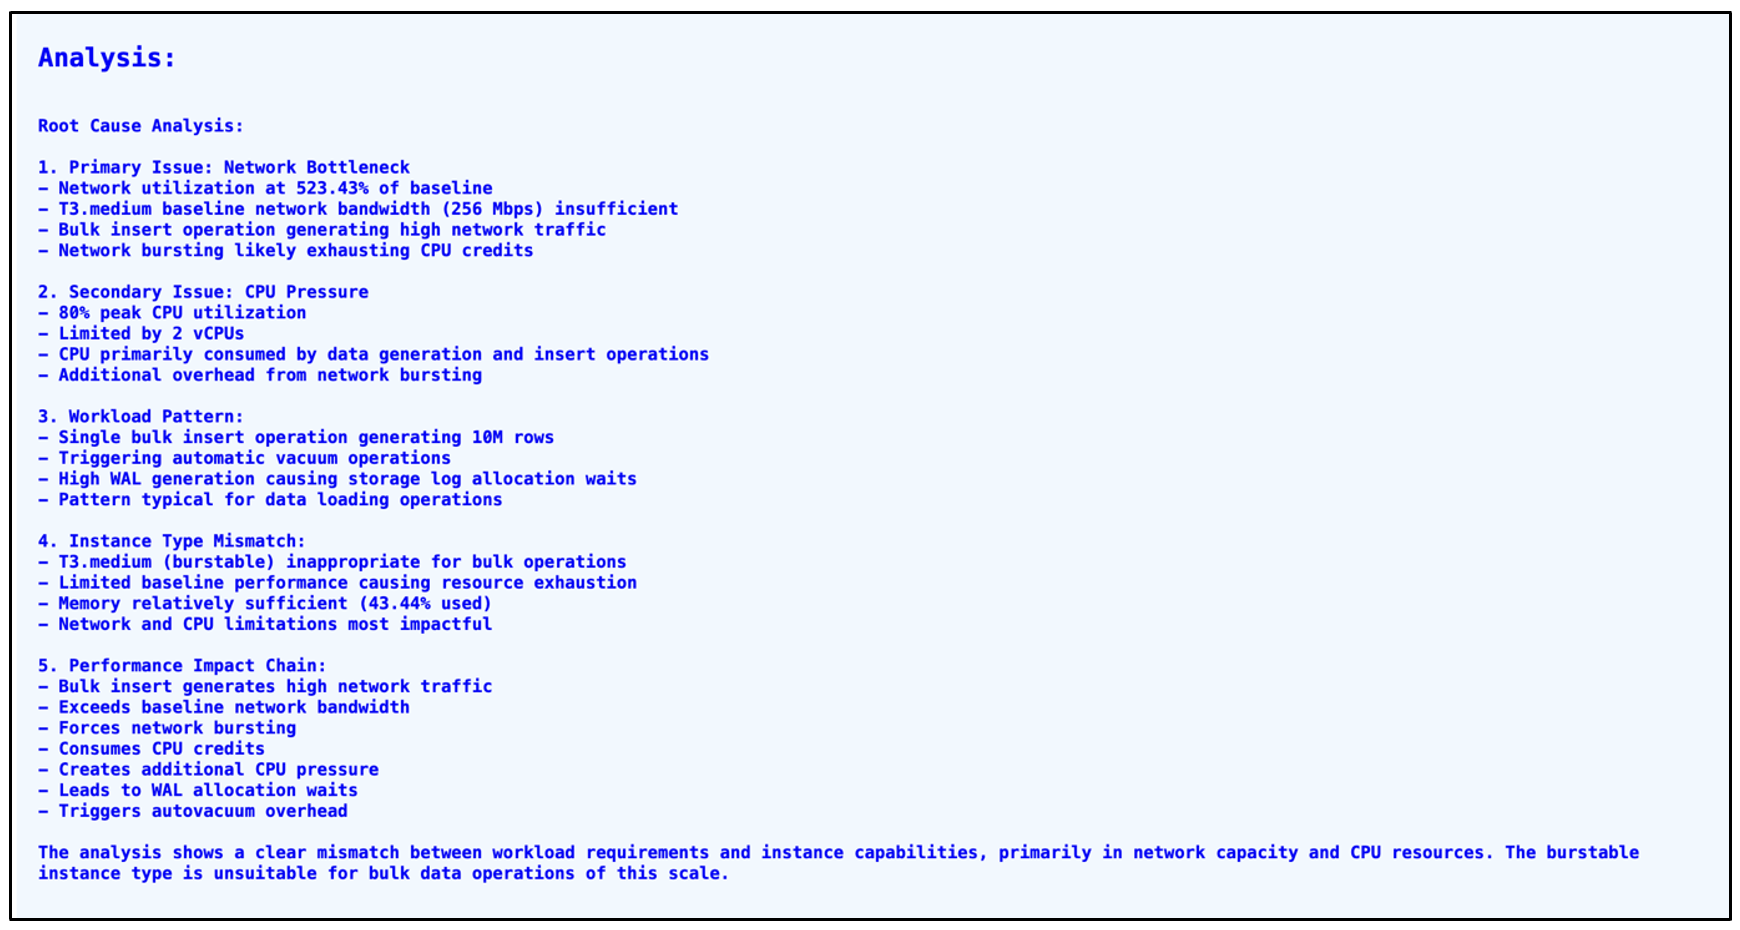
The following screenshot shows the summary section for the generative AI analysis from the report generated for our use case. The summary includes some observations about the very high resource usage, like CPU, memory, and network throughput. We also get information about the workload type that is responsible for the high load (insert statements and other write activity). In addition, we get two SQL statements: an insert and an autovacuum activity on the public.employee table. If you choose the SQL reference ID, you can view the full SQL text. The report also provides the root cause of the performance issues.
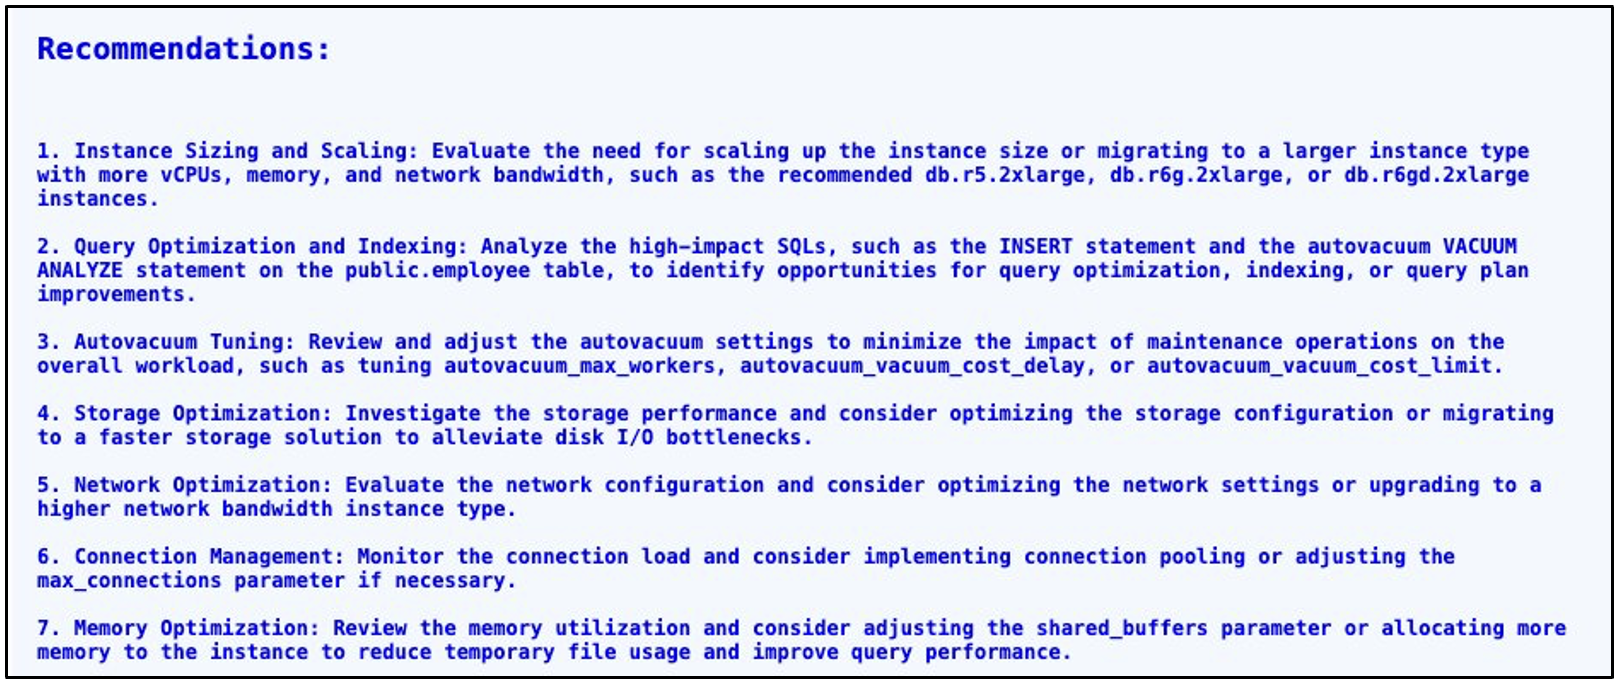
The next section after the general summary is the recommendations section. This section contains the steps the LLM generated to fix the root cause of the problem. In our particular case, the LLM recommends scaling our instance up to one of the recommended instance types that can handle the observed workload. It also recommends checking the workload and adjusting specific autovacuum parameters to decrease its impact on the system.
Reactive use case: Bulk data insert
In this section, we discuss a use case in which we perform a bulk data load on the database and observe the utilization of different resources like CPU, disk, IOPS, and network. Higher utilization of resources might trigger active or passive alerts so we can understand that the resources are being overutilized and therefore need to be upgraded.
Prerequisites for bulk data insert
To explore this use case, you should have a table in which to bulk-insert data. For example, refer to the following code:
Bulk data insert use case
Use the following code to perform a bulk insert:
For this test case, we ran the preceding INSERT statement with a count of 100000000 for large inserts in the employee table. This created 500 MB of data, which was inserted into the table.
Then to create an AI/ML based report using PI Reporter, run the following command:
Here the --start-time and --end-time parameters should correspond to the timestamp before the insert statement execution and after the insert statement finished. Once the report is generated, you can open the HTML report file to read the report. You will see the following recommendations:
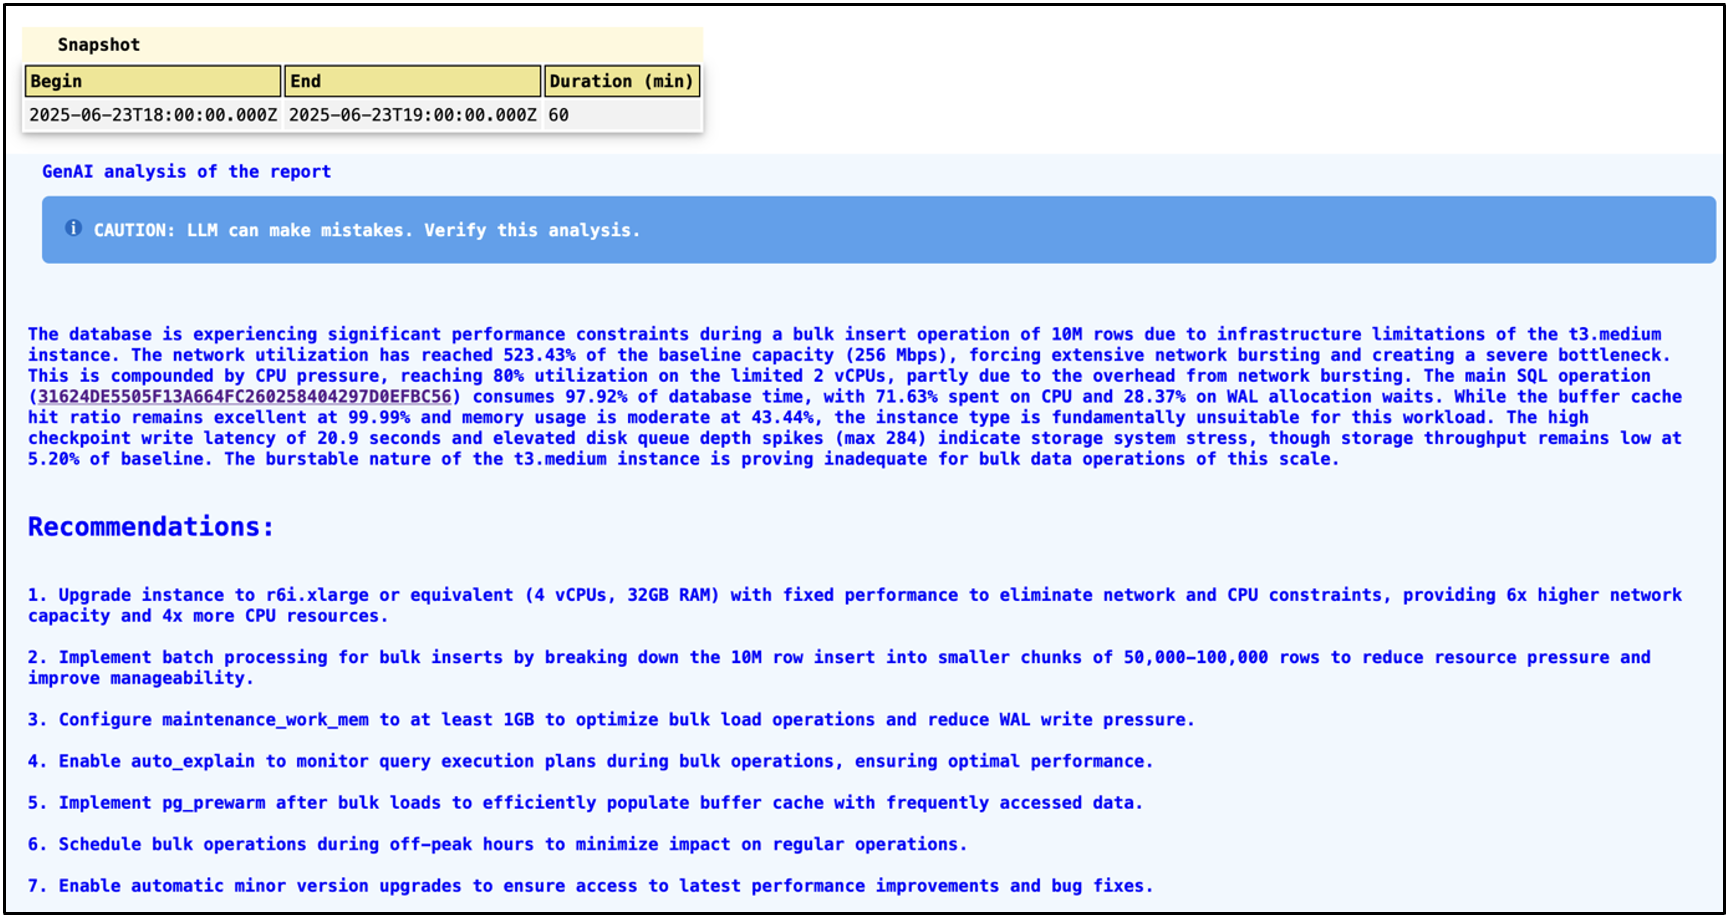
The first part of the report gives you details about the report start and end times with the total duration for which the report is generated. Then it gives you high-level details of the instance and the responsible or primary cause of the elevated resource utilization, such as the insert statement we executed in bulk. It highlighted the query responsible for the performance as well as the need for regular vacuum and checkpoint tuning.
The same information is provided in the Recommendations section above, but with point-by-point details.
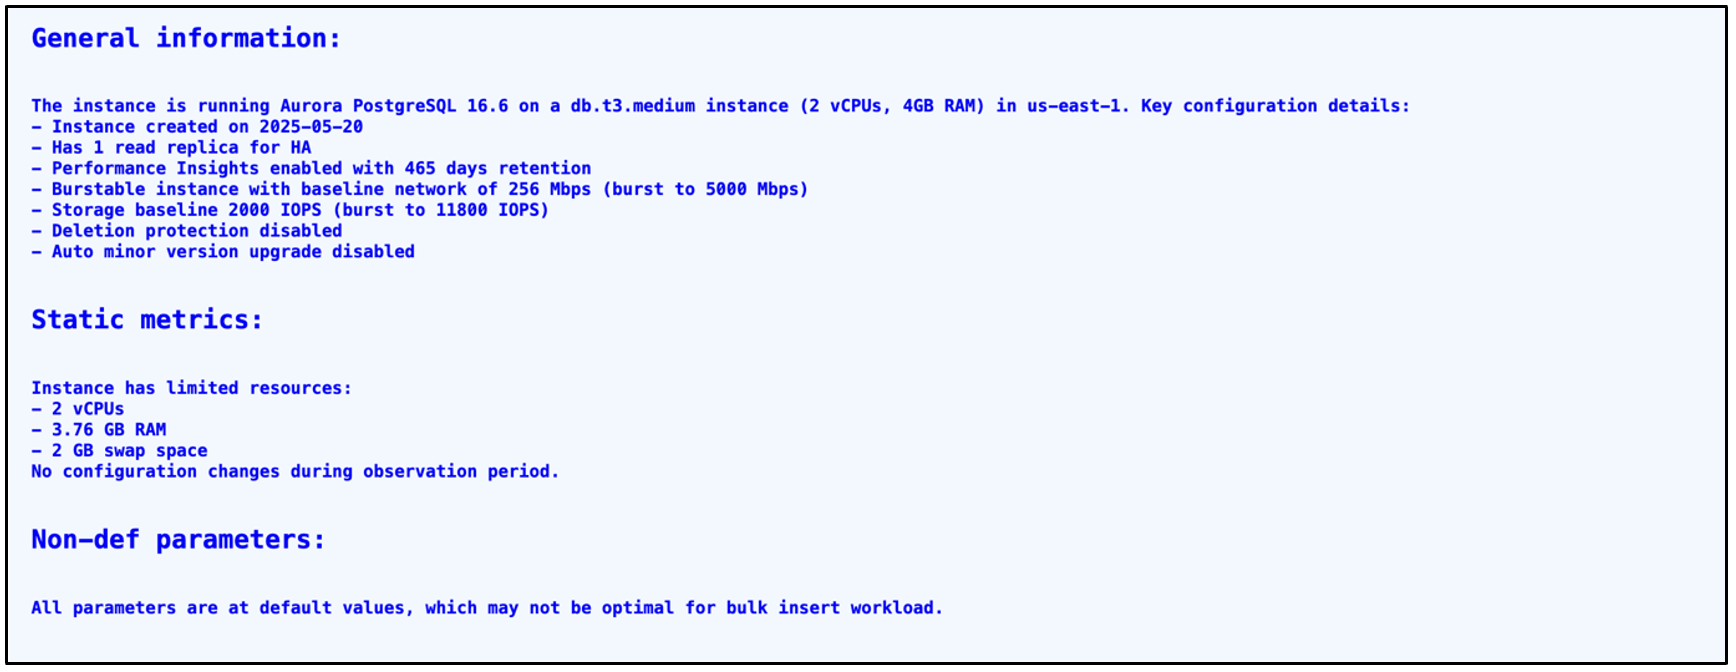
The first part of the recommendations is about the General information of the instance, including the High Availability practices followed, and the backup and monitoring options configured. The next section includes static metrics about memory and CPU usage for the report period. The last section is about non-default parameters if any exist.
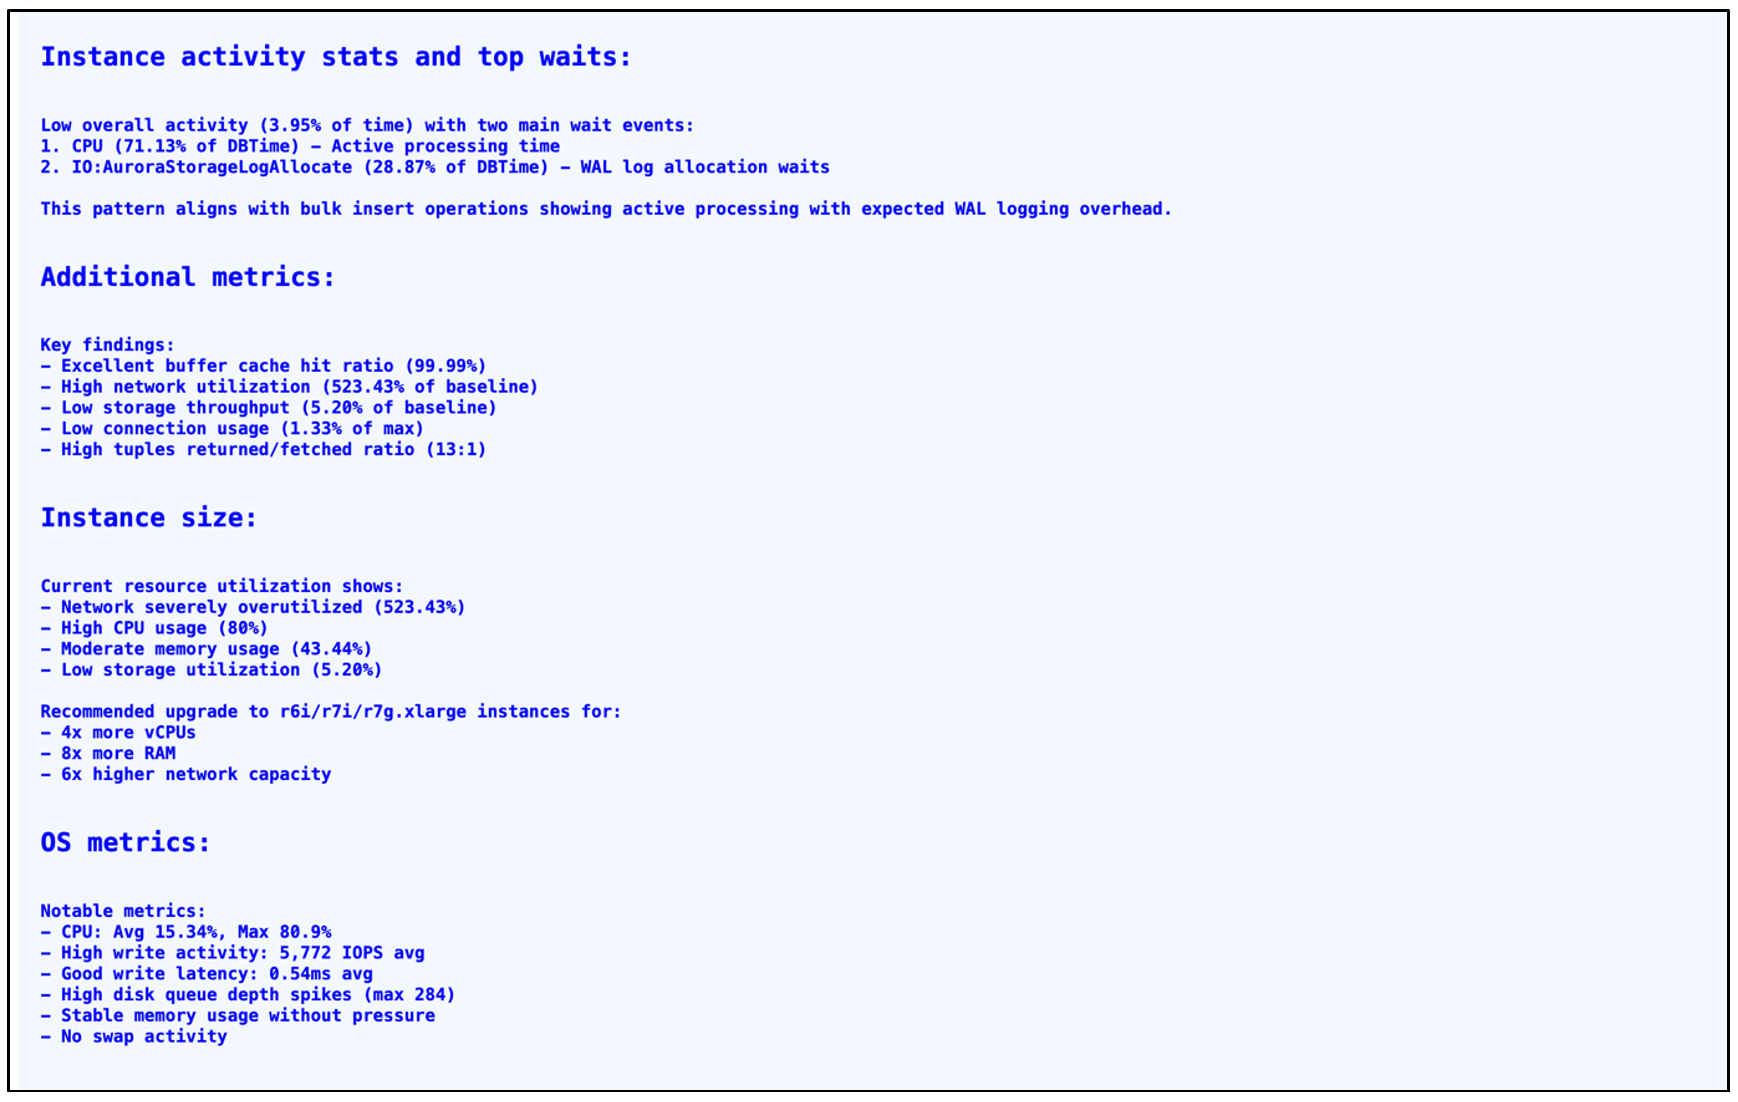
The AI-generated analysis of the report gives insights about resource utilization and IO events. It also talks about the current size of the instance, its utilization and recommended or appropriate types for the instance. It also gives important OS metrics like CPU utilization, Disk IO, Memory, Network and Swap usage. In this case, resources were underutilized, which resulted in a recommendation to choose the right type of instance for cost optimization. While generating these recommendations, make sure you have considered a long enough period while generating the report. Validate the recommendations with database experts before implementing it.
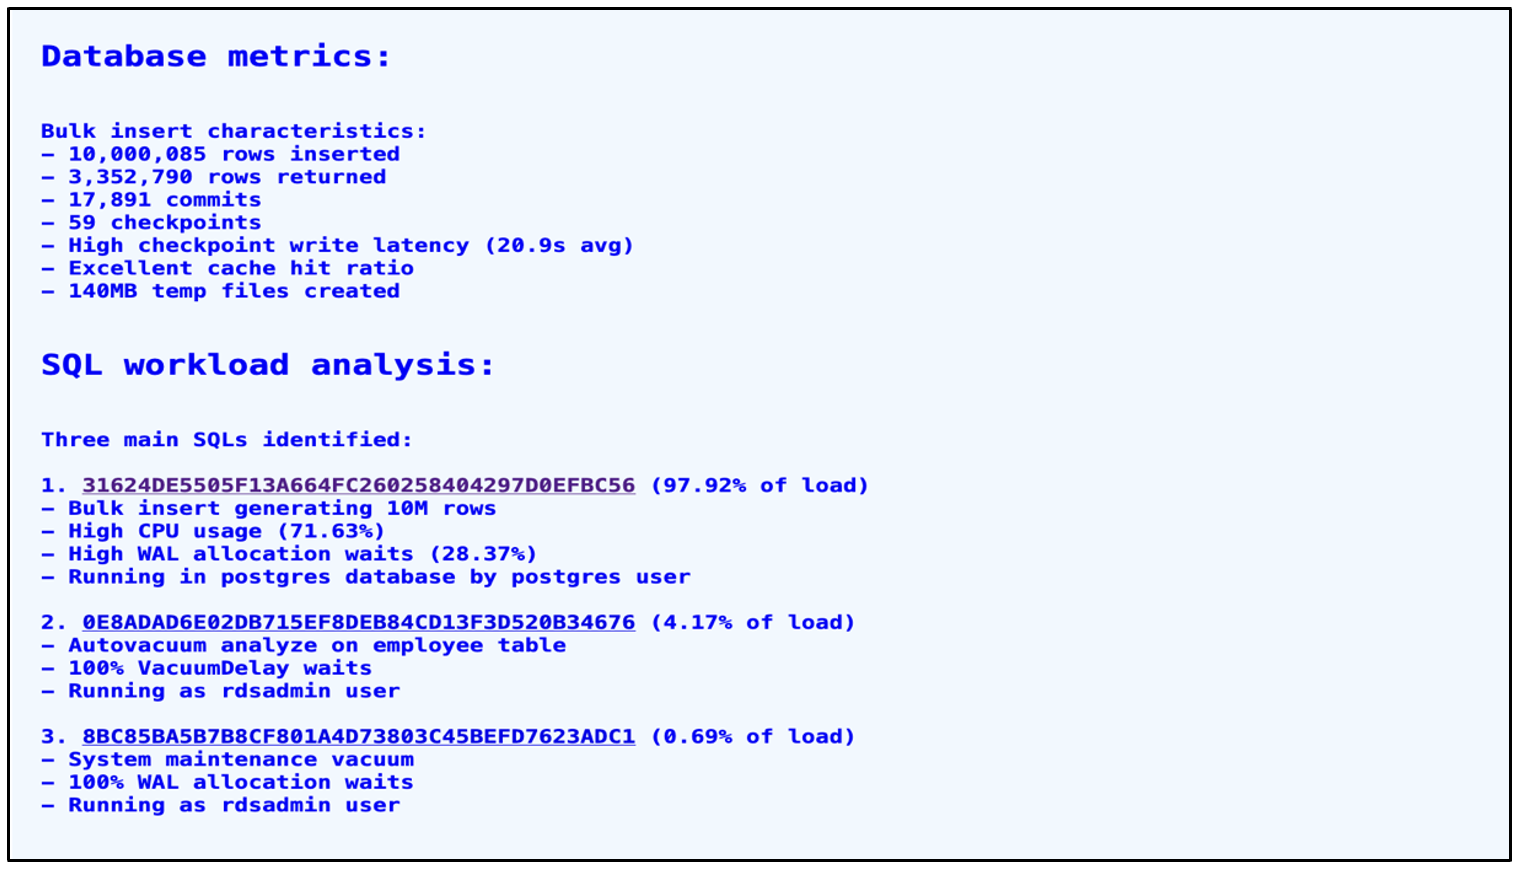
The recommendation in the above image about database metrics is valuable, as it contains suggestions about bulk insert transaction activity, checkpoint tuning, and regular vacuuming.
The final GenAI Analysis gives insights about instance underutilization, but we strongly suggest that you look holistically at the instance performance before performing a down-size, CPU, network bandwidth, efficient caching, disk IO, checkpointing and autovacuum. All these insights are valuable for database performance optimization. The combined recommendations cover query optimization, instance upgrade, deletion protection, backup retention, and the addition of a reader instance for high availability.
Idle in transaction use case
The PI Reporter tool works on data collected using snapshots. Statistics collected in the snapshot that has idle-in-transaction sessions will be reported in the final report. It is recommended to implement idle_in_transaction_session_timeout parameter with a value of 300 seconds (5 minutes) to automatically terminate idle transactions and prevent resource holding.
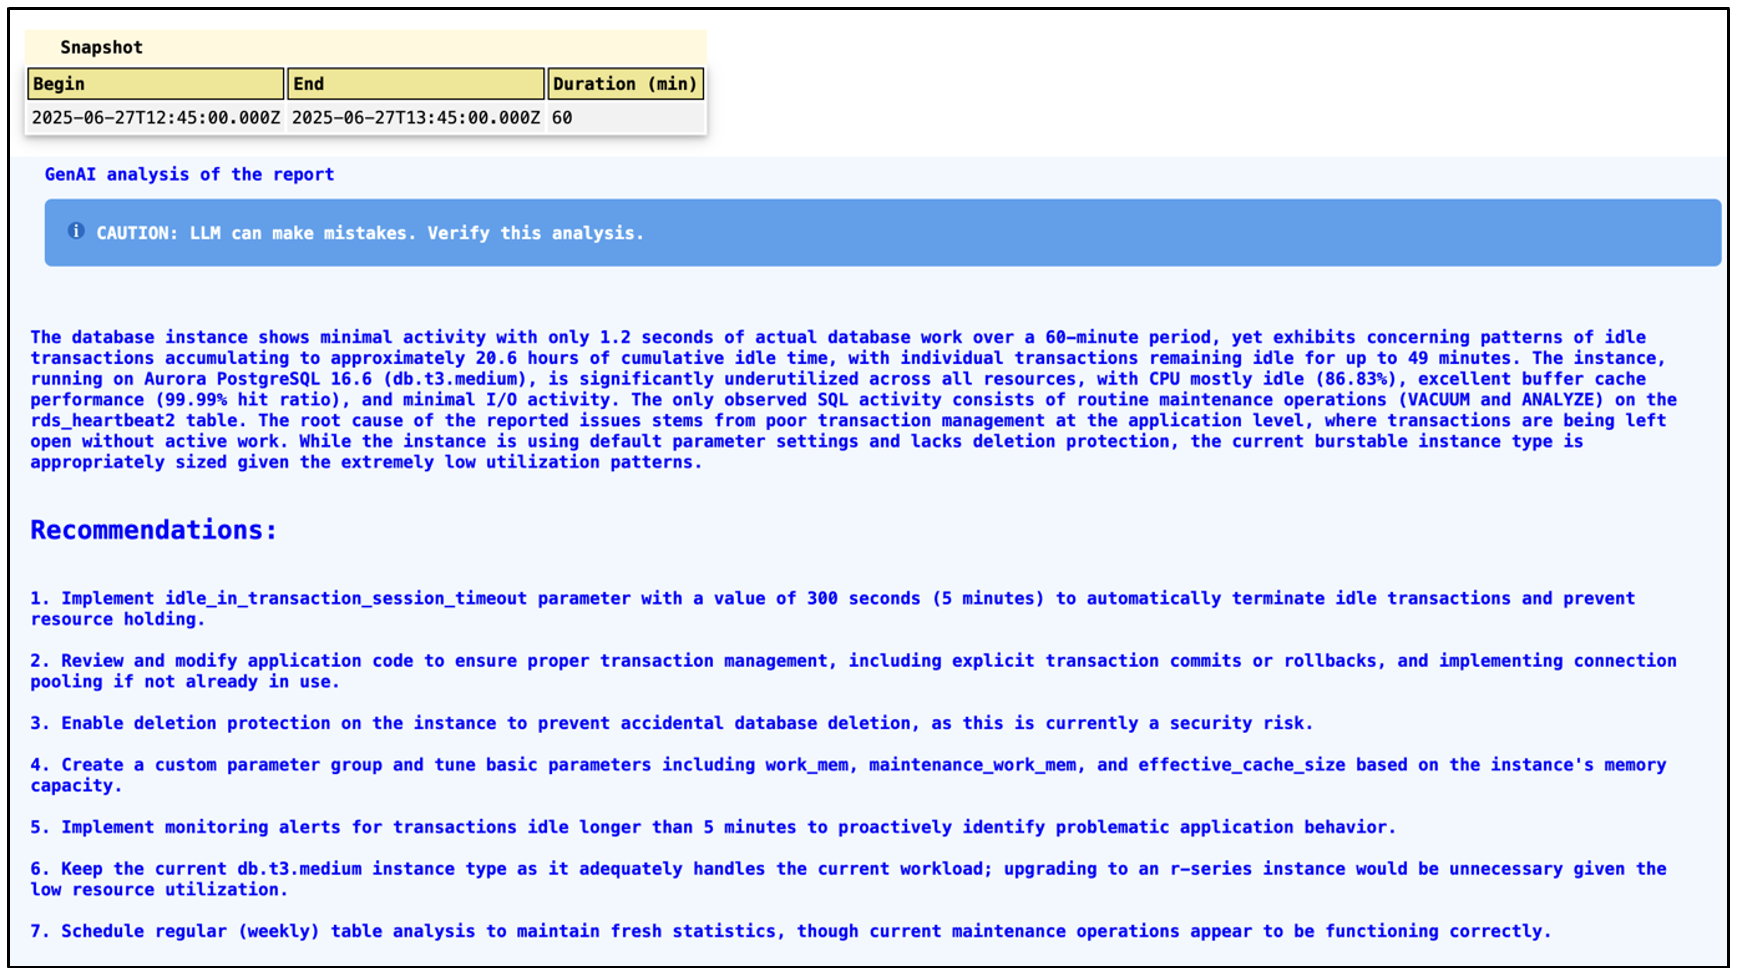
In the above image, PI Reporter clearly identified a session that was idle in transaction and gave a recommendation to set an appropriate value for the related parameter. It also suggested to review application code to find any transaction blocks without a commit or rollback. It has recommended to have monitoring alerts for transactions that are idle for more than 5 minutes so that you can go and terminate such transactions or fix the issue before it starts consuming a large part of your database resources. Amazon CloudWatch Database Insights provides max idle-in-transaction metrics under the Database Telemetry -> Metrics option.
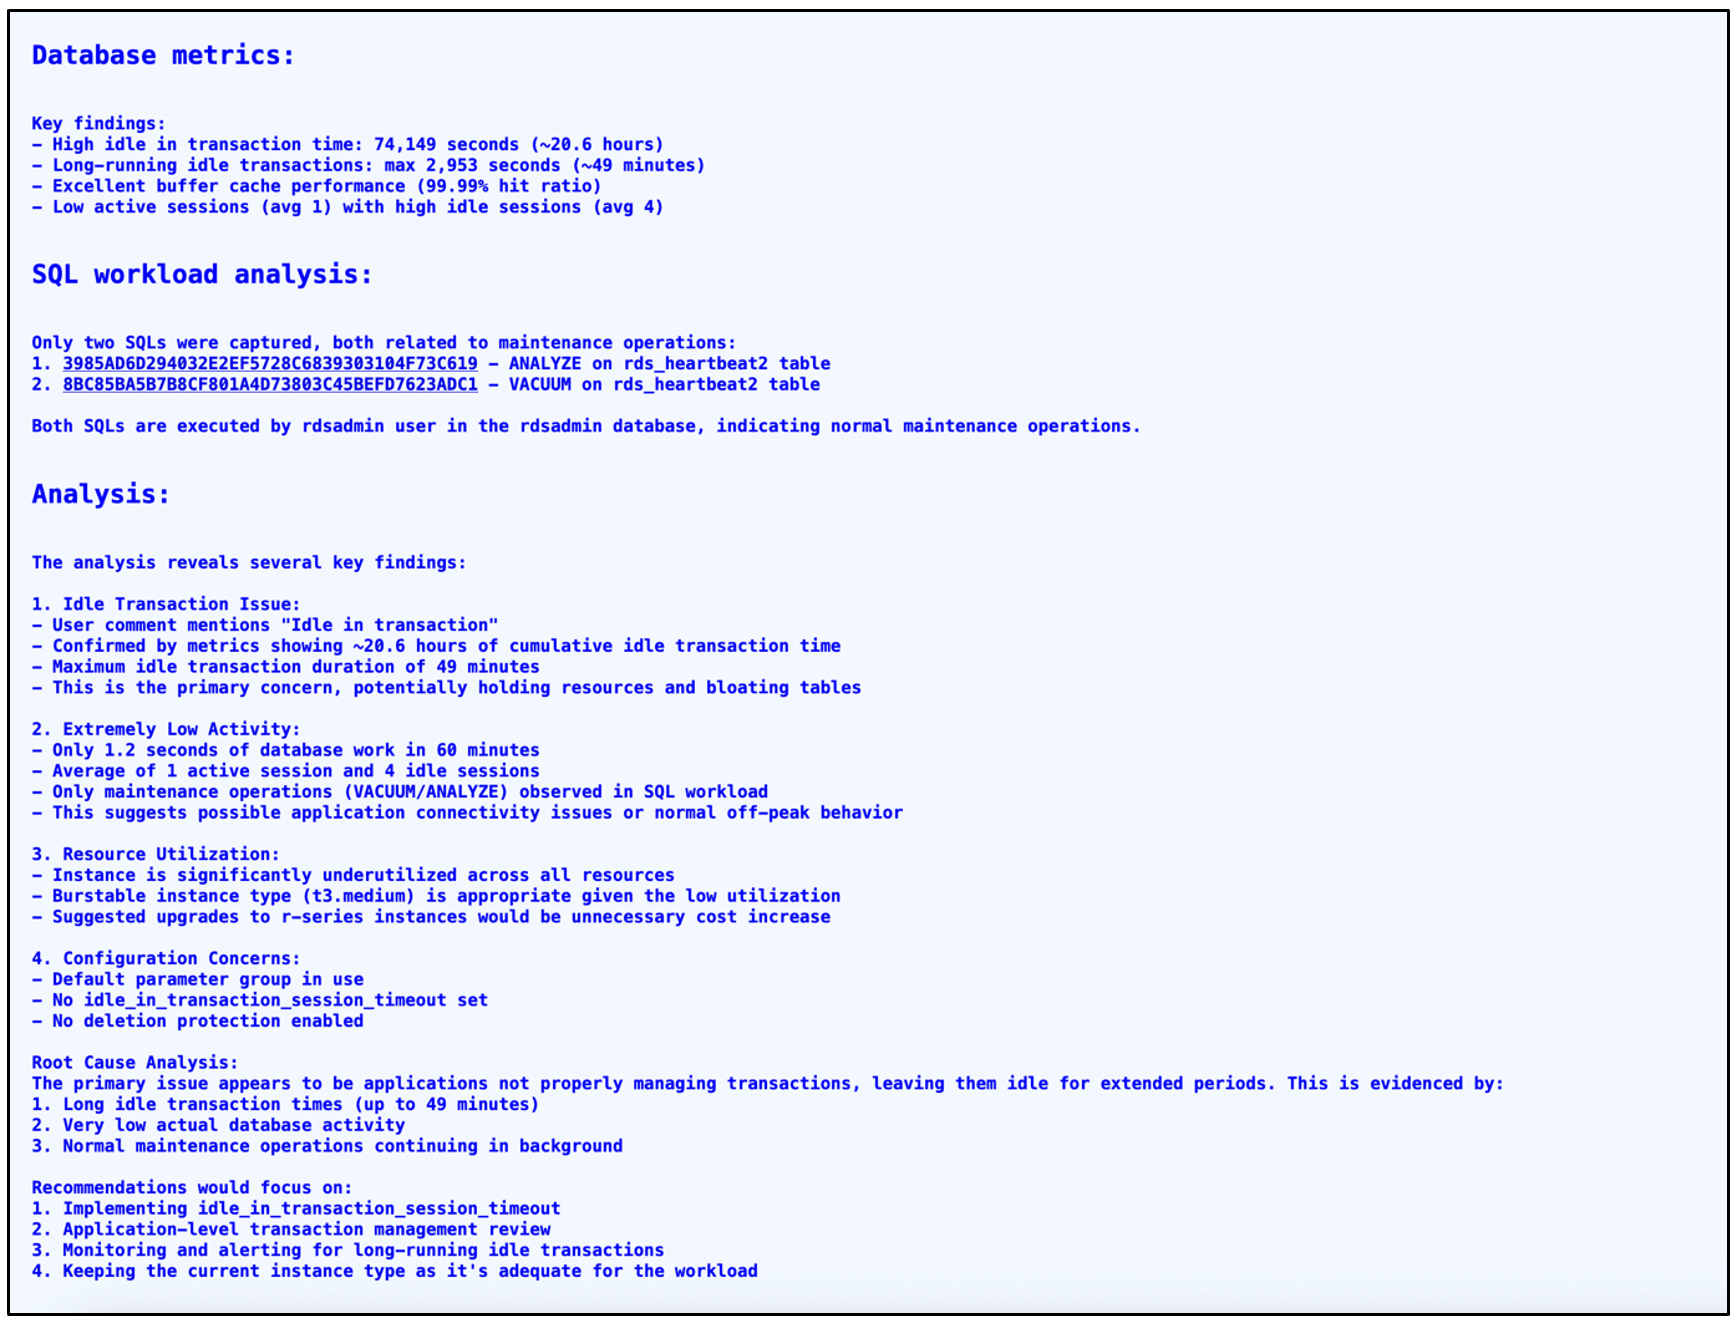
The database metrics section gives us the approximate time that the session has been idle in transaction. The final Analysis section summarizes overall recommendations for the instance for better performance and cost optimization.
Clean up
AWS resources created by Amazon Bedrock can incur costs as long as they are in use. Each time you generate a report that includes a generative AI analysis PI Reporter will output the number of input and output tokens used by the particular invocation. When you no longer need the resources, clean them up by deleting the associated services and scripts. If you created a test environment to follow along with this post, clean up the resources when you’re done using them.
Feature summary
The following table provides a high-level feature summary for the PI Reporter tool.
| Parameter/Feature | PI Reporter |
| Cloud-agnostic | No |
| On-premises database | No |
| Configuration recommendation | Yes |
| Database health | Yes |
| Index recommendation | Yes |
| Inefficient SQLs | Yes |
| Autovacuum | Yes |
| Performance charts | No |
| Agent type | No |
| Production-ready | Yes |
| Cost | Apache-2.0 license Costs associated with infrastructure and Amazon Bedrock |
*Factors such as the deployment options, the size of your database fleet, and multi-year contracts have a large influence on the final cost.
Conclusion
In this post, we discussed the PI Reporter tool’s monitoring capabilities and possible use cases. PI Reporter can collect useful information in seconds and store it in JSON snapshots, which can be used to generate HTML reports or be stored for future investigations. It’s a useful tool for troubleshooting and understanding DB instance health. You can use it in conjunction with Amazon Bedrock hosted LLMs to analyze the available metrics and SQLs and let generative AI summarize the findings, detect root causes of the problem, and provide recommendations.
The PI Reporter tool discussed in this article has its own features that may or may not fit your workload and therefore should be carefully tested and evaluated. We highly recommend testing these tools in a non-production environment before running them in production.
We value your feedback. Share any questions or suggestions in the comments section.