AWS Database Blog
Resilience testing on Amazon ElastiCache with AWS Fault Injection Service
Amazon ElastiCache is a fully managed, in-memory caching service that supports Valkey, Memcached, and Redis OSS, delivering 99.99% availability while accelerating application performance in real-time at cost-effective pricing. By providing sub-millisecond response times for frequently accessed data, it is commonly used for database query caching, managing web session states, powering real-time leaderboards for gaming, and so on.
Many applications are built with the assumption that the cache will always be available. Without resilience testing, applications often experience issues when they lose access to Amazon ElastiCache. You might discover your app crashes instead of gracefully falling back to the database, but only during a production incident when it’s too late. So, you need to build to prepare for the event that the cache is unavailable and then test that your application handles those failure cases as you expect. In this post, we guide you on how to run resilience tests on Amazon ElastiCache using AWS Fault Injection Service and how you can use it to strengthen resilience strategy of your application.
Solution Overview
In our solution, we are using AWS Fault Injection Service (AWS FIS) which is a fully managed resilience testing service to conduct controlled fault injection experiments on AWS workloads. Rather than relying on custom scripts or third-party tools that require maintenance and elevated permissions, AWS FIS provides a secure, scalable, and highly available platform for testing system resilience.
AWS Fault Injection Service operates on the practice of deliberately introducing disruptions into your systems to observe how they respond under stress. These experiments help you identify weaknesses, validate your assumptions about system behavior, and build confidence in your application’s ability to withstand real-world failures. With AWS FIS, you can conduct resilience experiments in your test or production environments with confidence, testing realistic scenarios like Amazon ElastiCache node failures during peak traffic periods to confirm your failover mechanisms work when it matters most.
In this post, you’ll learn how to set up an ElastiCache cluster for resilience testing, create an AWS FIS experiment template, execute a controlled failover experiment, and monitor and interpret the results.
Prerequisites
Before implementing this solution, ensure you have:
- An active AWS account
- A non-production environment for testing
- Basic understanding of Amazon ElastiCache service
The solution involves the creation and utilization of new AWS resources. Therefore, it will incur costs on your account. Refer to AWS Pricing for more information.
We strongly encourage that you set this up in a non-production environment and run end-to-end validations before implementing this solution in your production environment.
Methodology
This experiment shows how Amazon ElastiCache maintains high availability during node failures using automated failover. We’ll cause a node failure in an ElastiCache for Valkey cluster with Multi-AZ enabled and cluster mode disabled to verify that an application can recover without manual intervention. During failover the follow actions are performed:
- Failure detection: ElastiCache detects the primary node failure.
- Replica promotion: The replica with the lowest replication lag is promoted to primary.
- DNS update: The primary endpoint automatically points to the new primary, so the application continues using the same connection string.
- Node recovery: The failed node rejoins as a read replica once restored.
We’re using a cluster mode disabled configuration because it makes the failover process easier to observe in the console — you can clearly see individual node roles change from primary to replica. However, these same testing principles apply to cluster mode enabled deployments, where the configuration endpoint automatically manages routing across all shards. This experiment isn’t supported on ElastiCache Serverless, which handles Multi-AZ failover behind a managed proxy so applications experience no disruption. Refer to the documentation on how ElastiCache Serverless works.
A resilient application should see only brief connection interruptions, automatically reconnect, and temporarily fall back to the database without overwhelming it.
Walkthrough
Creating the Valkey cluster
You can use an existing ElastiCache for Valkey cluster mode disabled cluster or you can launch a new cluster by following the steps in the Creating a Valkey (cluster mode disabled) cluster (Console). You can use the general-purpose burstable T4g or T3-Standard micro cache nodes in Amazon ElastiCache to incur small costs during this test.
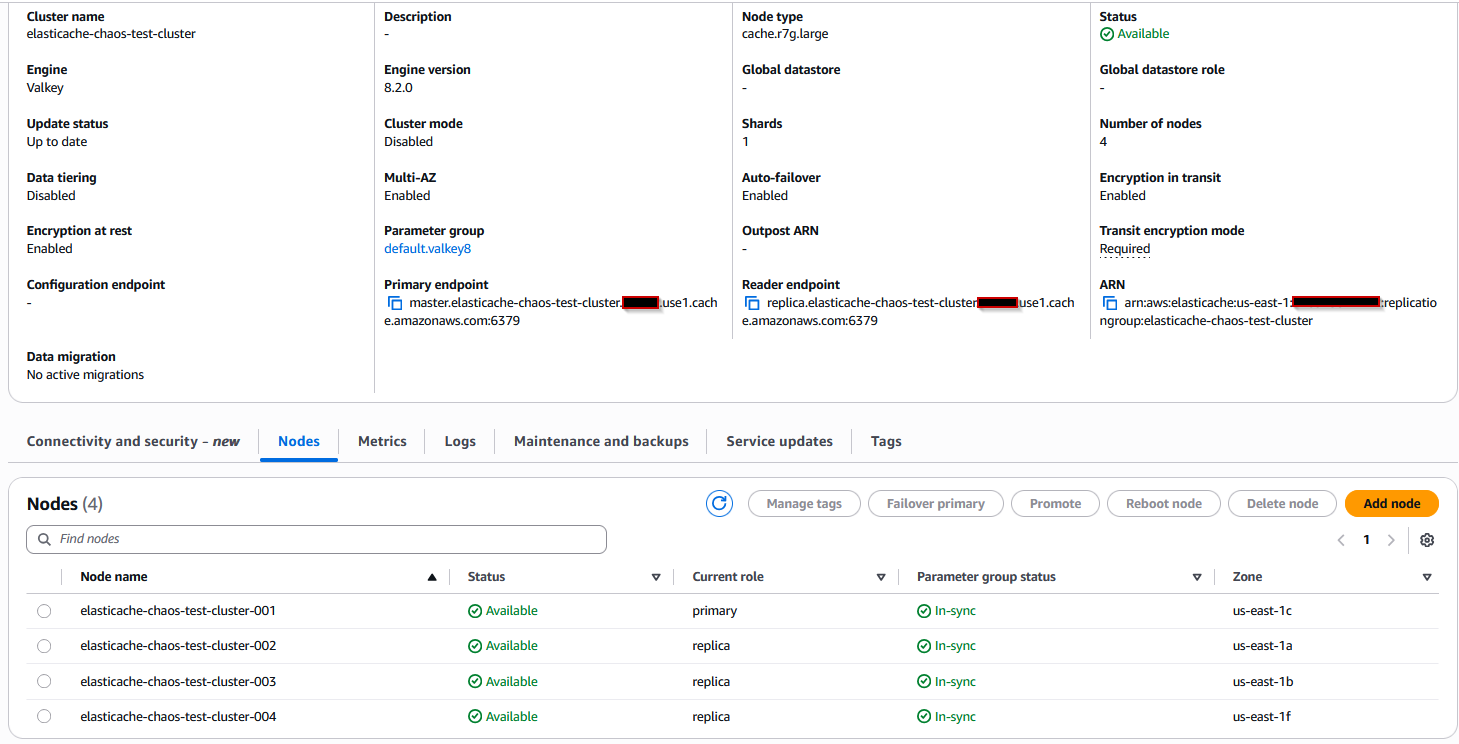
The following screenshot shows a cluster with a primary node and three replica nodes:
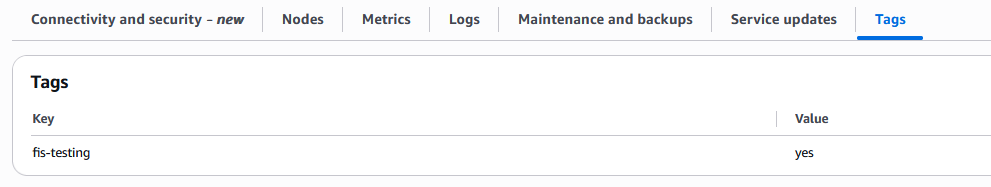
Also create a tag for the cluster with key name and value. In the following screenshot we have used key as fis-testing and value as yes. We will use this tag when editing the target details in the AWS FIS experiment template.
Setting up the AWS FIS template
When your Amazon ElastiCache cluster is ready and available, you’ll create an AWS FIS template as below that defines what failure to inject and which resources to target .
To use AWS FIS, you run experiments on your AWS resources to test your theory of how an application or system will perform under fault conditions. To run experiments, you first create an experiment template. For more information on the template, refer to the documentation.
- Open the AWS FIS console.
- In the navigation pane, choose Experiment templates.
- Choose Create experiment template.
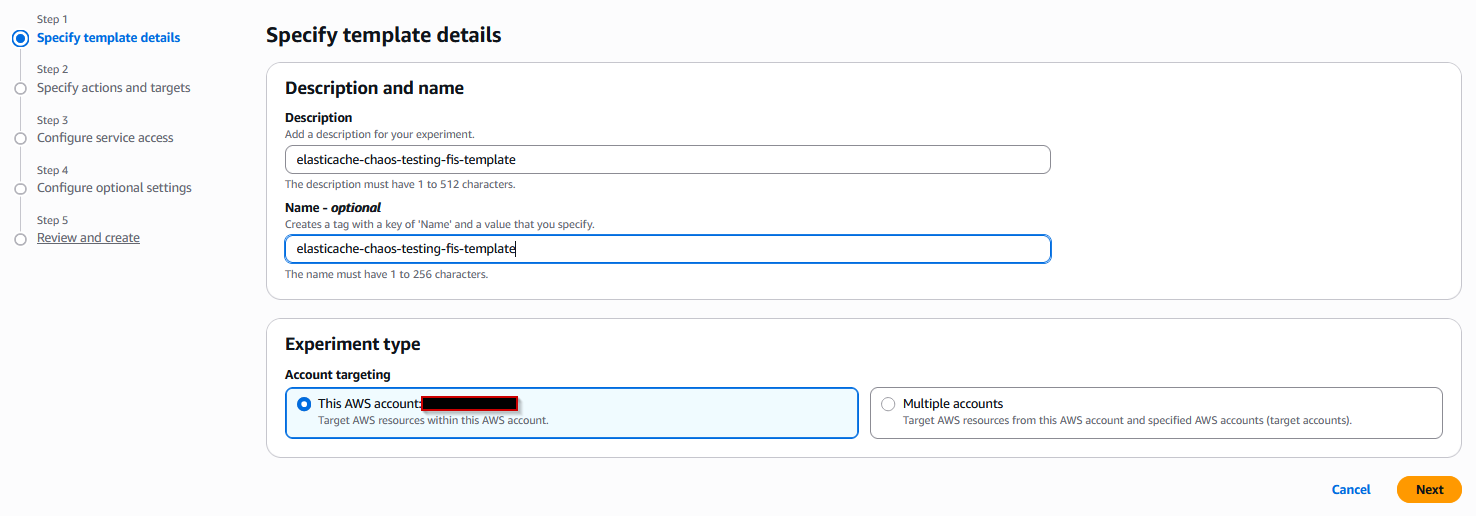
- For first step, Specify template details, enter a relevant description and name in the template details and then keep the Account targeting with this account as it is.
- Choose Next.
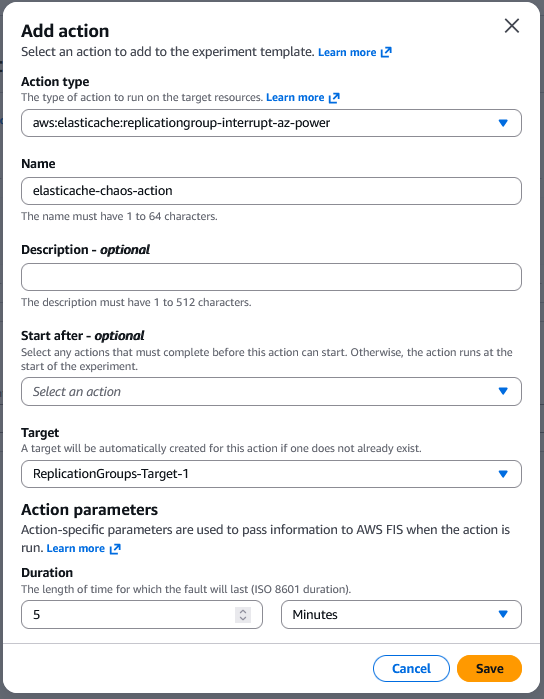
- Choose Add Action.
- In the Action Type, select
aws:elasticache:replicationgroup-interrupt-az-powerto interrupt power to nodes in the specified Availability Zone for target ElastiCache replication groups with Multi-AZ enabled. - Give a relevant Name as required.
- For Target, choose a target that you defined in the Targets section. If you haven’t defined a target for this action yet, AWS FIS creates a new target for you.
- For Action parameters, specify the parameters for the action. Keep the duration as per your test requirement. This is the length of time for which the fault action will last in the targeted node/nodes.
- Choose Save.
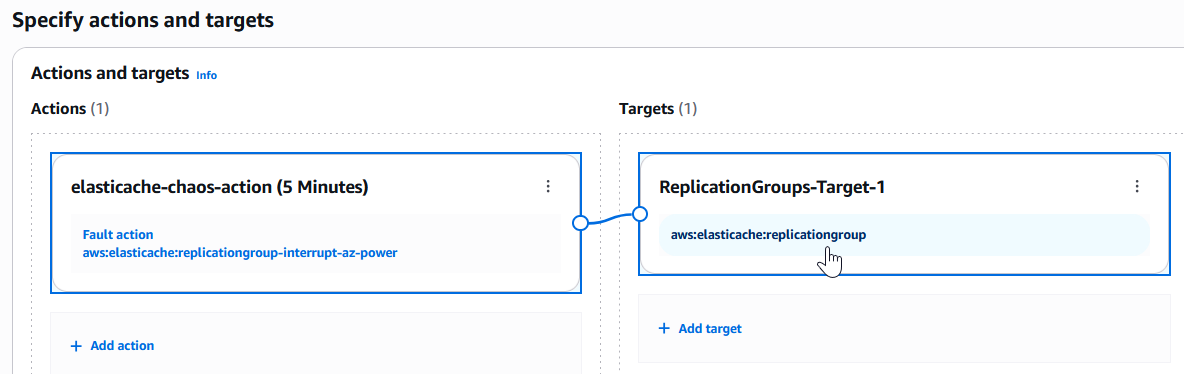
- After saving the action, the Target will be automatically created as shown in the following screenshot. Choose
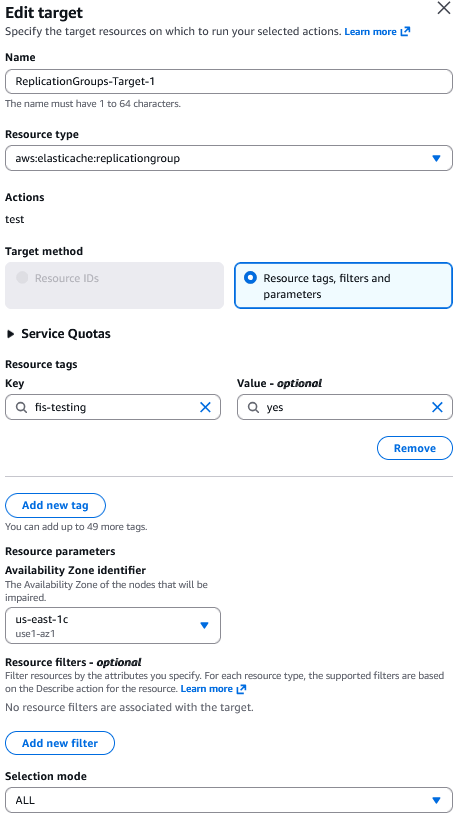
aws:elasticache:replicationgroupto open the Edit Target page. - In the Target method, you will see Resource tags, filters and parameters radio-button already selected. To target Amazon ElastiCache, we can only specify tags in the
resourceTagselement. - Choose Add new tag button to add the resource tag. We have used the key as
fis-testingand value asyes. - In the Availability Zone identifier dropdown, you need to select the Availability Zone of the node that you want to be impaired in this testing. Select the Availability Zone containing your primary node so that once that AZ is impacted, it will trigger a failover.
- For Selection mode, choose the default option of ALL to runs on all identified targets.
- Choose Save.
- Choose Next.
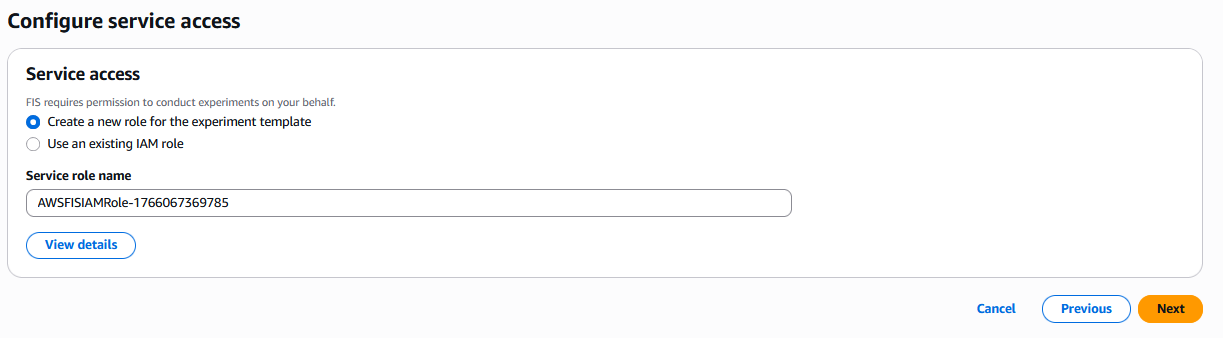
- In the Service access section, keep the default selection to Create a new role for the experiment template. Copy the service role name shown on your console, as we will use it later. Once this step is completed, it creates an IAM role with the name as shown in your console.
- Choose Next.
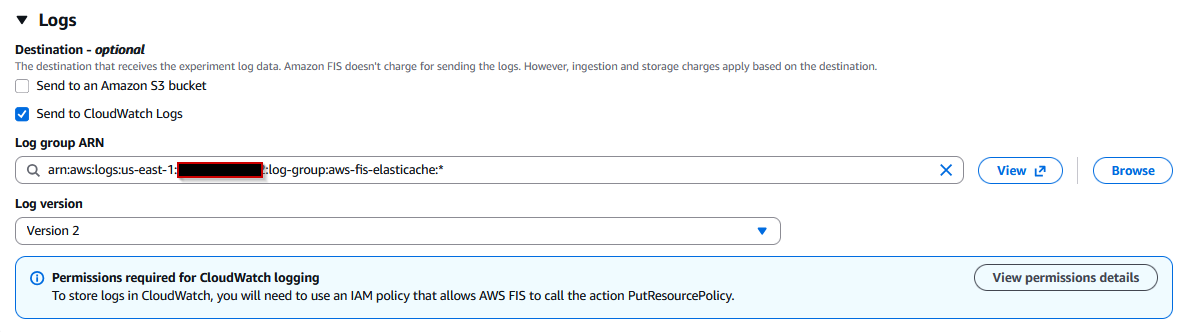
- Select the Send to CloudWatch Logs checkbox.
- Logging helps you correlate experiment timing with application behavior, so let’s set up Amazon CloudWatch integration. To do that we need to create a Log Group in Cloudwatch first. To create a log group, follow the steps as per the CloudWatch documentation.
- On the AWS FIS tab of template creation, choose Browse option in the Logs section, then use the Refresh button at the right side.
- Search for the log group name that you have created. Choose Log version as Version 2. In the following screenshot, we have used the log group name as
aws-fis-elasticache.
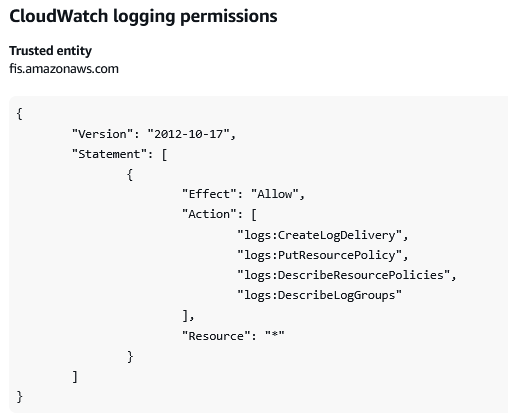
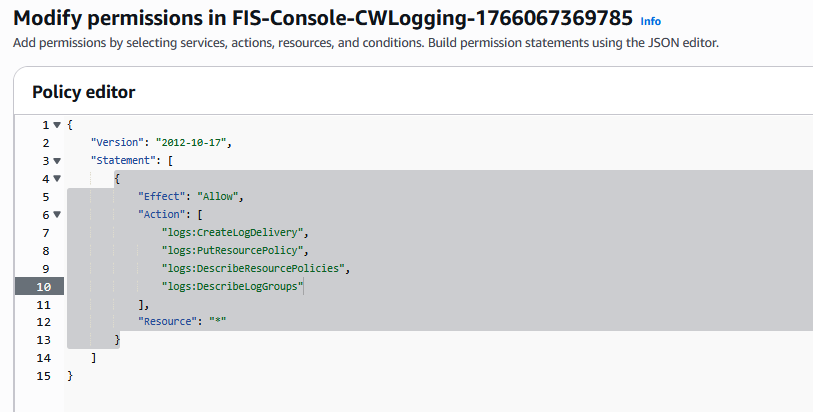
- Choose the View Permission details button and copy the permission policy required for Amazon CloudWatch logging and paste in a notepad. We will use it in later section to update the role that is created in step 19.
- Choose Next.
- Review the template and choose Create experiment template.
Before we set up Actions and Targets components, we should know what they are used for. An action is a fault injection activity that is performed on a target. AWS FIS provides actions for various AWS services. You add actions to an experiment template, which AWS FIS uses to run the experiment. Targets are AWS resources on which AWS FIS performs actions during an experiment. You define targets when you create an experiment template, and you can use them with multiple actions. AWS FIS identifies the targets before starting any action and uses them throughout the experiment.
Only one Availability Zone per replication group can be impacted at a time. When a primary node is targeted, the corresponding read replica with the least replication lag is promoted to primary. Read replica replacements in the specified Availability Zone are blocked for the duration of this action, which means that target Replication Groups operate with reduced capacity. For more information refer to the documentation.
Editing the AWS IAM role for Amazon Cloudwatch
Once the template has been created, we need to edit the IAM role we created so that it does have the necessary permission required for CloudWatch logging. Open the IAM console, choose the IAM role and under this role, you will see two policies attached. Edit the policy created with name FIS-Console-CWLogging-XXXX and copy the previous policy JSON document, then save the policy.
Running the AWS FIS Experiment
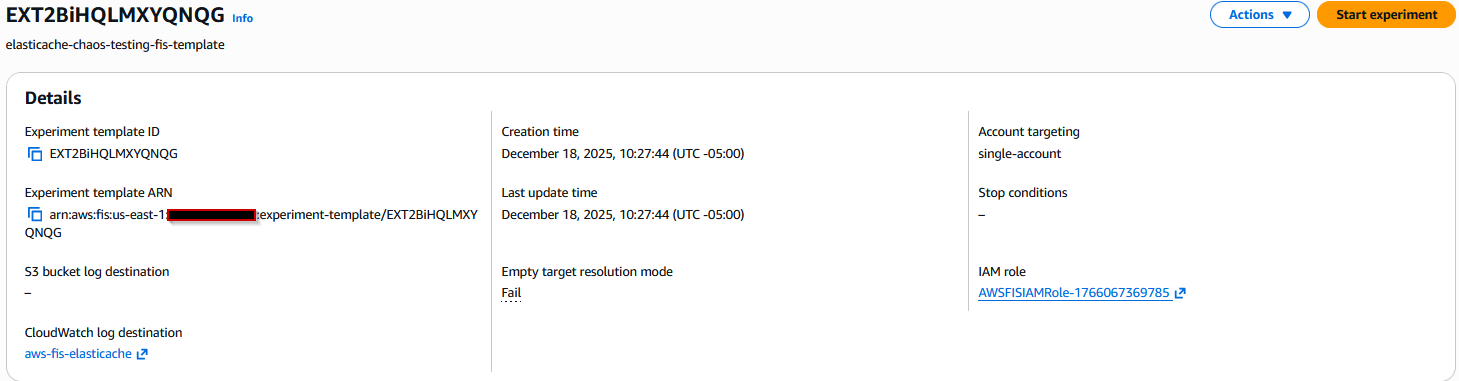
In the AWS FIS console page, choose Start experiment at the top right of the template created in step 2 and continue with the start operation.
Monitoring and checking the logs
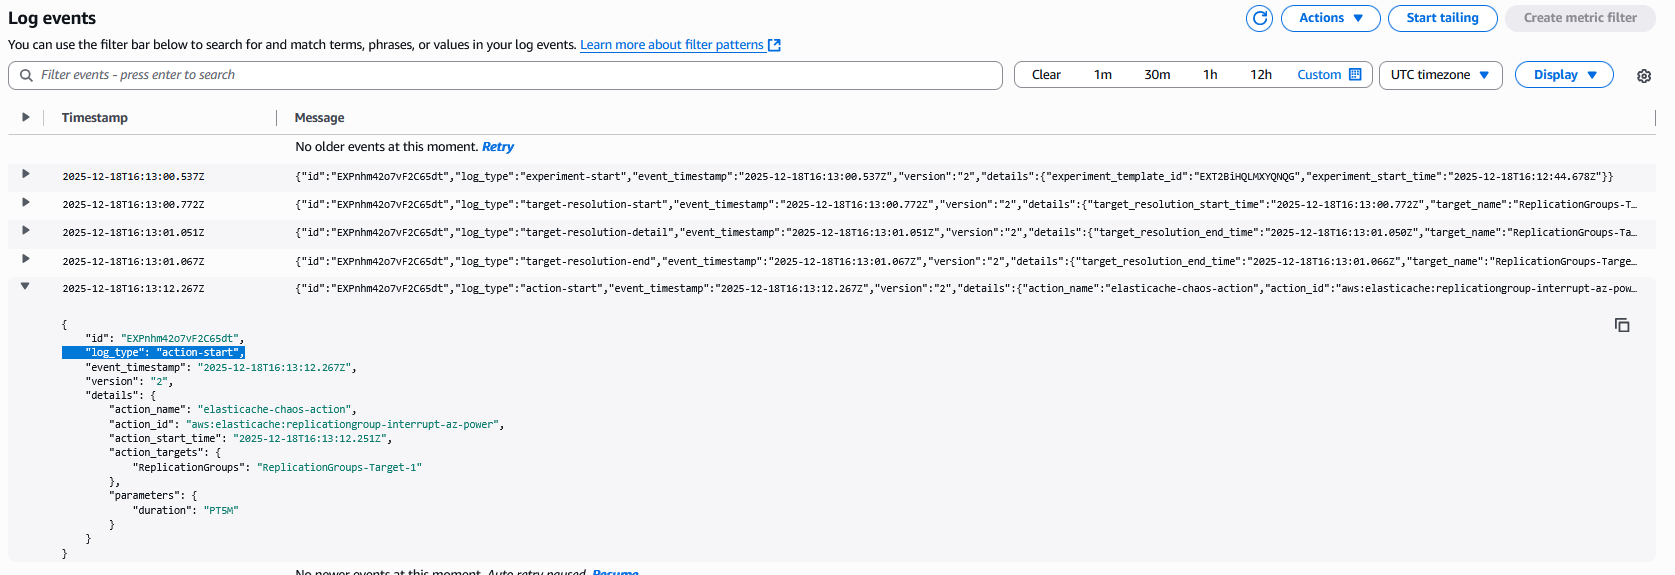
You will see the state of the experiment will go into Running state. Choose the CloudWatch log destination link to open the cloudwatch logs in the log group aws-fis-elasticache that we have created earlier. In the log events, you will see one log entry for log_type:action-start. This is the actual time when the experiment is in action or being effective.
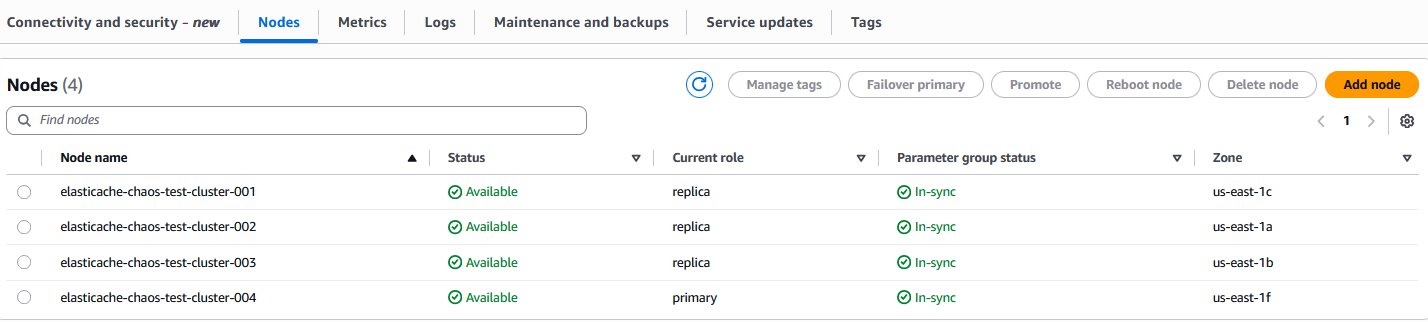
Now navigate to the Amazon ElastiCache console, you will see the status of the cluster and the nodes will be in Modifying state as shown below:
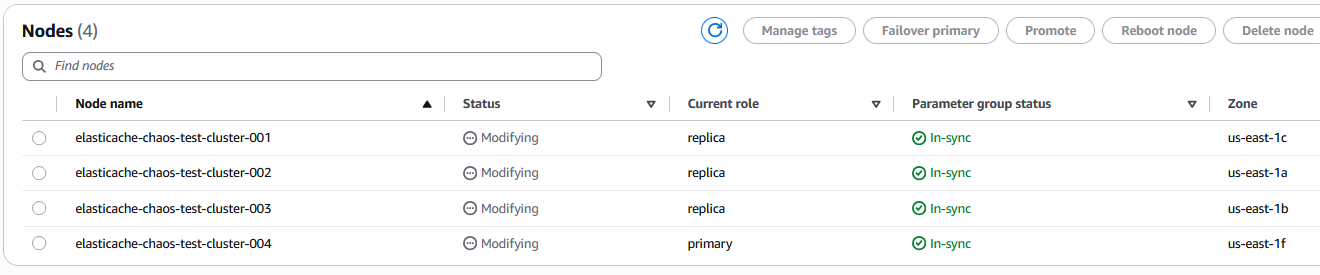
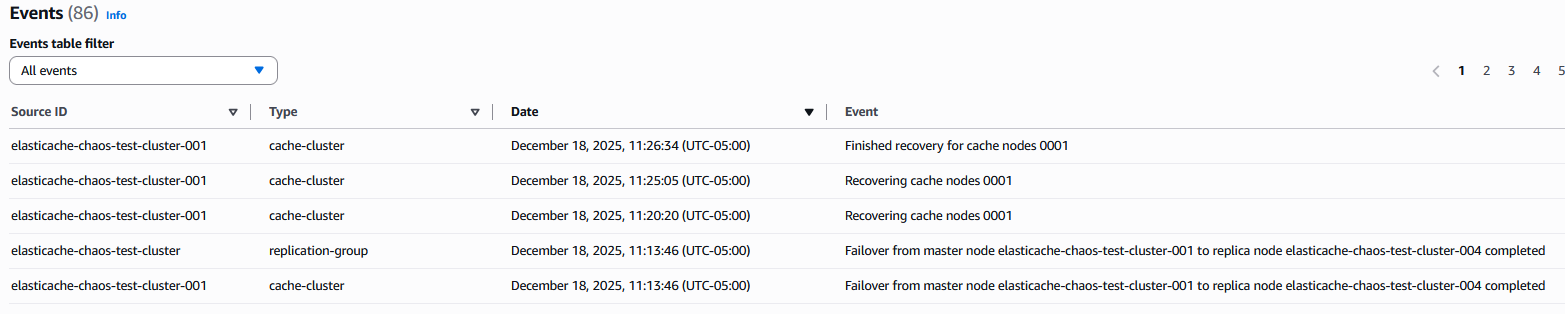
You will also notice that the role of the node elasticache-chaos-test-cluster-001 is changed from primary to replica. This is also evident from the events published in Amazon ElastiCache as shown below:
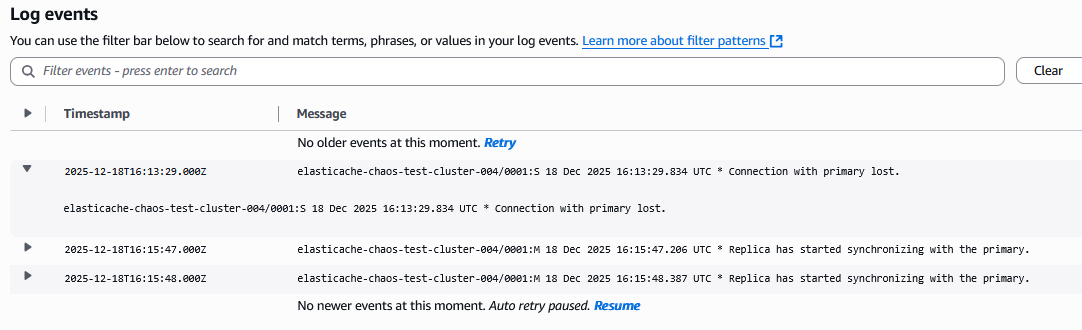
The failover was completed within a few seconds after the action-start time as per the AWS FIS logs in the log group aws-fis-elasticache. If you have enabled the logs of the Amazon ElastiCache cluster, you will see the logs of other nodes showing connection issue with the primary node as well.
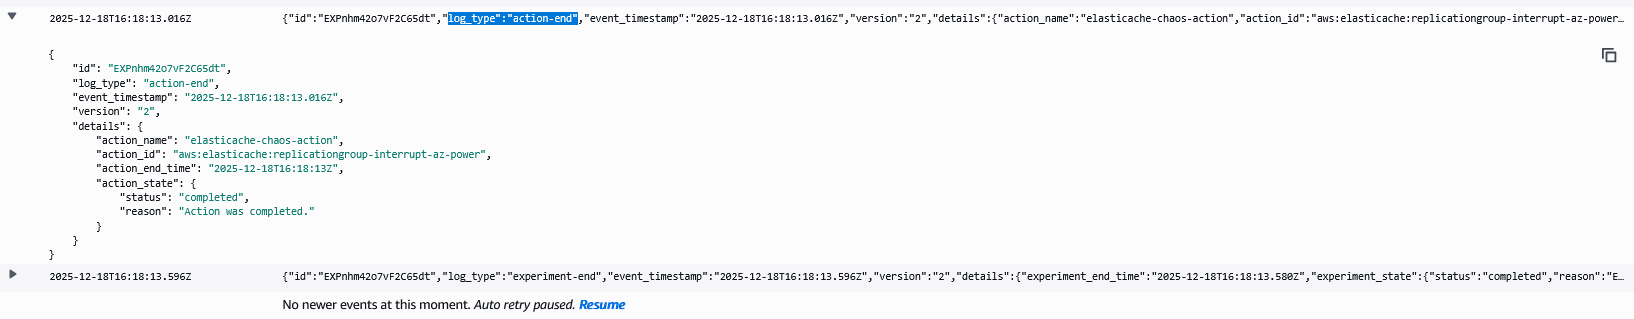
After the duration of 5 minutes (default setting in the Action page of the template) is over, you will see the log_type:action-end in the AWS FIS logs:
In the Amazon ElastiCache console, you will see the status of the nodes and the cluster being shown as Available.
Validating Resilience: What to Look for and How to Respond
Running the resilience test is only the first step. The real value comes from understanding what happened during the failover and ensuring your application handles it gracefully.
Understanding ElastiCache Events
ElastiCache events provide visibility into cluster health during failover. Key events to verify:
- Recovering cache nodes indicates the affected node is being restored
- Finished recovery for cache nodes confirms the original node rejoined the cluster as a replica
- The entire failover process typically completes within seconds for Multi-AZ configurations
Analyzing Cluster Logs
If you enabled engine logs for your ElastiCache cluster, you’ll see detailed connection behavior during failover:
- The exact moment when replicas detected the primary node failure
- Messages like “Connecting to MASTER” and “Replica has started synchronizing with the primary” show the recovery process
- Successful synchronization messages confirm data consistency was maintained
Testing Application Resilience
While ElastiCache handles failover automatically, your application’s behavior during this window is critical:
- Connection handling: Well-designed applications should show brief connection errors (5-15 seconds) followed by automatic reconnection. Longer outages indicate issues with connection pool settings or retry logic.
- Cache miss behavior: Verify your application falls back to the database gracefully without overwhelming it. Database query rates should increase temporarily but remain manageable.
- Performance degradation: Measure response times before, during, and after failover. Resilient applications might see latency increase from 50ms to 200ms during failover, then return to normal. Spikes above 1 second require investigation of connection timeout and retry configurations.
For more details on the monitoring the application behavior on your Amazon ElastiCache, refer to Monitoring best practices with Amazon ElastiCache for Redis using Amazon CloudWatch.
Conclusion
In this post, you learned how you can implement resilience testing on Amazon ElastiCache by using AWS Fault Injection Service (AWS FIS). With this testing, you can proactively identify weaknesses in your caching strategy, validate failover mechanisms, and ensure graceful degradation before actual incidents occur. Running these experiments helps your team practice incident response procedures and understand the cascading effects of cache failures on your overall system architecture.
For overall Amazon ElastiCache best practices, refer to the ElastiCache best practices and caching strategies documentation.
Clean up
If you created a new Amazon ElastiCache cluster for this walk-through, then you can terminate the cluster to optimize the costs by following the steps in the Deleting a cluster in ElastiCache documentation. You can also delete the AWS FIS experiment template by following the steps in the Delete an experiment template documentation. For IAM role deletion and the cloudwatch log group deletion, please refer to the documentation Deleting an IAM role and Deleting the CloudWatch Logs respectively.