AWS Database Blog
Set up proactive monitoring for Amazon RDS for SQL Server with real-time Slack notifications
Database monitoring is a critical aspect of maintaining robust and reliable applications. Effective monitoring of Amazon RDS for SQL Server instances empowers teams to maintain peak database performance and ensure seamless operations. Modern monitoring solutions have revolutionized how database administrators, developers, and operations teams manage their database environments, enabling proactive issue detection and rapid response capabilities. These advances present compelling opportunities to enhance system reliability, streamline maintenance workflows, and optimize resource utilization across multiple database instances. While teams have historically faced challenges with manual log checking and fragmented monitoring tools, today’s automated, real-time notification systems offer a transformative approach to database management that significantly reduces response times and minimizes system downtime.
In this post, we demonstrate how to build an efficient, serverless monitoring system for Amazon RDS for SQL Server using AWS native services and Slack integration.
Solution overview
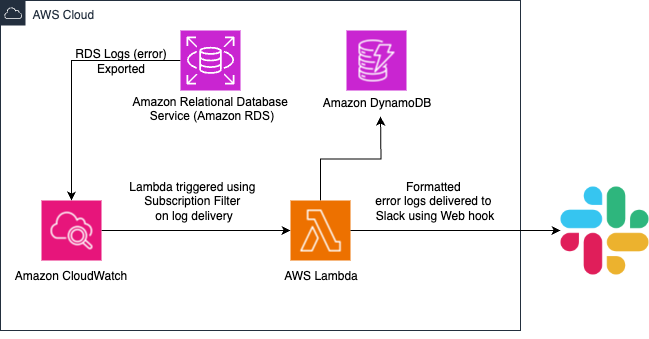
This solution presents an efficient, serverless approach to database monitoring by integrating Amazon RDS for SQL Server, Amazon CloudWatch, AWS Lambda, and Slack services. By using these AWS services along with Slack’s communication platform, we create a streamlined notification system that automatically alerts teams about database issues. The architecture eliminates the need for manual monitoring while providing real-time visibility into database health.
To process, we implement a Lambda function that automatically triggers when errors are detected. The Lambda function is configured with necessary permissions and dependencies to decode the log data and format it into readable messages. These messages are first saved in a Amazon DynamoDB table and then delivered to a designated Slack channel through a secure webhook integration, enabling immediate notification to database administrators and support teams.
This serverless architecture provides a cost-effective, scalable solution for real-time database monitoring, requiring minimal maintenance while providing prompt notification of potential issues. The entire process, from error occurrence to Slack notification, typically completes within seconds, allowing for quick response to database issues and improved system reliability.
The following diagram depicts the architecture of the solution.
Items in DynamoDB are automatically deleted after 48 hours(configurable), which optimizes costs by reducing storage charges, improves query performance by maintaining lean tables, and provides better data management through automatic cleanup of stale data. Also, if the same error message occurs multiple times within a 15-minute(configurable) window, only the first instance will be sent to Slack. This prevents notification spam and helps maintain operational clarity
The notification process begins when Amazon RDS for SQL Server generates error logs and publishes them to CloudWatch log groups. As new logs arrive, the CloudWatch subscription filter continuously monitors these entries, checking them against predefined error patterns. When a matching error pattern is detected, the filter automatically triggers a Lambda function. The Lambda function processes the log entry by first decoding and decompressing the data from CloudWatch. It extracts essential information such as the timestamp, log group details, and the actual error message and stores in DynamoDB. After processing, the Lambda function formats this information into a clear, readable message and sends it to a designated Slack channel through a secure webhook URL. Team members receive these notifications within seconds of the original error occurring in the RDS instance. This streamlined approach makes sure that database administrators and support teams can quickly identify and respond to potential issues, maintaining optimal database performance and reliability.
The key steps of implementing this solution can be summarized as follows:
- Publish RDS for SQL Server error logs to CloudWatch log groups.
- Create and configure a Lambda function to process CloudWatch logs.
- Set up a Lambda subscription filter to monitor CloudWatch logs for errors.
- Create a Slack channel and configure the incoming webhook.
- Configure a Lambda environment with the webhook URL for Slack notifications.
Prerequisites
To implement this solution, you need an active AWS account with an RDS for SQL Server instance already configured and running. You should have sufficient permissions to access and configure AWS services, including CloudWatch, Lambda, and AWS Identity and Access Management (IAM). This includes the ability to create and modify Lambda functions, manage CloudWatch log groups, create IAM roles and policies, and modify RDS instance configurations.
For the Slack integration, you need administrator access to a Slack workspace where you can create channels and configure webhook integrations. These permissions are essential because you will be setting up incoming webhooks and configuring notification channels for your team.
Please note, your choice of RDS deployment type (Single-AZ vs Multi-AZ) will likely be the largest cost factor in this solution. Before proceeding, we recommend reviewing the pricing pages for Amazon RDS, CloudWatch, and use AWS Lambda to understand the cost implications of implementing this solution.
Configure RDS log export to CloudWatch
First, you must configure your RDS, as we need to configure our RDS for SQL Server instance to export its error logs to CloudWatch. This configuration enables centralized log storage and sets the foundation for your notification system. To publish RDS for SQL Server error logs to CloudWatch, you need to modify your DB instance. Complete the following steps:
- On the Amazon RDS console, in the navigation pane, choose Databases.
- Choose the DB instance that you want to modify.
- Choose Modify.
- In the Log exports section, choose the logs that you want to start publishing to CloudWatch. For this post, we select Error log and click Continue.

- On the confirmation page, review your changes and choose Apply immediately to apply the changes immediately. Choose Modify DB instance to save your changes. Alternatively, choose Back to edit your changes or Cancel to cancel your changes.
Now you’re ready to set up the CloudWatch log processing flow with real-time Slack notifications.
Create the Slack channel incoming webhook
The next step in our notification system involves setting up the destination for our alerts. We create a Slack webhook that provides a secure URL endpoint where the Lambda function can send formatted messages. This enables automated posting of error notifications directly to a designated Slack channel where team members can monitor and respond to issues. Complete the following steps:
- Open your Slack workspace.
- Navigate to the workspace settings.
- Choose Apps & Integrations.
- Search for incoming webhooks.
- Choose Add to Slack.
- Choose the channel for notifications.
- Copy the webhook URL – you’ll need this in the next step.
Create a Lambda function and configure associated resources
This step involves creating the core serverless Lambda function that will process our CloudWatch logs. The Lambda function is written in Python and contains the logic to decode CloudWatch log data, extract relevant error information, and format it for Slack notifications. This function serves as the central processing unit of our monitoring solution. Complete the following steps to create the Lambda function:
- Clone or download the project repository from Github to your local machine
- Navigate to the project root directory in your terminal
- Ensure prerequisites are met:
- AWS CLI installed and configured with appropriate permissions
- Python 3.12 installed locally (the deployment script will create an isolated virtual environment). Please refer to the README.md on how to install Python 3.12 in your system.
- zip utility available
- Proper AWS permissions for IAM, Lambda, and DynamoDB (refer to Pre-requisite section in README.md file)
- Run the automated deployment script:./scripts/deploy.sh
- When prompted, enter your Slack webhook URL that you created in the previous step.
- The script will automatically:
- Verify Python 3.12 is installed on your system
- Create an isolated Python 3.12 virtual environment
- Activate the virtual environment for dependency isolation
- Install urllib3 in the isolated environment
- Create IAM policy (SlackNotifierLambdaPolicy) with DynamoDB permissions
- Create IAM role (SlackNotifierLambdaRole) with proper trust relationships
- Build and publish urllib3 Lambda layer using Python 3.12
- Package and deploy the Lambda function (SlackNotifier)
- Configure environment variables including your Slack webhook URL
- Attach the urllib3 layer to the function
- Clean up temporary files
- Deactivate the virtual environment.
DISCLAIMER: This IAM policy (SlackNotifierLambdaPolicy) created as part of the process, serves as a general guideline only. You should review, customize, and validate all security measures according to your specific requirements and compliance standards. AWS best practices strongly emphasize implementing the principle of least privilege, which grants users only the minimum permissions required to perform their tasks. This core security concept, detailed in AWS IAM documentation, helps minimize potential security risks.
Create a Lambda subscription filter for CloudWatch log groups
The subscription filter acts as the trigger mechanism, defining which log entries should be sent to the Lambda function. We configure it to watch for specific error patterns in the CloudWatch log group, making sure only relevant logs are processed and unnecessary function invocations are avoided. Complete the following steps to create the Lambda subscription filter using the Lambda function created earlier:
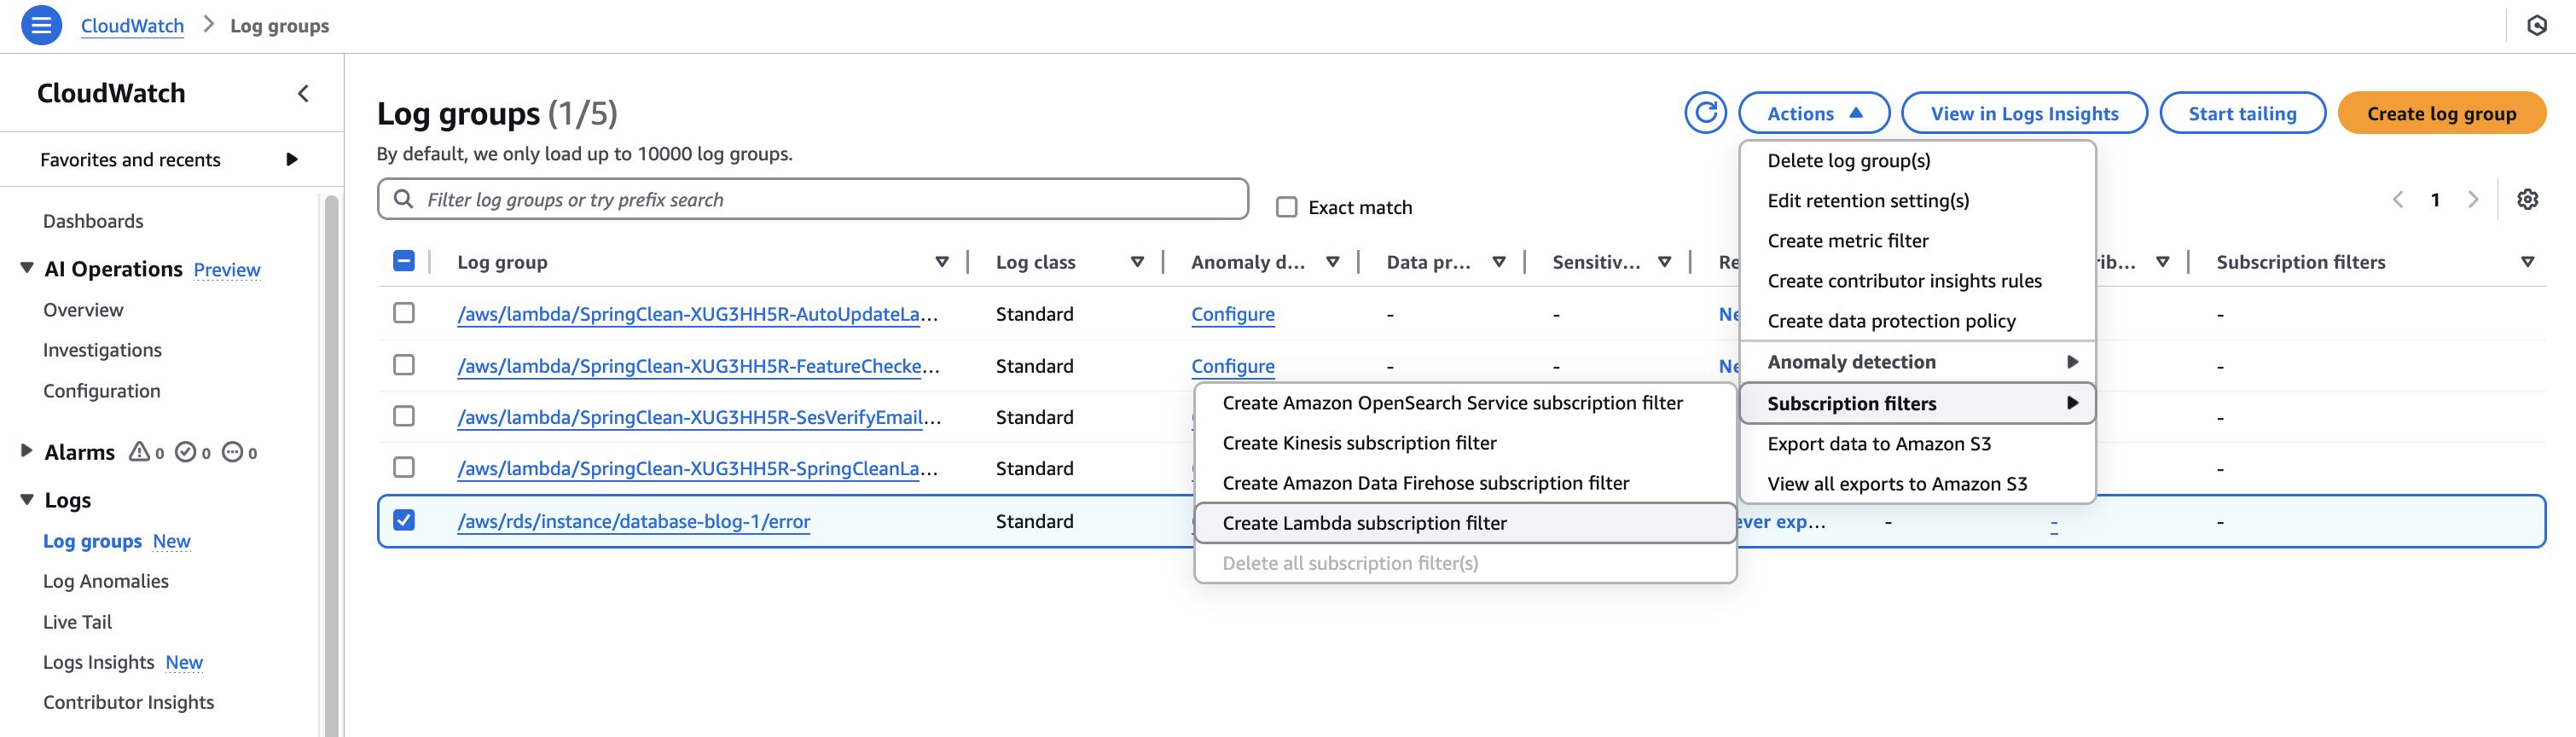
- On the CloudWatch console, choose Log groups in the navigation pane.
- Select your SQL Server log group.
- On the Actions menu, choose Subscription filters and select Create Lambda subscription filter.
- Select your Lambda function (SlackNotifier) from the dropdown in Choose destination section.
- Under Configure log format and filters, enter the following Subscription filter pattern:
- Provide a name to your Subscription filter. For this post, we use Error Subscription Filter
- (Optional) You can test this setup in Test pattern section, select the database from Select log data to test dropdown and choose Test pattern. You should get the logs matching the filter pattern in the Results section.
- Choose Start Streaming.
Now all your database error logs will be processed and accessible through CloudWatch log streams.
With this final step, you have completed the implementation of your automated Amazon RDS for SQL Server monitoring solution. The system is now ready to capture SQL Server errors and send notifications to your Slack channel. The Lambda function will use the webhook URL to securely communicate with Slack, making sure your team receives immediate notifications when database errors occur. These notifications include essential information such as the error message, timestamp, and contextual details, enabling your team to quickly assess and respond to potential issues. The system operates continuously in the background, requiring no manual intervention for monitoring database logs.
Validate the solution
To make sure your implementation is working as intended, you can perform a simple validation test:
- Connect to an RDS for SQL Server instance using SQL Server Management Studio (SSMS).We use the database
SlackNotifications, as shown in the following screenshot.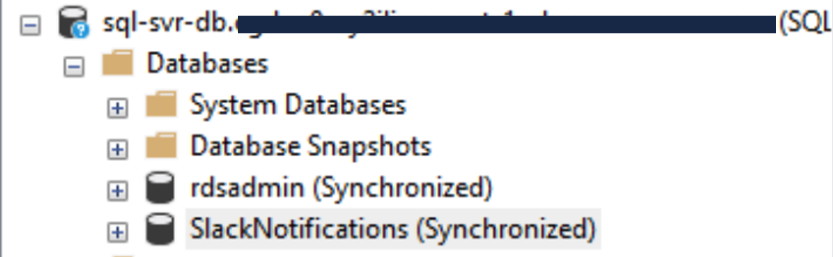
- Create an error message using the RAISERROR WITH LOG option for demonstration purposes:
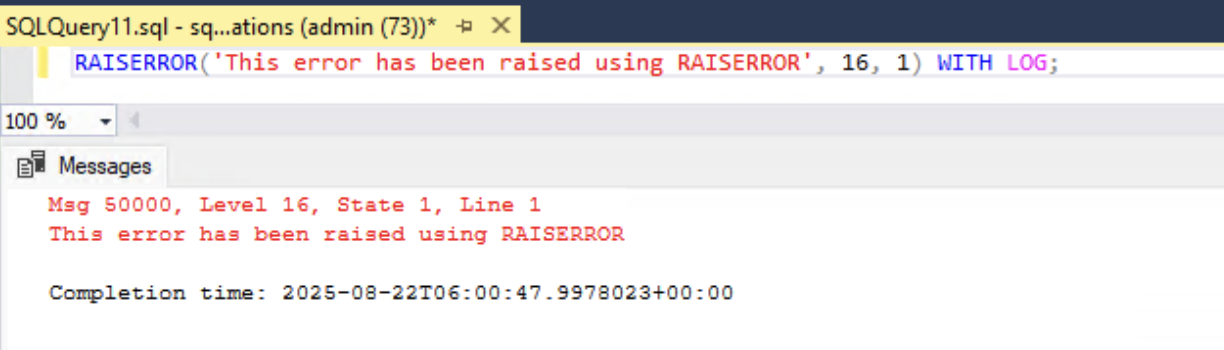
- Review the SQL Server error log for the error mentioned earlier:
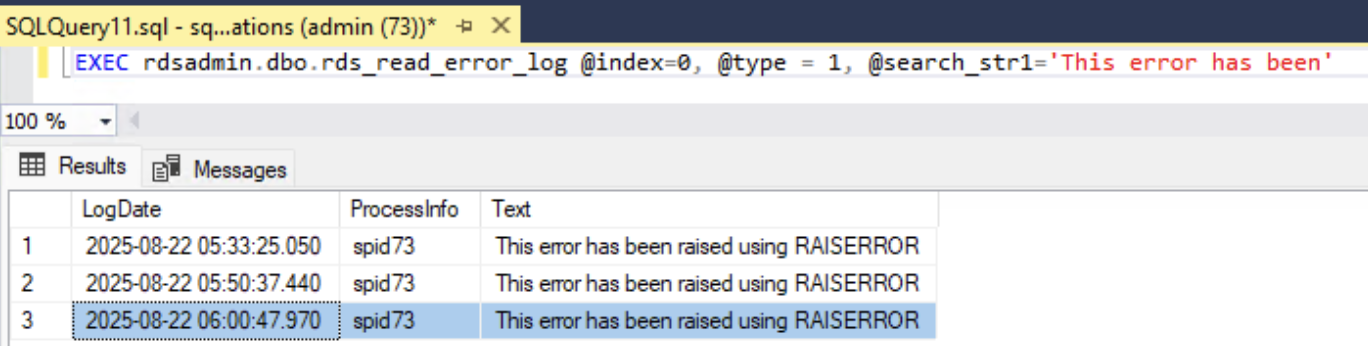
Now that we have published RDS for SQL Server error logs to CloudWatch, the next step is to check whether the error has been exported to CloudWatch.
- On the CloudWatch console, under Logs in the navigation pane, choose Log groups.
- Choose the RDS for SQL Server error log of your DB instance (for this post,
/aws/rds/instance/<<your db instance>>/error). - On the Log streams tab, choose the active node where database is running. (this might vary based on your specific environment).
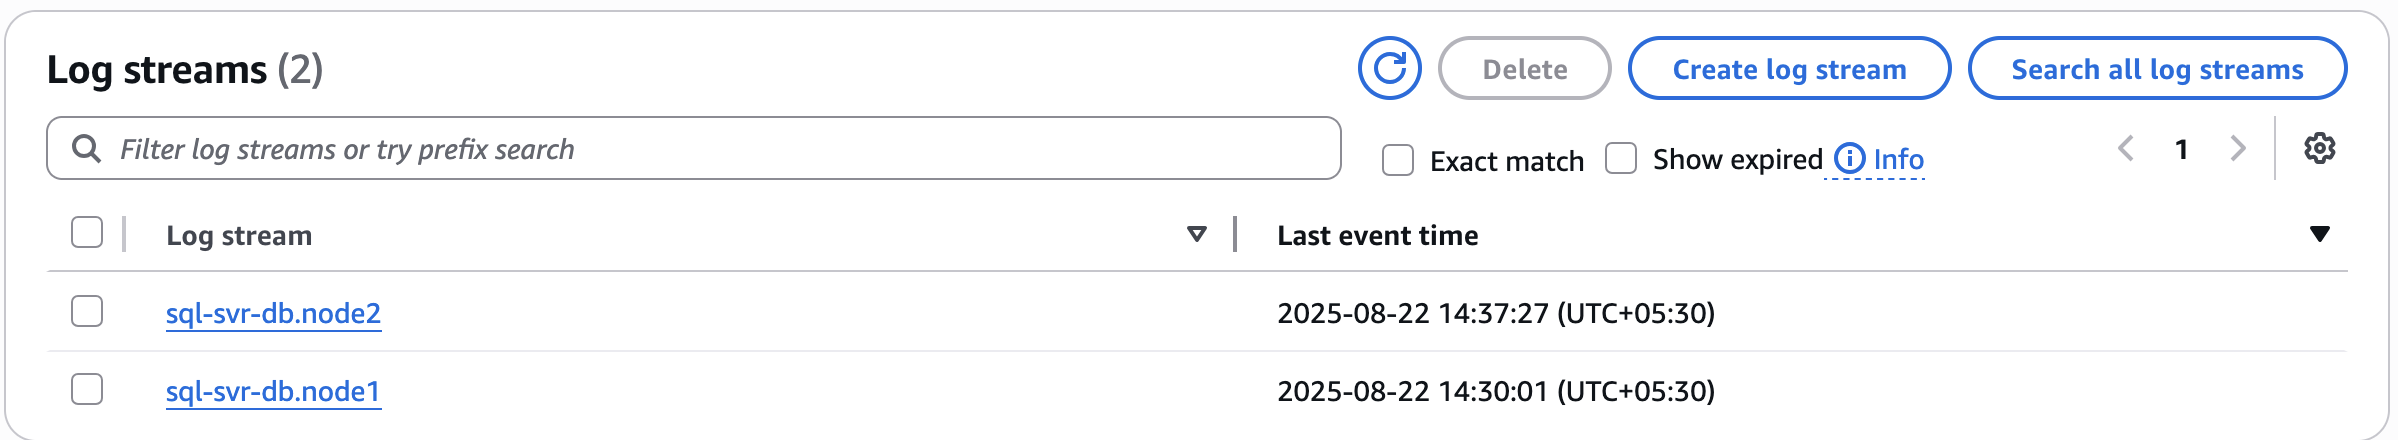
You can review the error message along with the timestamp.

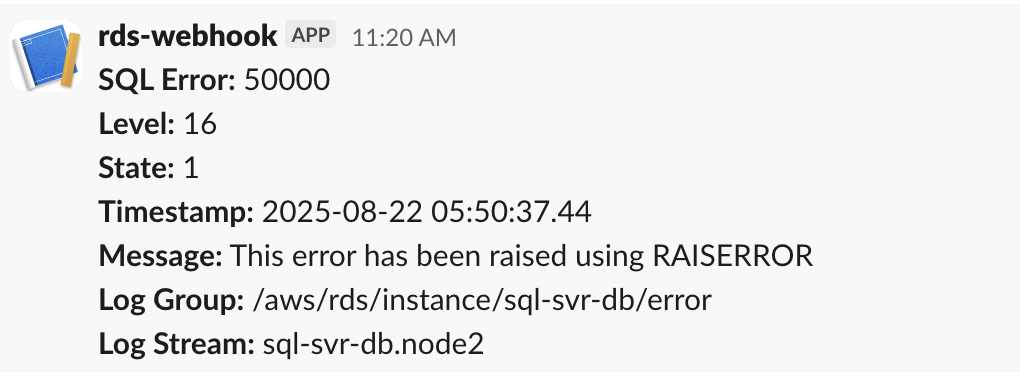
Within a few seconds, you should see this test error appear as a notification in your configured Slack channel. Similar as below:
You can also verify the system’s operation by checking CloudWatch Logs to confirm that RDS logs are being exported successfully and your Lambda function is processing these logs correctly.
Considerations
When implementing this solution, it’s important to be mindful of a few key aspects to achieve optimal performance and cost-efficiency:
- Before publishing RDS for SQL Server error logs to CloudWatch, implement custom masking logic to protect sensitive information. Evaluate this approach based on your specific business requirements, as these logs may contain confidential data
- Configure the CloudWatch Logs retention period based on your requirements, because the default Never expire setting might increase storage costs
- For security, make sure the Lambda execution role follows the principle of least privilege, and store sensitive information like Slack webhook URLs in AWS Systems Manager Parameter Store or Secrets Manager if they don’t want it visible on the Lambda environment variable.
- Regularly monitor Lambda function performance and errors through CloudWatch metrics.
- While this is a sample implementation, be sure to add proper error handling to your Lambda function to ensure production reliability.
- The implementation follows AWS best practices for security and scalability, using IAM roles with least privilege, environment variables for sensitive information, and Lambda layers for dependency management. This approach not only provides reliable monitoring but also maintains cost-effectiveness by using serverless components that scale automatically with your needs. The solution can be adapted to monitor multiple database instances or modified to include additional error patterns and notification formats.
Clean up
To avoid incurring unnecessary charges and maintain a clean AWS environment, follow these steps to remove the resources created for this solution:
- Deleting a DB instance
- Delete the Lambda resources:
- Run the automated un-deployment script: ./scripts/undeploy.sh
- Delete the CloudWatch resources:
- Delete the subscription filter from the CloudWatch log group.
- If no longer needed, disable the RDS error log export to CloudWatch.
- Consider deleting stored logs in CloudWatch log groups if they’re no longer required.
- Clean up Slack:
- Remove the incoming webhook integration from your Slack channel.
- Archive or delete the dedicated notification channel if it was created specifically for this purpose.
Conclusion
In this post, we showed how you can build an efficient, serverless real-time monitoring system for Amazon RDS for SQL Server using AWS native services and Slack integration. By automating the error notification process, teams can significantly reduce their response time to database issues and minimize potential impacts on their applications. Most importantly, this automated notification system transforms the traditional database monitoring approach from reactive to proactive. Teams no longer need to manually check logs or worry about missing critical database errors. With real-time Slack notifications, they can focus on resolving issues rather than detecting them, ultimately leading to improved database reliability and reduced operational overhead. Try out this solution for your own use case, and share your feedback in the comments.