AWS Database Blog
Use query statistics to find slow and expensive queries in Aurora DSQL
When a code change slows down your application, query statistics in Amazon Aurora DSQL help you find the slow and expensive queries behind it, down to the exact SQL statement. Because Aurora DSQL bills for database activity in Distributed Processing Units (DPUs), an inefficient query costs you in both latency and DPUs.
Aurora DSQL observability already includes sampled SQL metrics. DSQL Active Session History (DASH) samples every active session once per second, and Amazon CloudWatch Database Insights shows where session time goes, by wait event and SQL statement. For an introduction, see Amazon Aurora DSQL observability concepts and usage with Amazon CloudWatch. Sampling doesn’t record how many times a statement ran, how many rows it read, or how many DPUs it used.
Aurora DSQL now also publishes SQL query statistics. These per-SQL statistics are recorded each time a statement completes. For each normalized statement, Aurora DSQL records calls, latency, rows returned and scanned, compute and storage time, and DPU consumption. You can access query statistics in two ways: the new SQL metrics tab in CloudWatch Database Insights and PromQL queries in Amazon CloudWatch Query Studio.
In this post, we walk through a performance investigation for an online store. A new feature triggers a latency alarm, and we use query statistics to pinpoint the query responsible, confirm a missing index, fix it, and measure the improvement. We then use the same metrics to calculate what the missing index costs. All figures come from a test that you can reproduce with psql and pgbench.
Solution overview
Query statistics complement the sampled metrics from DASH. The following table compares the two.
| Sampled metrics (DASH) | Query statistics (new) | |
| Question it answers | Where is session time going? | What does each statement do per run, and what does it cost? |
| How data is collected | Samples every active session once per second | Records every statement as it completes, aggregated per statement |
| Main metrics | Average active sessions (db.active_sessions.avg) |
Calls, duration, rows returned and scanned, compute and storage time, DPU |
The SQL metrics tab in Database Insights shows the following charts for a selected statement. Each chart is calculated from CloudWatch OpenTelemetry (OTel) metrics such as aws.dsql.query.calls, aws.dsql.query.rows, aws.dsql.query.scanned_rows, and aws.dsql.query.read_dpu, and each data point includes the statement fingerprint, db.query.id.
| Chart | What it shows |
| Calls/sec | Completed executions of the statement per second |
| Rows/sec | Rows returned per second |
| Avg duration (ms) | Average planning and execution time per call |
| Total DPU/call | Compute, read, write, and multi-Region write DPU, divided by calls. Separate charts show compute, read, and combined write DPU |
| Compute time/call (ms) | Time per call spent in the query processor |
| Storage time/call (ms) | Time per call spent waiting on storage |
| Scanned rows/call | Rows read from storage per call |
| Rows/call | Number of rows returned from the query processor or updated in storage. |
In the following diagram, (1) a sample order service sends SQL to an Aurora DSQL cluster, and (2) the cluster publishes DASH sampled metrics and query statistics to CloudWatch. (3) You investigate in Database Insights and Query Studio.
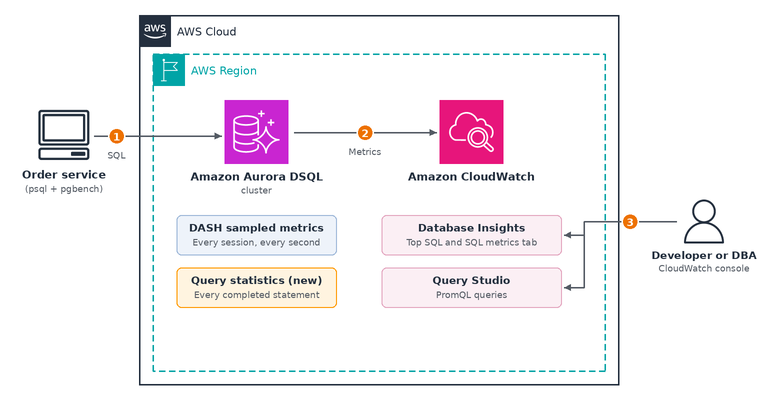
Figure 1: Solution architecture
Prerequisites
To follow along, you need the following:
- An AWS account with permissions to create and delete Aurora DSQL clusters, and to view CloudWatch Database Insights and CloudWatch Query Studio.
- An AWS Identity and Access Management (IAM) identity with the
dsql:DbConnectAdminpermission on the cluster, which you use to generate authentication tokens. For more information, see Generating an authentication token in Amazon Aurora DSQL. - The AWS Command Line Interface (AWS CLI) version 2, configured with credentials for your account.
- The
psqland pgbench clients, which are included with PostgreSQL client installations. We used version 18. - A Linux or macOS terminal, and familiarity with SQL.
You create the Aurora DSQL cluster in the next section. For other ways to create one, see Getting started with Aurora DSQL.
The walkthrough scans many rows on purpose, which consumes DPUs.
Set up the test environment
AnyCompany runs its order service on Aurora DSQL. The team deploys an Order history page that shows the 20 most recent orders for a customer:
The orders table has a primary key but no index on customer_id. With a few thousand rows in testing, the page loads quickly. In production, with about 5 million rows, the latency alarm fires minutes after the deployment.
Create the cluster and connect
Create a single-Region cluster and note the identifier in the response. You also need to turn on statement statistics with the metricGroups parameter of the CreateCluster or UpdateCluster operation. A metric group is an optional set of metrics. The only metric group is STATEMENT_STATISTICS. The setting applies to one cluster in one Region. For a multi-Region cluster, turn it on for each peer cluster.
You need the dsql:UpdateCluster or dsql:CreateCluster permission to change the setting, and dsql:GetCluster to read it.
When aws dsql get-cluster --identifier <cluster-id> reports the status ACTIVE, connect with psql. The following commands store the connection details in environment variables, so that both psql and pgbench can use them. PGAPPNAME sets the application name that query statistics record.
Create and load the tables
Create the two tables:
Aurora DSQL limits each transaction to 3,000 modified rows. For more information, see Cluster quotas and database limits in Amazon Aurora DSQL. The following statements generate one INSERT statement for each batch of 2,000 rows, and the psql \gexec command runs each one in its own transaction. The load creates 100,000 customers and 5 million orders.
To check the data volume, turn on timing with \timing on and run the Order history query once with customer_id = 42. In our test, one call took about 12 seconds.
Simulate the application workload
pgbench runs a SQL script repeatedly from many concurrent sessions. Save the following two scripts. In each script, \set picks a random customer for every run. baseline.sql simulates the existing features: a customer lookup and a new order.
order_history.sql simulates the new Order history page.
In a terminal where the connection variables are set, run the baseline for 5 minutes, and then add the Order history page for 15 minutes. In these commands, -c sets the number of sessions, -T the run time in seconds, -P the progress interval, -j the number of worker threads, and -n skips vacuuming the pgbench sample tables. Note the start times for the CloudWatch time range.
Each call uses a different customer ID, but Aurora DSQL normalizes literal values, so all calls appear as one statement in the metrics.
Observe the slowdown
Within a minute, the pgbench progress output shows the problem. Existing features still take about 57 milliseconds per transaction, but each Order history call takes about 12 seconds:
In production, this is when the p99 latency alarm for the page fires. The alarm tells you that the page is slow, but not why.
Investigate the slowdown
With the workload running, use query statistics to find the cause. Steps 1 to 3 use the CloudWatch console.
Step 1: Detect the slowdown in Database Insights
In the CloudWatch console, choose Database Insights, and select your cluster. For Aurora DSQL, the database identifier is the cluster ID. Set the time range to cover the test.
The following figure shows database load in average active sessions (AAS), sliced by wait event. The numbered line marks when the Order history page was added, at 00:29. Load is about 1.3 AAS before the line, mostly Commit, and about 4.3 AAS after it, mostly from OnCpu and SequentialScanRead.
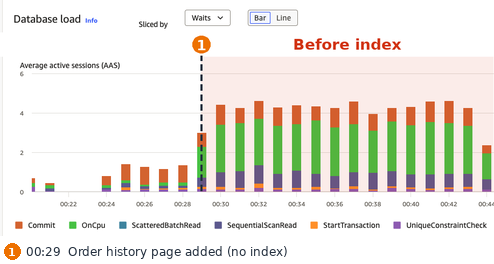
Figure 2: Database load sliced by waits, before and after the Order history page was added
Because Aurora DSQL scales elastically to absorb it, higher load by itself isn’t a warning sign. Look at the wait profile instead. Sessions now spend most of their time on CPU and reading ranges of rows from storage, and that shift is what tells you something changed.
Step 2: Pinpoint the query on the SQL metrics tab
In DB Load Analysis, choose Top SQL. The Order history statement is at the top, with 2.76 AAS and an average duration of 11,810.67 milliseconds. When you select it, the Database load chart is scoped to the statement, as the following figure shows. Most of its load is OnCpu.
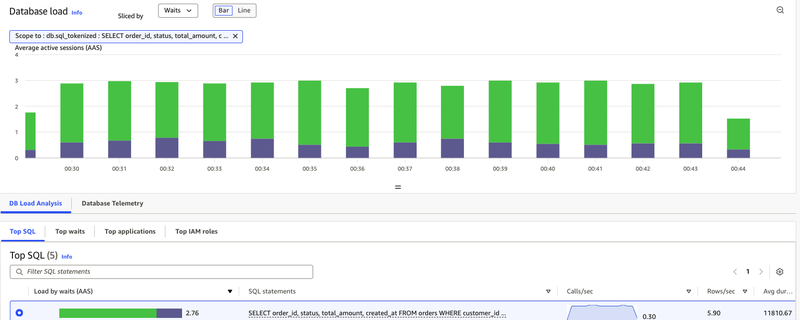
Figure 3: Database load scoped to the Order history statement, with Top SQL
Next, choose the SQL metrics tab for the statement. The following figure shows three of its charts. Before the fix, each call takes about 12 seconds and consumes about 656 DPU, and each call scans about 5.17 million rows to return 20. That’s about 258,000 rows read for each row returned.
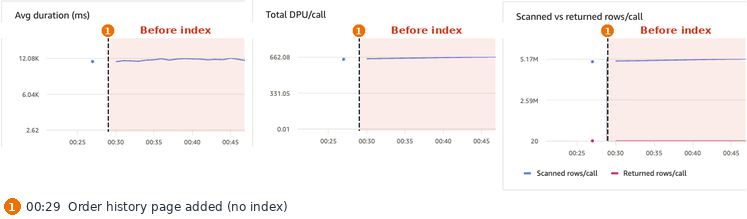
Figure 4: Average duration, DPU per call, and scanned rows compared with returned rows on the SQL metrics tab
The SQL metrics tab also splits each call into compute and storage time. In the following figure, each call spends about 10.1 seconds on compute and about 2.7 seconds waiting on storage, which matches the OnCpu-heavy load in Figure 3. The statement is slow because it reads and filters millions of rows on every call.
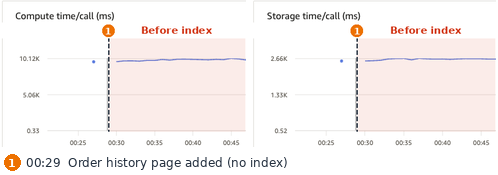
Figure 5: Compute time and storage time per call on the SQL metrics tab
Step 3: Quantify the impact in Query Studio
On any SQL metrics chart, choose View in Query Studio. Query Studio opens the PromQL query behind the chart, which you can edit or reuse. For example, the following query, from the Scanned vs returned rows/call chart, calculates the rows scanned per call for one statement. To chart rows returned per call instead, replace aws.dsql.query.scanned_rows with aws.dsql.query.rows. Replace <cluster-id> and <query-id> with your values.
The following figure shows the Total DPU/call chart in Query Studio. At 00:40 PST, before the fix, the statement consumed 656.0 DPU per call.
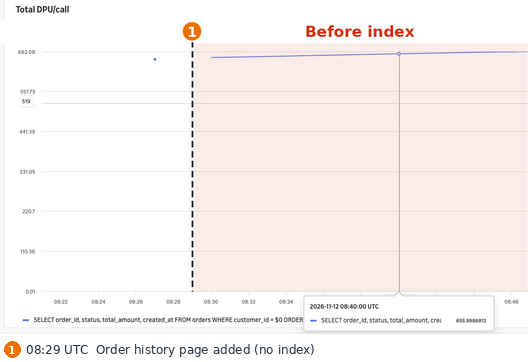
Figure 6: Total DPU per call for the Order history statement in CloudWatch Query Studio
Fix the missing index
Next, confirm the cause, add the index, and measure the result.
Step 4: Confirm the missing index with EXPLAIN ANALYZE VERBOSE
Run the statement with EXPLAIN ANALYZE VERBOSE. The following output from the test is abbreviated.
The plan confirms the cause. Aurora DSQL Storage Scan on orders_pkey returns all 5,166,063 rows, and the filter on customer_id removes all but 48 of them. The Query Identifier, mfs5eeggtksar, matches the db.query.id on the SQL metrics tab. The DPU estimate of about 662 is close to the 656 DPU per call that CloudWatch measured. For details, see Understanding DPUs in EXPLAIN ANALYZE.
Step 5: Add the missing index
Create an index that starts with customer_id and includes the sort column. CREATE INDEX ASYNC builds the index in the background without blocking reads or writes, and returns a job ID that you can check in sys.jobs. For more information, see Asynchronous indexes in Aurora DSQL.
In the test, the index on about 5 million rows was active within about 3 minutes. After the job completes, run the same workload for 15 minutes:
Step 6: Validate the improvement
Run EXPLAIN ANALYZE VERBOSE again. The plan now reads the new index in descending created_at order for the customer and stops after 20 rows, so it no longer needs a sort:
Then return to the SQL metrics tab and set the time range to cover the whole test. The following figure shows the same charts before and after the index. The numbered lines mark when (1) the Order history page was added at 00:29, (2) the index build started at 00:45, and (3) the index became active at about 00:48.
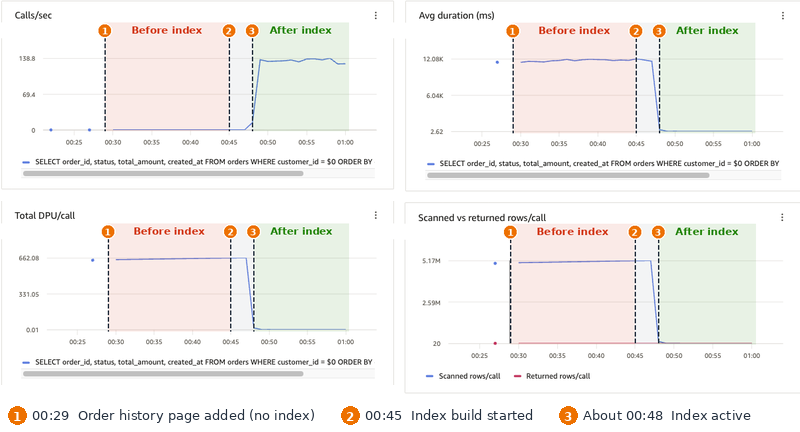
Figure 7: SQL metrics tab charts before and after the index was created
The following table summarizes the measured values.
| Order history statement | Before the index | After the index |
| Calls per second | 0.3 | About 135 |
| Average duration per call | 11,811 ms | About 2.6 ms |
| Compute time per call | About 10,100 ms | About 0.3 ms |
| Storage time per call | About 2,660 ms | About 0.5 ms |
| Rows scanned per call | About 5,170,000 | About 20 |
| Total DPU per call | 656.0 | 0.0148 |
Latency per call dropped by about 4,500 times, and DPU per call by about 44,000 times. With the same four sessions, the statement completed 307 calls in 15 minutes before the fix and 97,945 after it. That is why database load settled at about 1.8 AAS, slightly higher than the baseline.
Understand the cost of the missing index
Cluster-level CloudWatch metrics, such as ReadDPU, show that DPU consumption is rising, but not which query is responsible. Query statistics attribute DPU to each statement, so you can calculate what a missing index costs.
At $8.00 per 1 million DPUs in US West (Oregon), 656 DPU per call costs about $5.25 per 1,000 calls. After the fix, 1,000 calls cost less than $0.001. For current prices, see Amazon Aurora DSQL pricing. The following table projects the monthly cost of the statement at 10,000 calls per day.
| Order history statement | Before the index | After the index |
| DPU per call (measured) | 656 | 0.015 |
| Cost per 1,000 calls | $5.25 | Less than $0.001 |
| DPU per 30-day month at 10,000 calls per day | 196.8 million | About 4,500 |
| Estimated monthly DPU cost | $1,574.40 | About $0.04 |
The cost of a data scan grows with both traffic and table size, because every call reads more rows as the table grows. To find the statements that drive DPU consumption, run the following query in Query Studio. It ranks the five statements by read and compute DPU per minute, with no filter on a query ID.
The following figure shows the result of the test. Before the fix, the Order history statement (mfs5eeggtksar) consumed about 13,100 DPU per minute, more than 1,000 times the next statement. The dip at 00:45 is the pause between test phases. After the index became active, the statement consumed about 122 DPU per minute while serving about 450 times more calls.
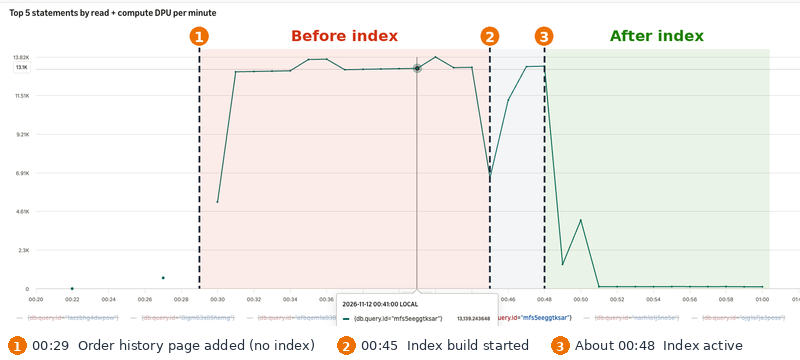
Figure 8: Top statements by read and compute DPU per minute in CloudWatch Query Studio
Check new queries with EXPLAIN ANALYZE VERBOSE before you deploy them.
Clean up resources
To avoid ongoing charges, drop the sample tables. If you created the cluster only for this walkthrough, delete it in the Aurora DSQL console or with the AWS CLI. If deletion protection is turned on, turn it off first.
Conclusion
In this post, we showed how query statistics in Aurora DSQL help you find slow and expensive queries. We used Database Insights, the SQL metrics tab, and Query Studio to pinpoint a statement that scanned 5.17 million rows to return 20 and consumed 656 DPU per call. After an asynchronous index build, the same metrics showed latency per call dropping from about 12 seconds to under 3 milliseconds and DPU per call from 656 to 0.015. At 10,000 calls per day, that missing index would cost about $1,574 per month.
To get started, open Database Insights in the CloudWatch console, select your Aurora DSQL cluster, choose a statement in Top SQL, and open the SQL metrics tab. To learn more, see Monitoring Aurora DSQL clusters with Aurora DSQL Database Insights in the Aurora DSQL User Guide. If you want help applying this approach to your workloads, contact your AWS representative. We welcome your feedback in the comments.