AWS HPC Blog
Monitoring AWS Parallel Computing Service
This post was contributed by Ronald Hudson and Nate Haynes
High Performance Computing (HPC) on AWS demands precise monitoring, like the racing telemetry used by Formula 1 teams to deliver results. Like race engineers tracking car performance, AWS Parallel Computing Service (AWS PCS) administrators must monitor computing metrics in real-time. This vigilance is critical because performance degradation in long-running calculations—which often span days or weeks—can compromise research accuracy and increase computing costs.
AWS PCS enables organizations to run massive parallel computing workloads in the cloud. The service supports thousands of concurrent jobs while automatically scaling resources to match demand, eliminating the need for upfront infrastructure investments. This capability transforms HPC applications across industries: research labs now complete genome sequencing in hours versus weeks, engineering firms run complex simulations 10x faster, and financial institutions process risk models in real-time. AWS PCS makes advanced computing accessible to organizations regardless of their size, driving innovation in scientific research, financial modeling, and machine learning.
We are excited to announce a new observability solution for AWS PCS customers. This solution will provide:
- Detailed visibility into your HPC environment
- Clear insights into resource allocation and consumption
- Real-time tracking of job performance
- Faster access to diagnostic data
With these capabilities, users can quickly identify and resolve potential issues in their HPC environment, improving overall system management and efficiency.
Observability with Amazon Managed Grafana
The solution uses Amazon Managed Grafana and Amazon Managed Service for Prometheus to gather and present a set of dashboards to the user. The solution gathers data from Amazon CloudWatch Logs, Slurm Exporter, EFA Exporter, Node Exporter, and DCGM (Data Center GPU Manager) Exporter. The following diagram shows the overall architecture.
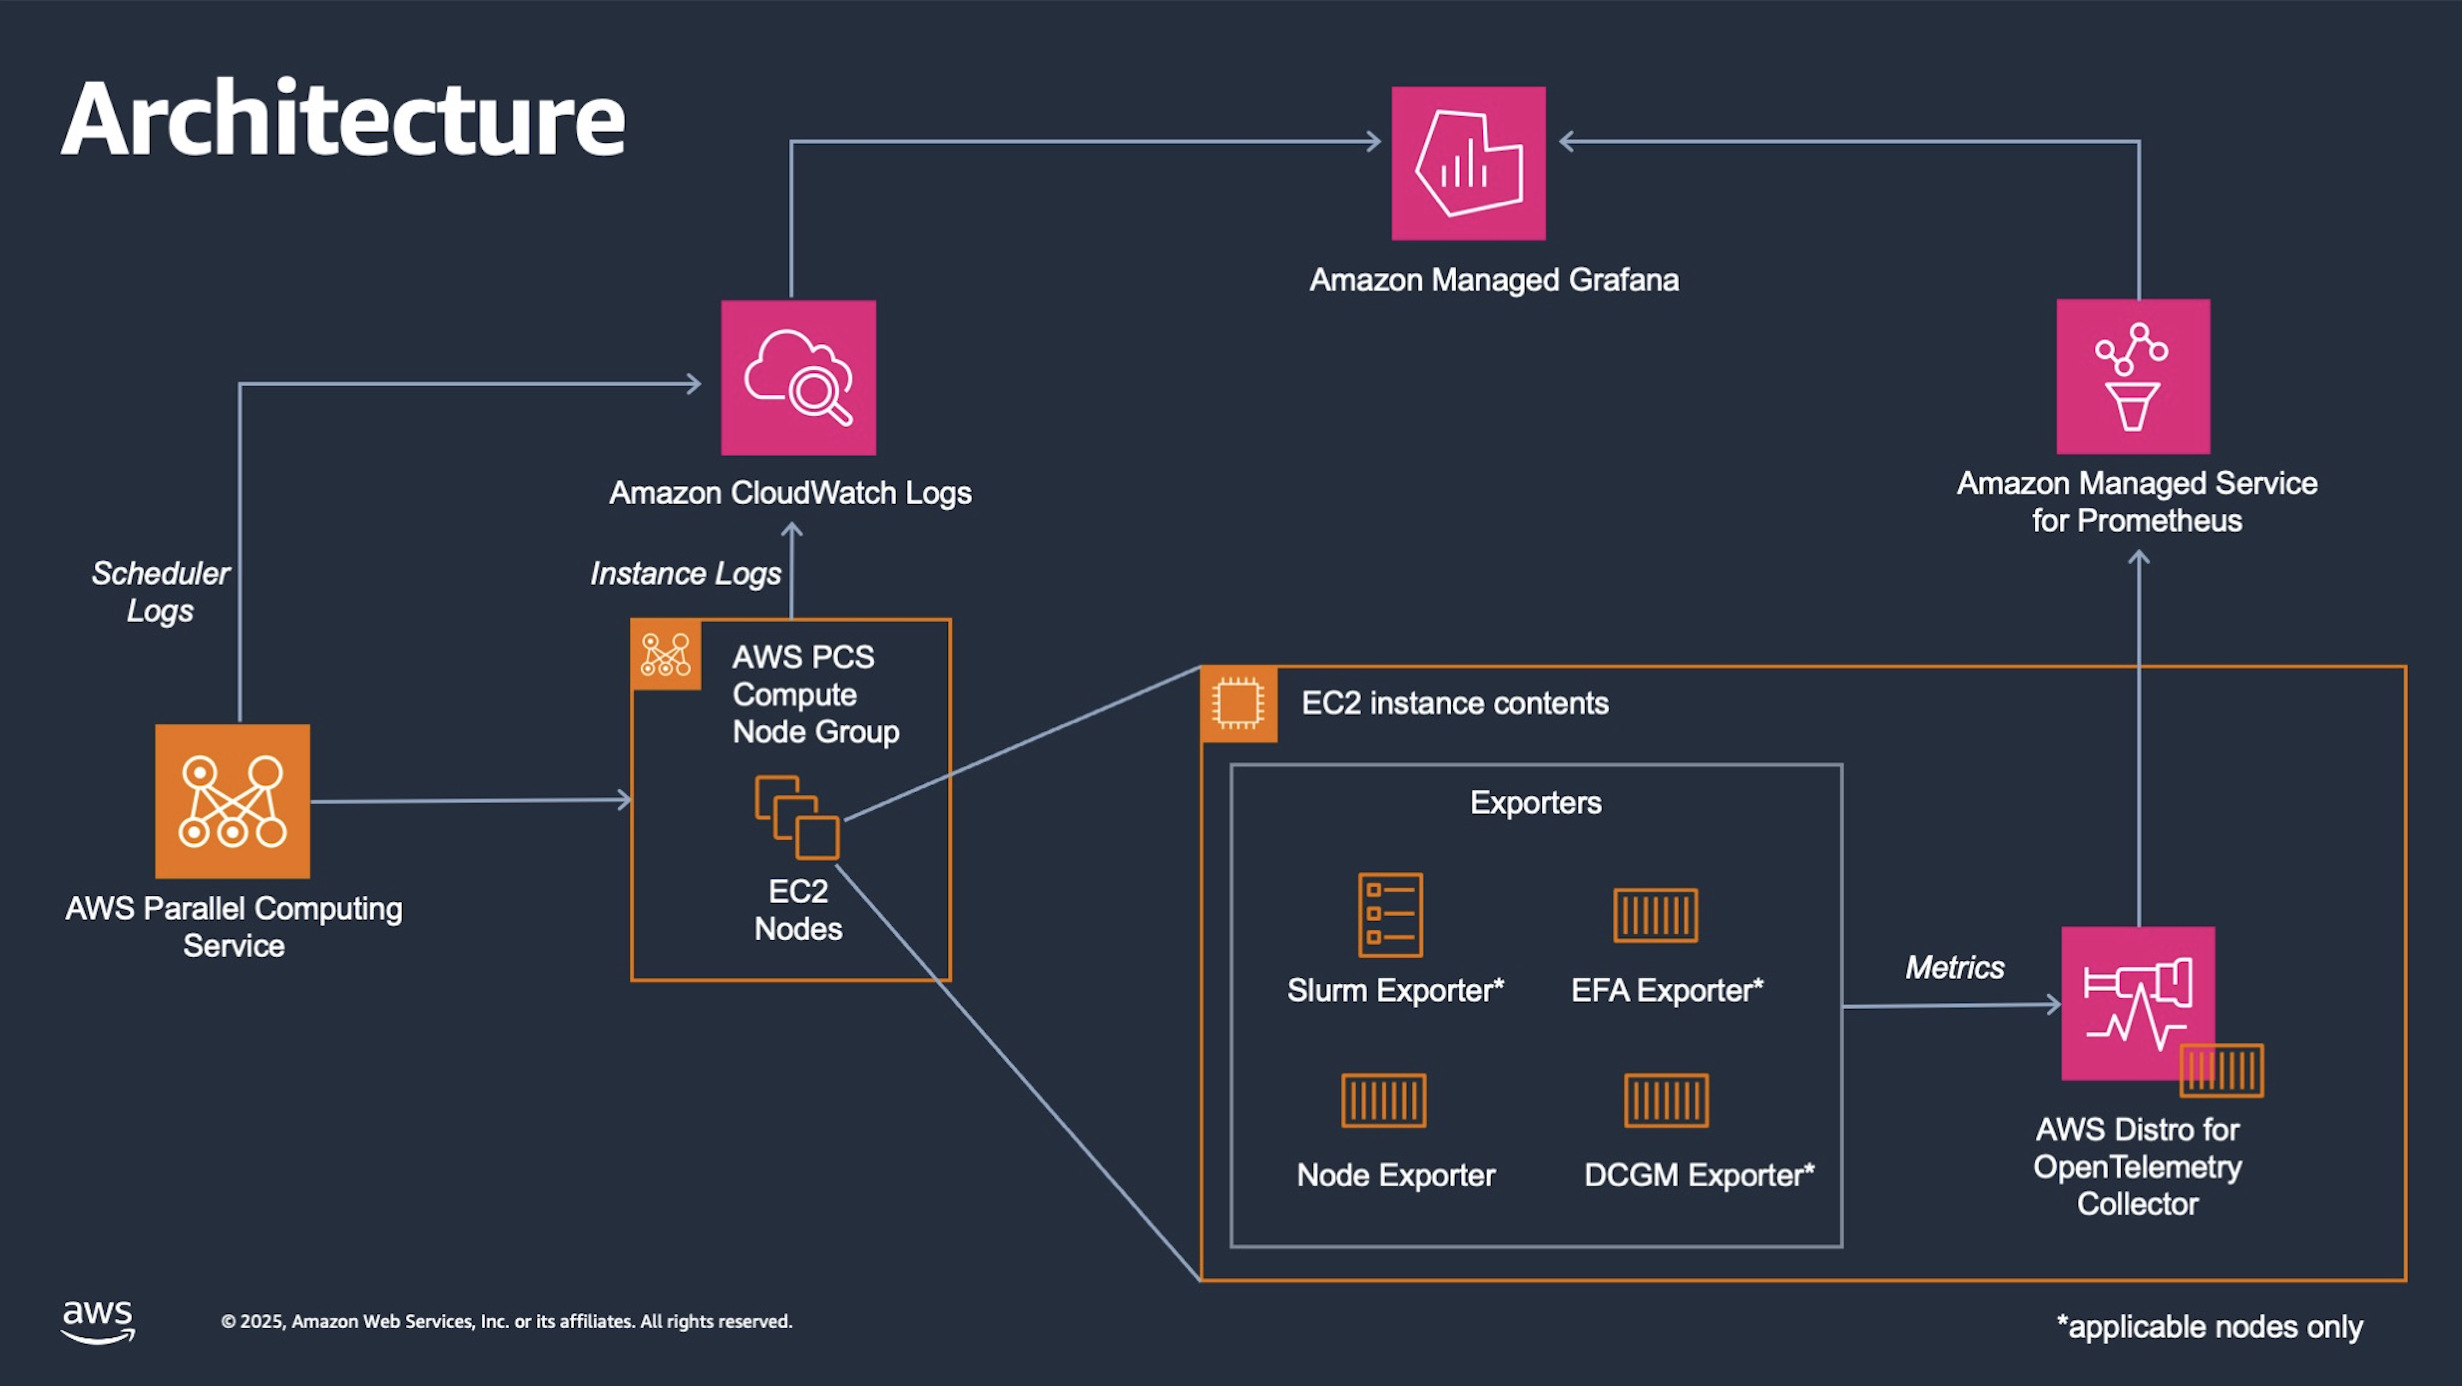
Figure 1 – Observability solution architecture.
The solution uses AWS Distro for OpenTelemetry Collector to obtain data from Slurm exporter, EFA exporter, Node Exported, and DCGM exporter. This data is sent to Amazon Managed Service for Prometheus, which is then displayed in Amazon Managed Grafana. AWS Managed Grafana also pulls data from Amazon CloudWatch Logs for detailed information on the instances.
The entry dashboard provides users an overview of their cluster with some basic information (Figure 2). This dashboard provides information on the total number of CPUs available, allocated, Idle or in other Slurm job states.
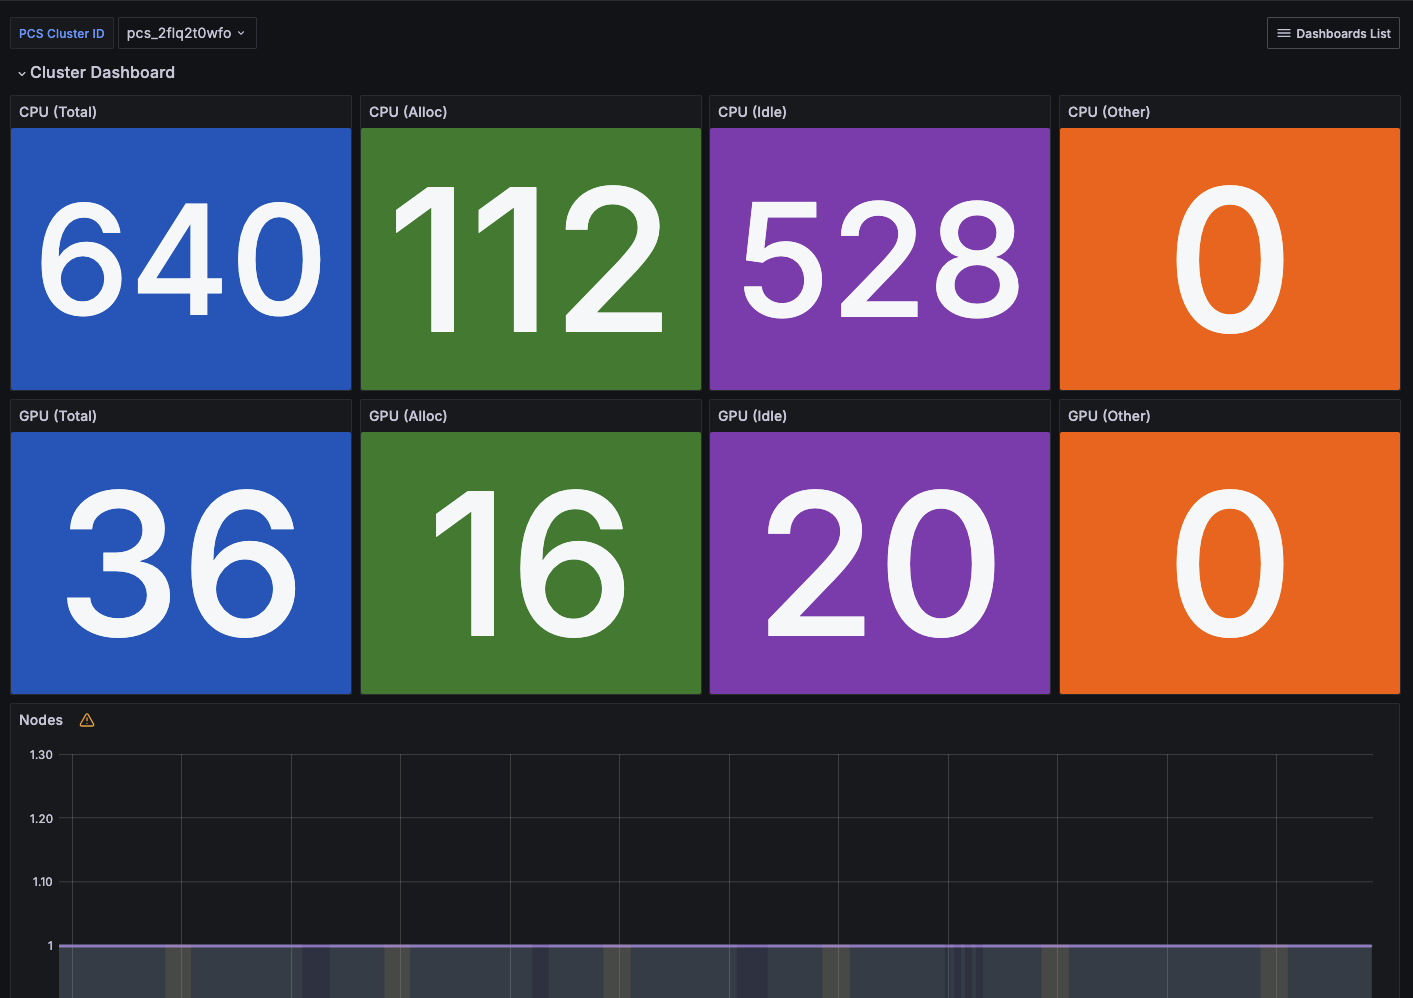
Figure 2. Dashboard summarizing cluster status.
Using the Dashboard List in the upper right corner, users can navigate to additional dashboards that provide detailed information on Jobs, Nodes, GPUs, Slurm, Amazon FSx for Lustre, Logs, Partitions, and Elastic Fabric Adapter (EFA).
The Jobs Dashboard (Figure 3) provides insights into jobs running in the cluster. Users can view details on running instances along with metrics for CPU, memory, and disk utilization.
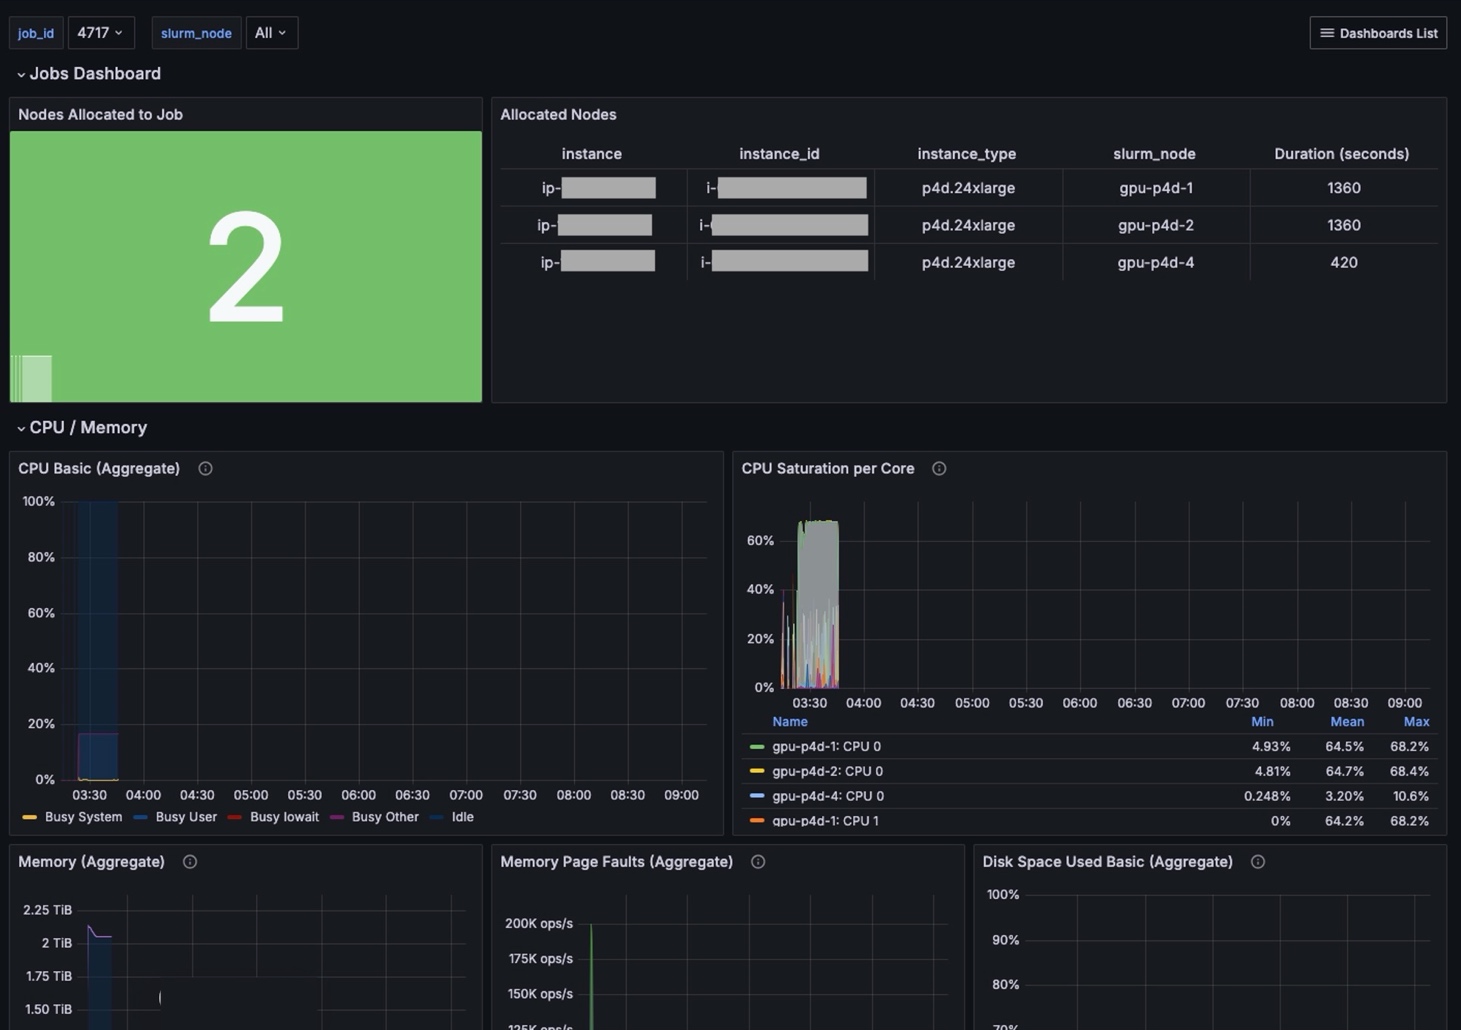
Figure 3. Dashboard summarizing job status and cluster resource use.
The NVIDIA GPU Dashboard (Figure 4) provide insights into NVIDIA GPUs in the cluster. Users can view metrics, such as GPU load and consumed memory.
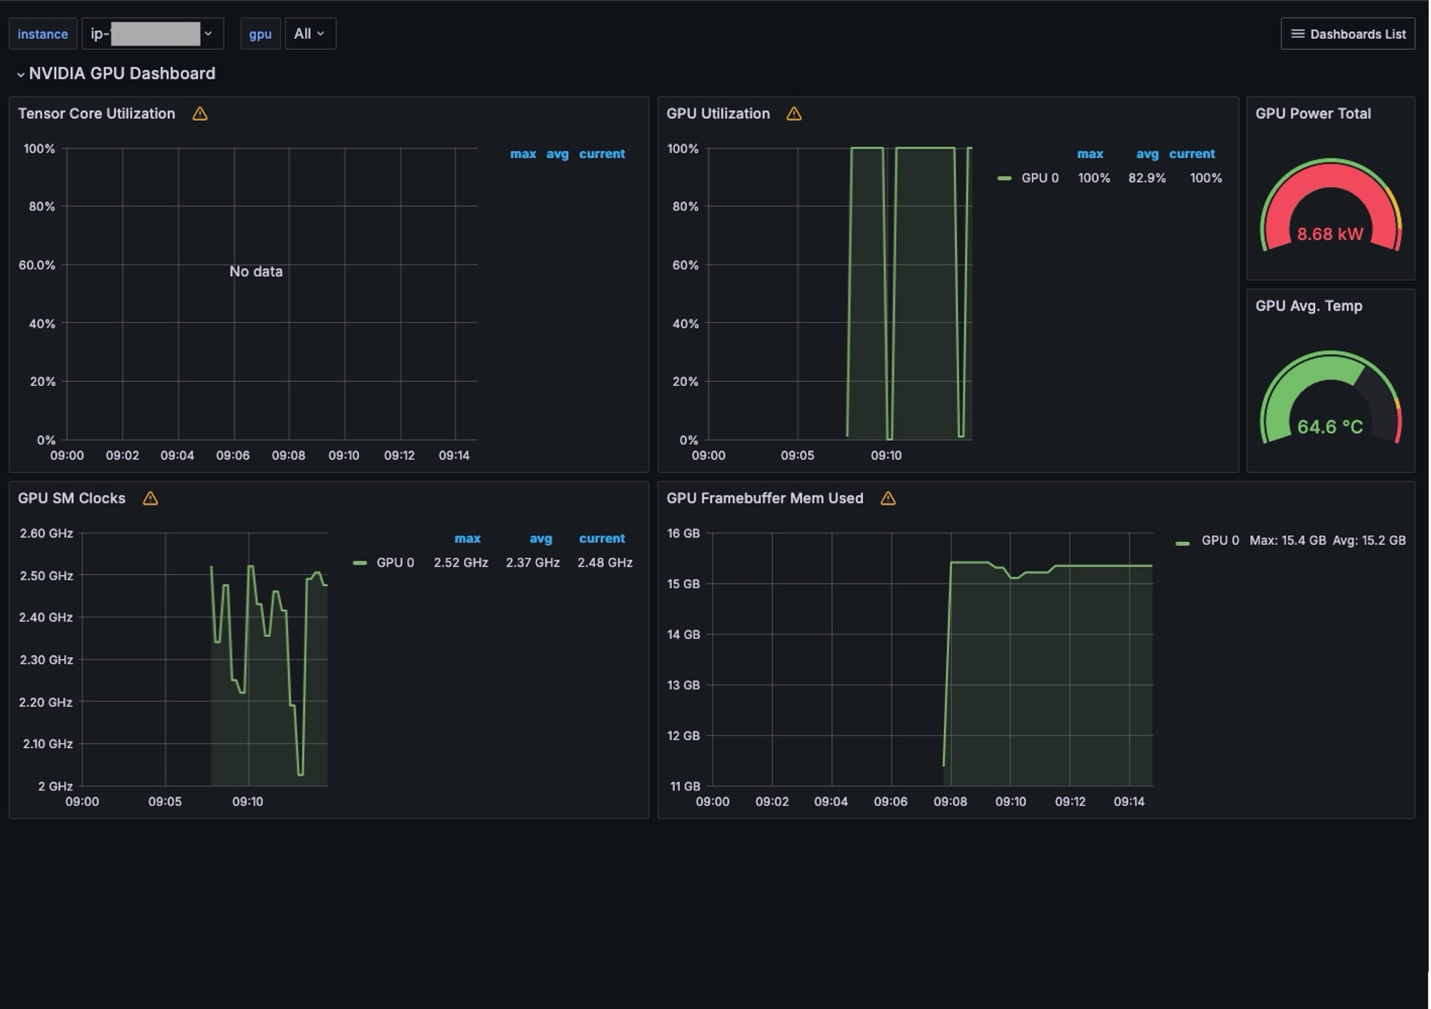
Figure 4. Dashboard summarizing NVIDIA GPU use in the cluster, The Logs Dashboard (Figure 5) provide a searchable view of different logs associated with the cluster. It reports log events and a timeline when these events occurred.
The Logs Dashboard (Figure 5) provides a searchable view of different logs associated with the cluster. It reports log events and a timeline when these events occurred.
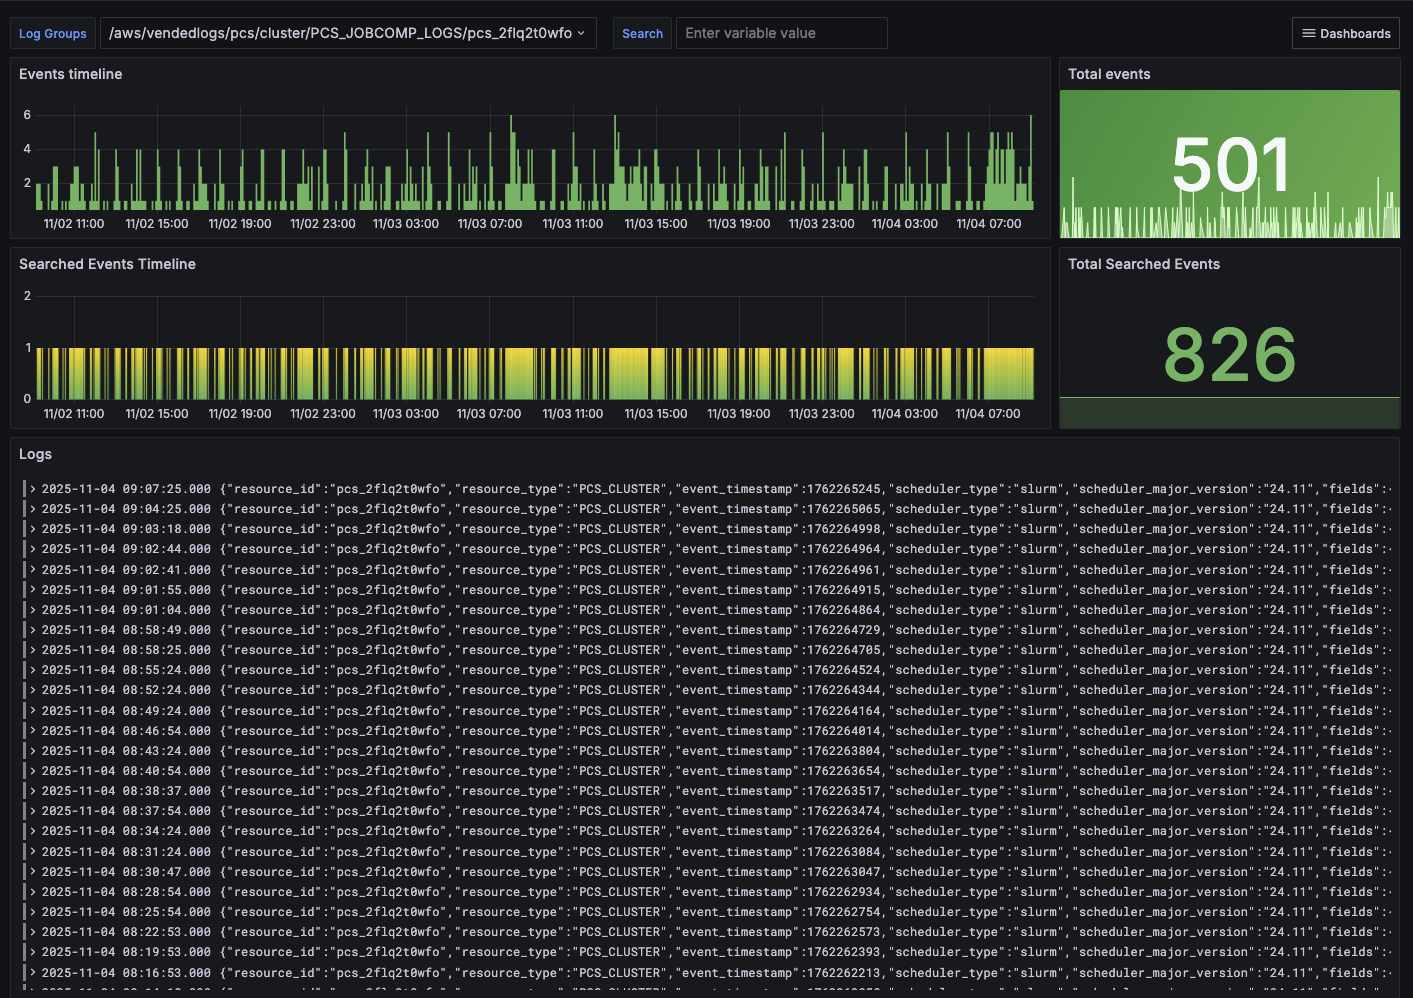
Figure 5. Dashboard summarizing different logs associated with the
The Partitions Dashboard (Figure 6) provides insights for Slurm partitions. Users can select a specific partition and view partition details, such as allocated instances, job history, and pending jobs.
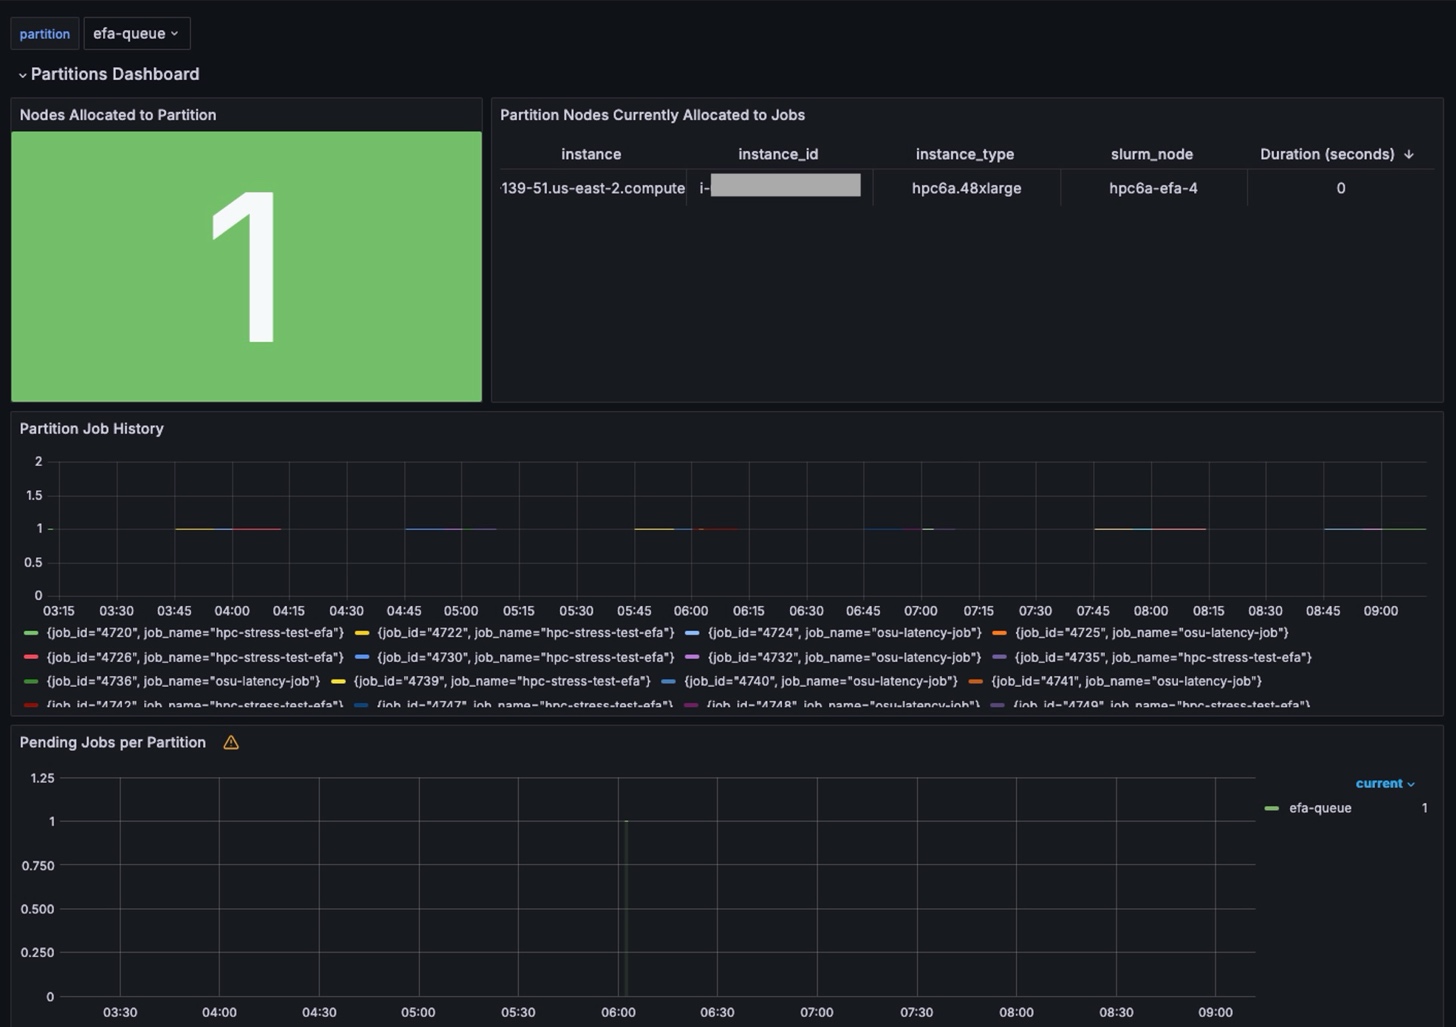
Figure 6. Dashboard summarizing Slurm partitions.
One of the most requested dashboards was for EFA. This dashboard displays what nodes are running EFA and provides performance information for users to verify their configuration and performance. The EFA Dashboard provides insights into EFA metrics, including device details, processed traffic, RDMA reads/writes, and dropped packets.
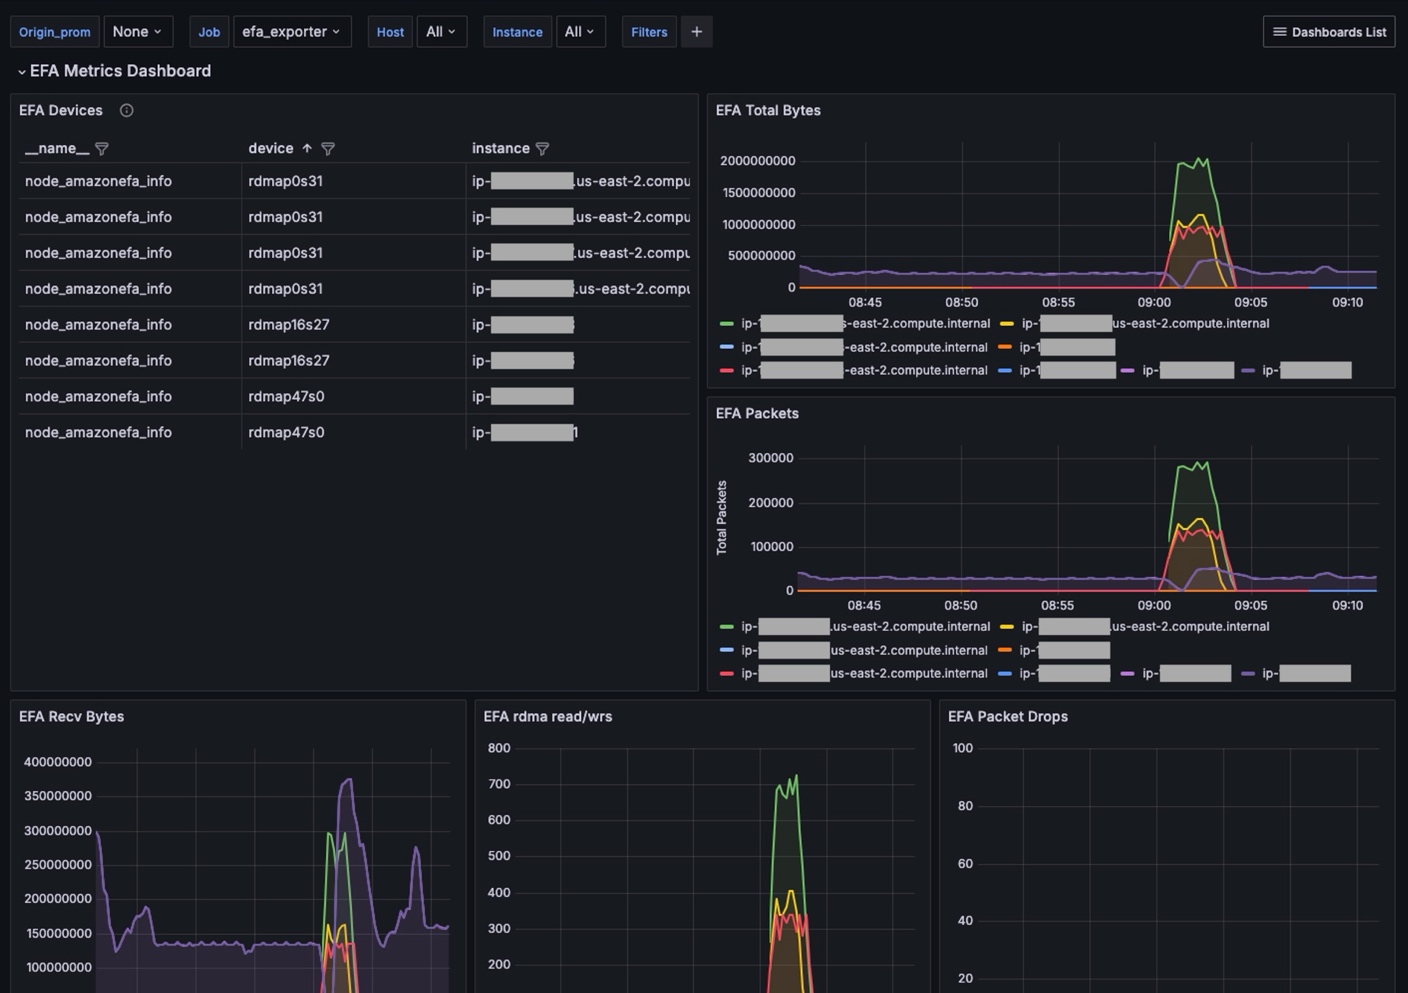
Figure 7. Dashboard summarizing EFA metrics.
Conclusion
The observability solution for AWS Parallel Computing Service represents a significant advancement in HPC monitoring capabilities. By combining Amazon Managed Grafana with Amazon Managed Service for Prometheus, this monitoring framework delivers the real-time visibility that HPC administrators need to optimize their computing environments.
Key benefits of this solution include:
- Reduced time to resolution for performance issues through centralized monitoring
- Improved resource utilization with detailed visibility into compute, storage, and network performance
- Enhanced operational efficiency through automated data collection and intuitive visualizations
- Cost optimization by identifying underutilized resources and performance bottlenecks
As HPC workloads continue to grow in complexity and scale, having comprehensive observability becomes increasingly critical. This monitoring solution empowers organizations to maximize their AWS Parallel Computing Service investments while maintaining the performance standards that modern research and computational workloads demand.
To get started, you can download the solution for the observability solution for your AWS Parallel Computing Service environment at the following link: https://github.com/aws-samples/aws-hpc-recipes/tree/main/recipes/pcs/observability_for_pcs