AWS for Industries
Graphing the utility grid on AWS
The high cost of grid failure
When electricity goes out, our life activities stop. When this happens, utilities have the responsibility to quickly triage the situation, then formulate and carry out a response while customers are inconvenienced. Danger rises and costs pile up. Keeping the power on is not a simple task without multiple core systems used in power grid management. These systems are often siloed and flood today’s utilities with data.
Grid operators are frequently looking for ways to improve grid situational awareness and improve operation efficiency using advanced analytics and artificial intelligence / machine learning (AI/ML) capabilities for outage triage and restoration planning, outage prediction, load forecasting, storm forecasting, and the calculation of repair depot stocking levels ahead of the forecasted storms. To deliver such solutions, the ability to combine multiple sources of data into a single repository to drive analytics and visualization is a must-have. In an electric utility these systems include but are not limited to the following:
- Business systems, such as customer information systems (CIS) and enterprise asset management (EAM)
- Work ticket and workforce management data, often generated by field mobile devices
- Grid operational technology (OT) systems, such as supervisory control and data acquisition (SCADA), smart metering or advanced metering infrastructure, distribution management systems (DMS), and electric management systems
- Outage management systems (OMS)
- Geographical information systems (GIS), which provide the physical location of grid assets and how they are connected
- External data, such as weather and traffic
- Social media data, some of it geotagged
Most of the systems above are still deployed on premises and operated by the utility. These systems collect, produce, read, and act on important data used to monitor and operate the grid. Unfortunately, these systems were not designed with interoperability in mind, and as a result, adding a new module from any one system vendor for cross-system reporting, analytics, forecasting, and operational simulations is often problematic. However, a cloud-based fabric can serve as the foundational architecture to augment grid management systems with advanced capabilities such as data lakes and AI/ML that can deliver these capabilities at great scale and speed while also reducing the maintenance and support costs of an already complex IT and OT environment.
A grid analytics foundation includes three areas:
- Grid network model
- Collection of sensor and measurement data
- Analytics and simulation
In the remainder of this blog post, we are going to focus on the grid network model topology because it’s a foundational and key component for delivering grid analytics solutions.
What is the grid network model?
The “network model” in a grid analytics solution provides the logical data view of the grid components and the connectivity between them, which make up the physical grid environment, such as the electrical grid example in Figure 1 below. This is also known as the grid “topology.”
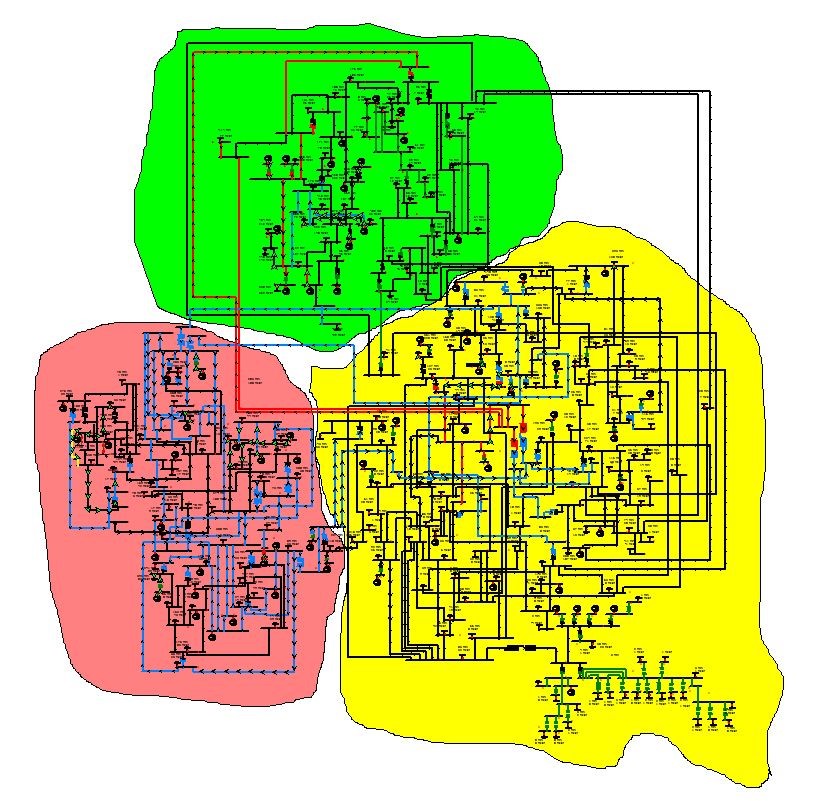
Figure 1: Example of an IEEE electrical grid diagram spanning three operating regions, containing 69 generators, 60 load tap changers, 304 transmission lines, and 195 loads
Constructing a grid network model will involve creating the topology model itself and then enriching it with data integrated from multiple other sources. The primary source for the model is the GIS, which manages asset topological data (what it is, where it is on earth, and what it is connected to). In electric utilities, a GIS system usually contains both the “as designed” and the “as built” versions of the grid topology and can include assets such as power generation feeds, cables, poles, substations, transformers, breakers, switches, and electric meters. Another key data source is the EAM system, which holds the majority of the nongeospatial attribute data about the asset (such as make, model, serial number, cost data, and test and maintenance records). Customer data can be supplied by the CIS.
The “as operated” view of the grid can be provided by the DMS or similar SCADA systems. And metering data can be supplied by one or more metering systems.
After the data sources have been ingested and processed into a network model, analytics, AI/ML, and visualization work can proceed, as depicted in Figure 2 below:

Figure 2: Data flow of heterogeneous data sources used for grid modeling and analytics
Why use a graph database?
When looking at a logical model of the grid (Figure 1), you can see it consists of a set of individual entities and multiple connectivity points and routes. What defines these entities is not only their own characteristics but also their relationships with other entities in the grid. These relationships are multiple, complicated, and dynamic. They also have many possible permeations according to the “as operated” state of the grid and represent what is known as a “highly connected data set.”
This is where a graph database is useful, if not essential, because it is the only type of database that can store billions of these complex relationships and support millisecond computation and search against them. It is this highly connected data structure that is commonly referred to as the “graph.” The main difference between a graph database and relational databases is the way that the relationships between the entities are modeled and stored. A graph database is optimized to store and query the relationships between individual data entities. These relationships are stored at the individual record level and can change dynamically—exactly what you want in order to depict and query the state of dynamic grid device connectivity. Relationships and attributes can be added as needed, without needing to model them in advance. In a relational database, relationships must be predefined in precisely modeled tables to relate one entity to another. Relationships and attributes cannot be added or changed on the fly.
Before we go further, some basic definitions are in order:
- A graph is made up of nodes (vertices) and edges (relationships).
- A node, or vertex, is the main data entity in a graph. You can think of them as rows in a relational database.
- Edges link two vertex objects; they hold the relationships between them. These would be foreign keys in a relational database. Along with its property objects, an edge has both a direction and a label. The direction determines which vertex is the tail vertex (out vertex) and which vertex is the head vertex (in vertex). The edge label determines the type of relationship that exists between the two vertices.
- Labels: Edge labels are a semantic representation of relationships in the graph. In Amazon Web Services (AWS) service Amazon Neptune—a fast, reliable, fully managed graph database service—edge labels are unidirectional, going from one node label to another node label. For example, “Controlled by” and “Controls” would be the two unidirectional labels applied to the edge between a relay node and a remote terminal unit node.
- Properties: key-value pair attributes stored within nodes or edges.
A graph database puts connections and relationships at the heart of its approach. The results are a purpose-built data store meant to answer questions about the relationships in an effort to understand what’s connected to what. Figure 3 is a high-level depiction of connectivity in the electrical grid.

Figure 3: A depiction of grid assets and their connectivity
The graph of the grid network model contains various kinds of vertices, including breaker, disconnecting switch, transformer, bus, grid connection point, and outlet cable. Understanding these relationships is critical to perform upstream and downstream searches. This is where you can search a network using conditional searches for use cases, such as what nodes in the grid are under power or energized, as seen in Figure 4 below.
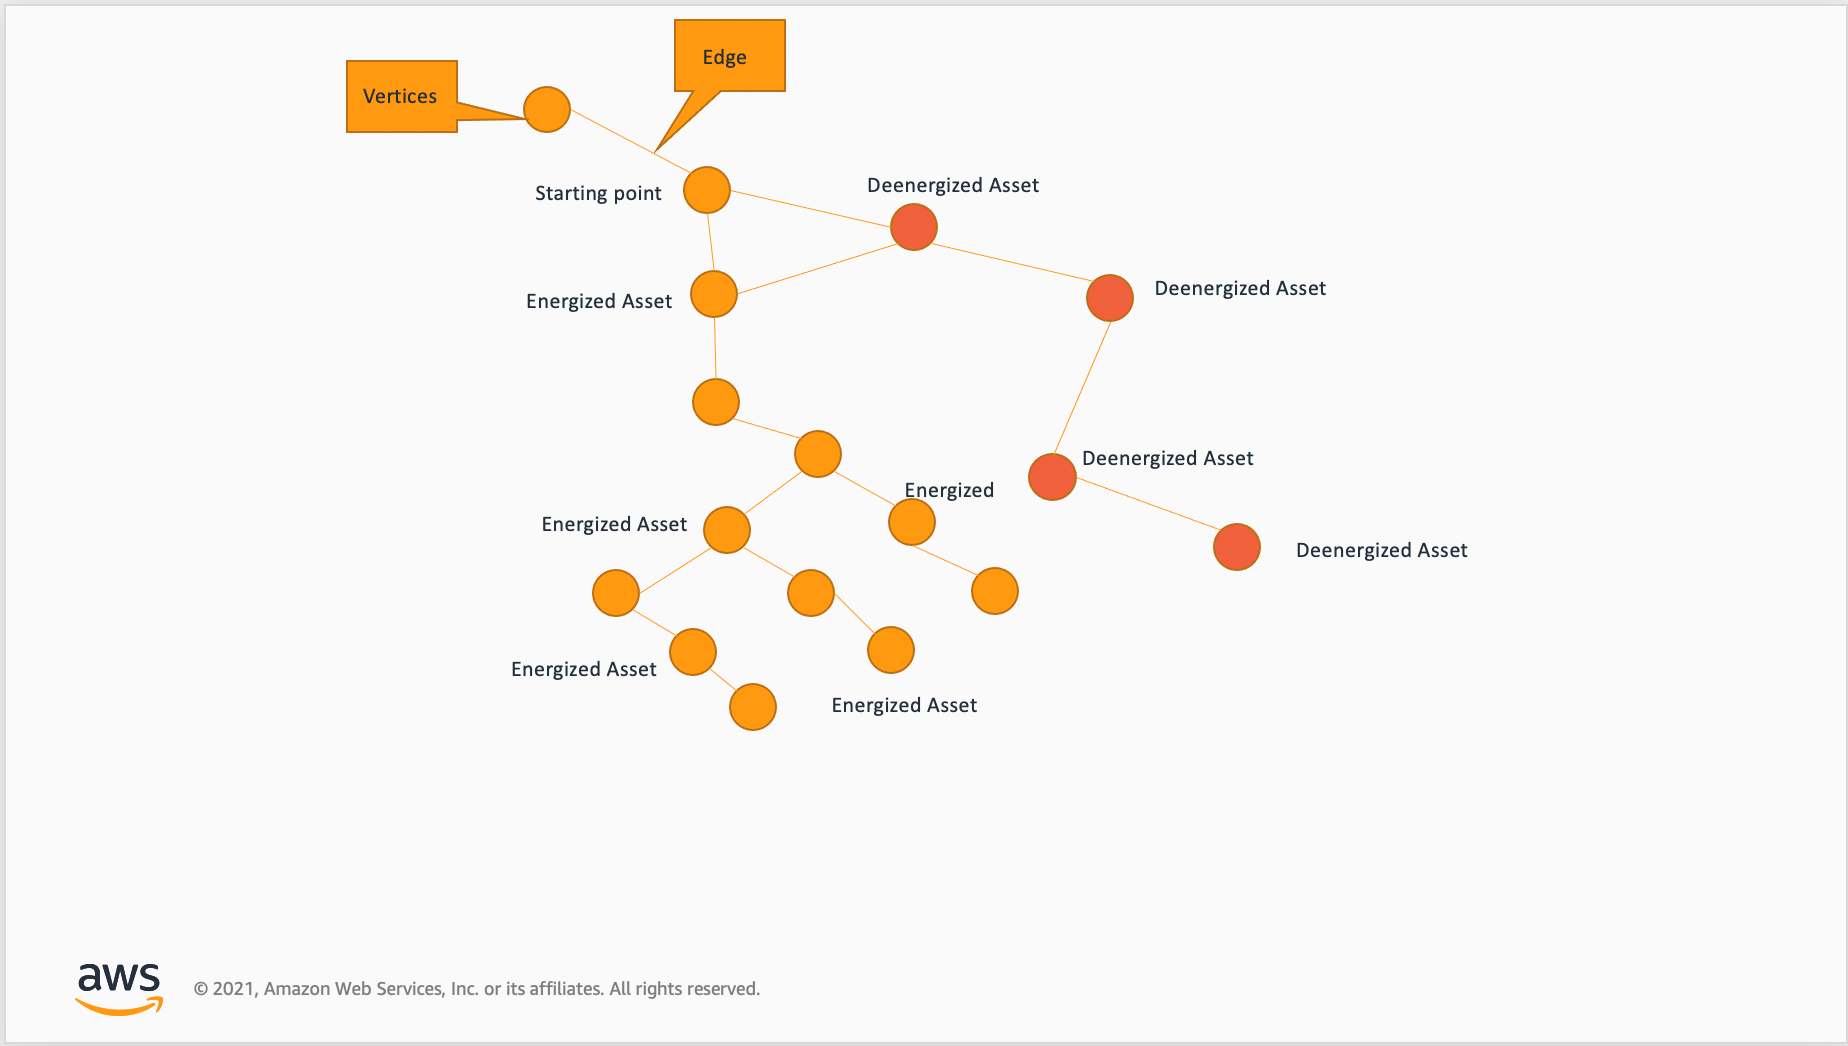
Figure 4: Shows a conditional topological search. In the end, this process returns all the paths and nodes that are energized for upstream and downstream tracing.
The ability to perform a topological trace outside the grid operational systems (for example, OMS or DMS) is foundational for grid analytics. Because graph databases are purpose built to answer questions about relationships, a network topological trace upstream and downstream would be used in every use case where there is a need to know the relationship of a node in the grid. Being able to search the network model is critical for “what if” grid analytics scenarios such as the following:
- Which customers will be affected if this asset fails?
- What upstream/downstream assets are at risk if this asset fails?
Understanding the role of Amazon Neptune
Some utilities use the Common Information Model (CIM) standards for exchanging information. The CIM standard is expressed in Extensible Markup Language (XML) and Resource Description Framework (RDF) schemas. However, exchange formats between systems can vary because CIM RDF is a logical model that can be implemented in software in many different forms. This is because the relationships between data entities matter just as much as the data itself, and the results are dependent on the strength, weight, or quality of relationships. This is where we would want to use Amazon Neptune. Amazon Neptune is a fast, reliable, fully managed graph database service that makes it easy to build and run applications that work with highly connected datasets. The core of Amazon Neptune is a purpose-built, high-performance graph database engine. This engine is optimized for storing billions of relationships and querying the graph with millisecond latency. Because Amazon Neptune supports the popular graph query languages Apache TinkerPop Gremlin and W3C’s SPARQL Protocol and RDF query language, you can build queries that efficiently navigate highly connected datasets. Using Amazon Neptune, you can power graph use cases such as recommendation engines, fraud detection, knowledge graphs, drug discovery, and network security.

Figure 5: Amazon Neptune high-level architecture
In our example below, we were able to load a sample circuit as an RDF graph into Amazon Neptune using the bulk loader from Amazon Simple Storage Service (Amazon S3) that was created by the extract, transform, load (ETL) pipeline from AWS Glue. Amazon S3 is an object storage service offering industry-leading scalability, data availability, security, and performance, and AWS Glue is a serverless data integration service. As mentioned above, there are several systems that collect, store, and maintain equipment data from the grid. With the right data tools and process, a graph of the network is constructed with different objects and properties. The result is an electrical network topology that describes the physical connections between electrical devices to power analytics and simulations. The purpose of network model services for grid analytics is to provide topological search functions on connectivity. To use this service, a graph model is created in the graph database according to the design of the power grid. The SPARQL below in Figure 6 shows an RDF graph from our ingested XML. RDF graphs contain statements of the form (subject, predicate, and object) known as “triples.” A triple can be used to associate a subject with a value or define a relationship between two subjects. In our asset management use case in Figure 4, we had a failed substation asset that caused an outage. It was caused by a distribution transformer. Figure 6 below shows RDF triples so we can learn a bit about the structure of the graph.

Figure 6: Amazon Neptune notebook SPARQL or Gremlin query
In the International Electrotechnical Commission (IEC) CIM standard, Terminals and Connectivity Nodes are used to define component interconnections. Conducting equipment can have one or more Terminals based on the CIM schemas. In the CIM model, electrical components (for example, breakers, loads, and lines) do not associate directly with each other. In the case above, we have our SPARQL query graphed as a relationship of a logical association of types of conducting equipment with a common link: a ConnectivityNode_X283383 with surrounding Terminals. A SPARQL or Gremlin query to trace upstream and downstream from the DistributionTransformerWinding object would provide all objects that supply this source as well as some of the objects the source supplies. EnergyConsumers and DistributionLineSegment objects represent lines and downstream consumers associated with the failed distribution transformer.
Amazon Neptune also supports property graphs. As mentioned above in the definition section, labels and properties are used to assign unique identifiers and a set of key-value pairs, or properties, that characterize them. Utilities have the option to use CIM-compliant comma-separated values files (CSVs) in the Gremlin data format or the openCypher format. In the Gremlin and openCypher Formats, for data using the CSV format, you must specify the vertices, edges, nodes, and relationships in separate files, unlike in RDF. Given RDF’s inability to uniquely identify instances of relationships of the same type and qualify instance relationships without modeling changes, property graphs could be helpful to use. Because Amazon Neptune supports Gremlin, you can use powerful software patterns from graph traversals to satisfy use cases for topology, such as trace upstream, trace downstream, and find all relationships given grid asset “X.” Examples of these patterns include the following:
- Centrality
- Lowest common ancestor
- Shortest path
Graphing the grid on Amazon Neptune
Now that we have discussed the use case of how a graph database can be used, let’s discuss how we get there. There are many data sources involved, so data modeling is key. To ask questions to our graph database that will aid in our grid analytic use cases, we will need a data model that describes the domain.
Utilities have adopted the IEC standard CIM. Data experts and engineers supporting a utility’s transmission and distribution teams use IEC CIM standards (such as IEC 61968 and IEC 61970), which define the data supporting many of the business functions related to energy market data and network operations, including data acquisition, device control, trouble and outage management, planned outage scheduling, electrical network switching/reconfiguration, fault location, isolation, restoration for transmission, and distributions from an integration or data exchange perspective. To create network topology graphs that adhere to these standards, we will need data preparation, data transformation, and the graph database itself. To do this, we will use Amazon S3, AWS Glue, Amazon Neptune, and AWS Glue DataBrew, a new visual data preparation tool—as shown in Figure 7 below.

Figure 7: Using AWS Glue and Amazon Neptune to create a graph on the grid topology
Data Preparation
Both understanding and maintaining datasets are critical to creating an accurate representation of the grid. Using AWS Glue DataBrew, you can evaluate the quality of your data by profiling it to understand data patterns, detect anomalies, and correct them. You can connect to data directly in your data lake, data warehouses, or databases. AWS Glue DataBrew can also be used to automate data cleaning and normalization tasks by applying saved transformations directly to new data as it comes in from your source system. In Figure 8 below, we have ingested a CIM data file of an electrical circuit extracted from a GIS system.

Figure 8: AWS Glue DataBrew and profiling metrics of computer-aided design (CAD) circuit
You can use AWS Glue DataBrew to validate that each asset has the appropriate fields and properties that will be used to create graph edges and vertices that will be loaded into Amazon Neptune. It’s important to validate that each object has the correct properties. AWS Glue DataBrew will help with this.
Data Transformation
When ingesting data from multiple data sources, automated ETL and the cataloging of data are must-haves. AWS Glue is a fully managed ETL service that makes it easy for customers to prepare and load their data. Using AWS Glue, you can complete the pivotal task of preparing source data and loading it into the Amazon Neptune graph database. You can create and run an ETL job with a few clicks in the AWS Management Console, which provides everything you need to access and manage the AWS Cloud—in one web interface. You simply point AWS Glue to your data stored on AWS (typically Amazon S3), and AWS Glue discovers your data and stores the associated metadata (for example, table definition and schema) in the AWS Glue Data Catalog. Once cataloged, your data is immediately searchable, queryable, and available for ETL. Using AWS Glue, you can visually compose data transformation workflows and seamlessly run them on the Apache Spark–based serverless ETL engine of AWS Glue. Figures 9 and 10 below show the AWS Glue visual editor for creating flows of the ETL job. The visual editor can read all the extracts from grid resources and create a CSV file, which will be loaded into the Amazon Neptune graph database to create a property graph.

Figure 9: Source system file extracts to be used in network topology graph
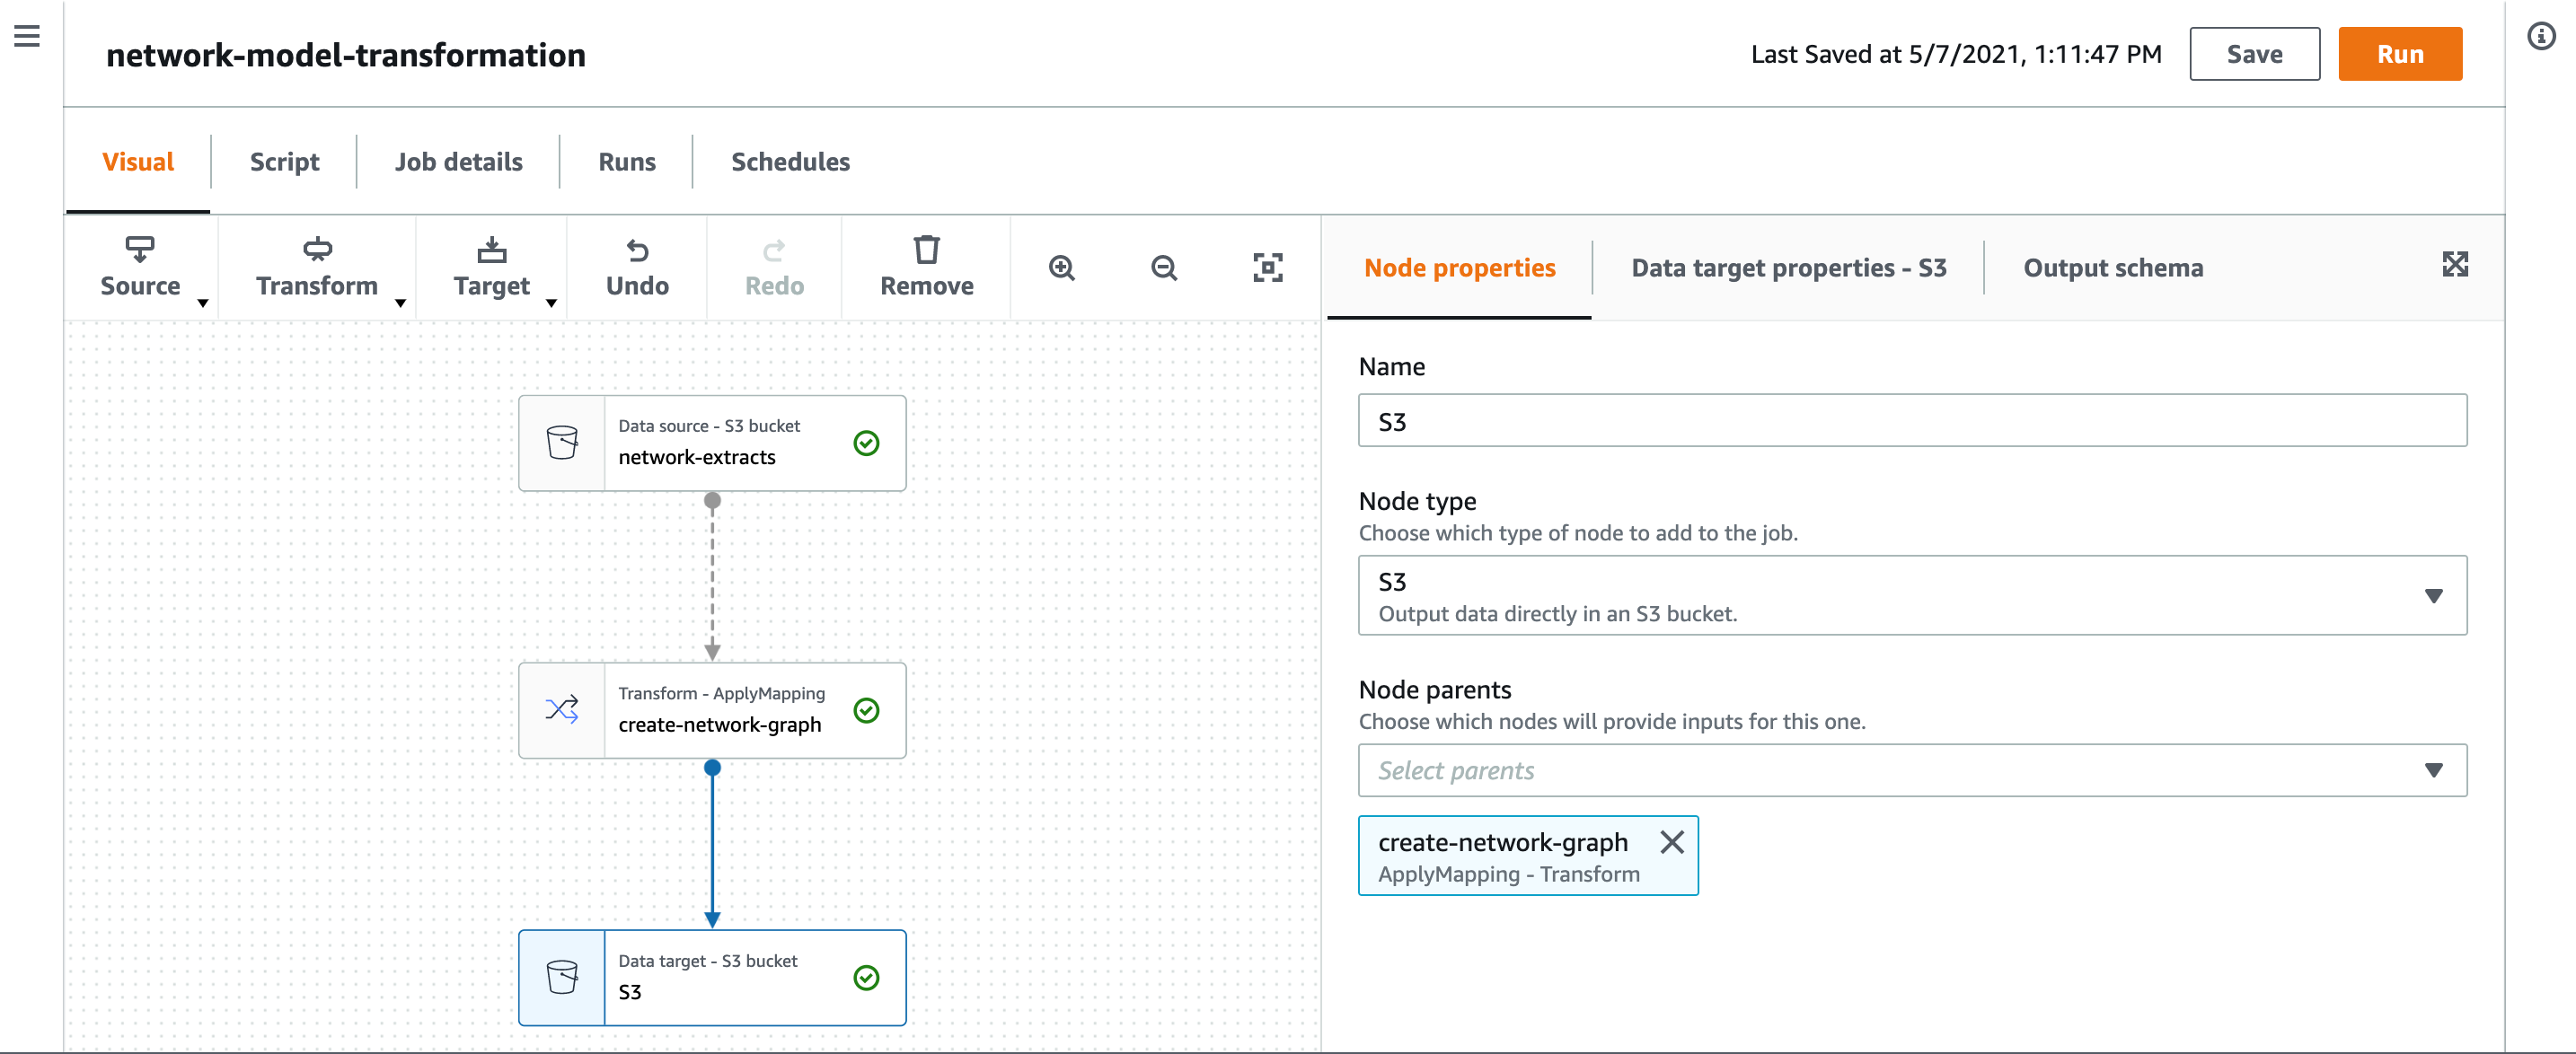
Figure 10: Figure shows a visual flow of creating the edges and vertices for the network model graph.
Using AWS Glue, you can enhance the daily data pipeline to include the connected topology store and curate the data and publish it in the data lake or Amazon S3. AWS Glue has built in transforms such as ApplyMapping, RenameField, Relationalize, FlatMap, and others. AWS Glue jobs in this scenario contain the business logic that will be responsible for maintaining the graph from the files collected from siloed systems in the grid. The AWS Glue jobs will implement business rules that will search each source system and extract and create relationships that can be used in graphs. These business rules could search for foreign keys between systems to search text in blobs to create relationships in the graph. The output should be two files, edges, and nodes.
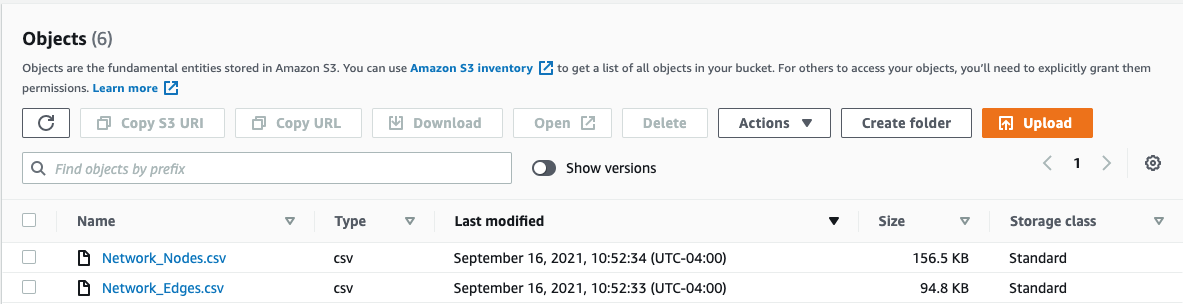
Figure 11: Figure shows CSV created by AWS Glue jobs that will be loaded into Amazon Neptune
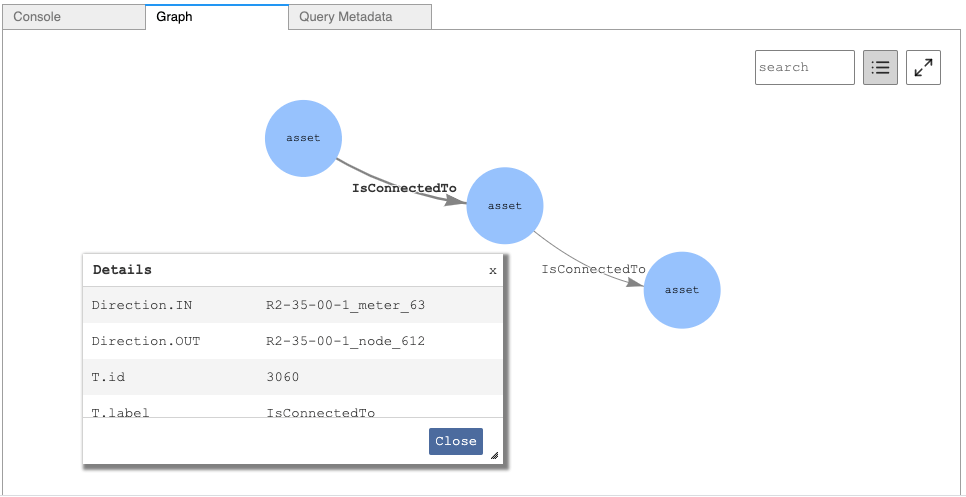
Now that we have loaded data into Amazon Neptune, let’s look at a scenario where our smart meter network joined with the distribution network for analytics. We could run a Gremlin query to help connect the meter to a load on the distribution network. Our AWS Glue job created a label called “asset.” As we use the details button in Amazon Neptune notebooks, we can see the middle asset is a meter. The AWS Glue job also created a label form called “IsConnectedTo” in the edges file.

As we click on each vertex, we are able to see what the connection is in and out of the meter.
To model the grid for analytic applications, you have to be able to do the following:
- Navigate sophisticated or complex structures.
- Quickly and flexibly link or connect items.
- Answer questions based on an understanding of how things are connected—both the semantics of the relationships between entities and the various strengths, weights, or qualities of these relationships.
We have demonstrated that using AWS can help make this happen by providing the services to wrangle and transform connected datasets.
Delivering better, faster decisions
To deliver grid-based analytics, the representation of the network model is a must-have. The grid network evolves over time, and it’s important to have a data store that can support this dynamic without significant structural modifications in the database to fulfill the demands for the future development of smart grid analytic applications. A graph database with distributed architecture is a viable solution. Using AWS alongside Amazon Neptune supports this solution and provides the services that bring together multiple sources of data to help utilities and other asset-intensive industries deliver better, faster decisions. For more information visit AWS for Industrial, Energy & Utilities