AWS for Industries
Multi-Agent Multimodal Data Analysis on AWS – Part 1: Data Governance and Visualization
Introduction
Healthcare and life sciences (HCLS) organizations are generating large volumes of patient-level data spanning genomic, clinical, medical imaging, and other modalities. While this multimodal data offers a comprehensive view that can improve patient outcomes, analyzing it at scale remains challenging. Each modality requires distinct storage infrastructure and domain-specific formats (FHIR for clinical records, DICOM for medical imaging, and VCF for genomic variants), making cross-modal querying and analytics difficult. Since traditional tooling is not built to handle these heterogeneous data types, there is a growing need for data governance and a multi-agent orchestration layer that provides an intuitive way for end users to discover this data and perform complex analytics across the modalities.
In this two-part blog series, we show how you can build agents that interact with multimodal HCLS data, making it easier for end users to query, explore, and ask questions of the data. We build on previous guidance for multimodal data analysis, which demonstrates how to store, query, and analyze clinical, genomic, and medical imaging data using purpose-built AWS services. In this updated series, we introduce a data governance layer with automated metadata capture and semantic discovery across modalities, and a multi-agent system where specialized AI agents connect to data stores and tools via Model Context Protocol (MCP) servers. This enables natural language querying and self-service analytics that accelerate time from raw multimodal data to actionable clinical insights. We also extend beyond patient-specific data by adding two external knowledge agents: a clinical trials agent that queries ClinicalTrials.gov and a PubMed agent that searches biomedical literature, so that answers can be grounded in both patient data and the latest published evidence.
In Part 1, we create a framework to ingest multimodal HCLS data into purpose-built AWS services, establish a unified, governed data catalog using Amazon SageMaker Unified Studio, and create interactive visualization dashboards with Amazon Quick. In Part 2, we build the multi-agent system using Amazon Bedrock AgentCore and Strands Agents SDK and train predictive models with Amazon SageMaker AI. To get hands-on experience with the framework described in this series, explore the accompanying code repository.
Use case and dataset
We consider cardiovascular disease risk evaluation as a use case to demonstrate the value of a multi-agent multimodal approach. In a real-world scenario, evaluating disease risk for a patient requires synthesizing insights across multiple specialties: clinicians reviewing medical history and treatments, radiologists analyzing imaging studies, and genomics specialists interpreting variant data. These assessments typically happen in silos and synthesizing them into a holistic patient view requires significant manual effort and coordination. For a multi-agent approach, we can implement this collaborative workflow by assigning specialized AI agents to each data modality and orchestrating them to generate a comprehensive, multimodal patient view.
We use the Synthea Coherent Data Set, comprising clinical data (FHIR R4 bulk data bundles covering demographics, encounters, diagnoses, procedures, medications, and insurance claims), medical imaging data (DICOM imaging studies), and genomic data (VCF files, human reference genome, and ClinVar annotations). All data is coherently linked across modalities for patients diagnosed with cardiovascular disease, enabling multimodal analysis and end-to-end validation of our multi-agent disease risk evaluation system.
Data governance
Data governance ensures data availability, integrity, security, and usability across an organization. In regulated environments, scientists and AI systems alike need to discover relevant datasets without navigating multiple portals, understand data provenance and quality before use, and request access through auditable workflows. For instance, without a governance layer, a computational biologist searching for “cardiovascular variant data” would need to know which specific Amazon Simple Storage Service Tables (Amazon S3 Tables) namespace or AWS HealthLake data store contains the relevant records and negotiate access separately for each.
Ingest and store data with AWS purpose-built services
As shown in Figure 1, different modalities of data are already acquired from external sources and stored in Amazon S3 in their individual folders. As the first step, ingest each data type from S3 into the appropriate purpose-built AWS service optimized for its format and access patterns. Load clinical data for about 1300 individuals in FHIR R4 format into AWS HealthLake via the FHIR API, which supports both bulk import and transactional operations. Import 300 DICOM imaging study files into AWS HealthImaging, which automatically extracts patient, study, and series metadata from DICOM headers and provides pixel-level access via the GetImageFrame API for downstream feature extraction. Load genomic variant data (VCF files) of 800 individuals and annotations (ClinVar) to Amazon S3 Tables in Apache Iceberg format, providing high-performance SQL access to variant-level data at scale. Services like AWS HealthLake and AWS HealthImaging handle ingestion and transformation automatically, producing analytics-ready data without custom ETL pipelines.
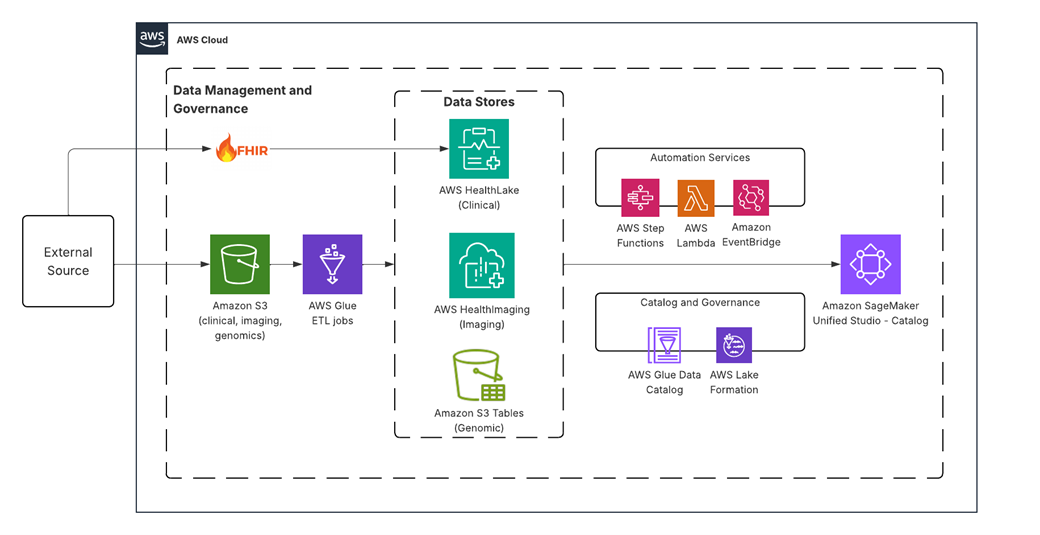
Figure 1: Architecture for multimodal data ingestion, storage, and governance. External data is ingested into Amazon S3, transformed via AWS Glue ETL jobs, and routed to purpose-built data stores: AWS HealthLake (clinical), AWS HealthImaging (imaging), and Amazon S3 Tables or AWS HealthOmics (genomic). Automation services orchestrate the pipeline while AWS Glue Data Catalog and AWS Lake Formation provide centralized metadata management and access control, all surfaced through Amazon SageMaker Unified Studio for unified cross-modal discovery.
Govern and catalog data with Amazon SageMaker Unified Studio
With multimodal data now stored across HealthLake (clinical/FHIR), HealthImaging (imaging/DICOM), and S3 Tables (genomic/Iceberg), the next challenge is making these heterogeneous assets discoverable, governed, and accessible to downstream consumers, including human analysts and AI agents. Amazon SageMaker Catalog, accessed through Amazon SageMaker Unified Studio, provides a unified governance layer that bridges these silos.
- Register multimodal HCLS assets in the catalog: Amazon SageMaker Catalog supports automated publishing of data assets through system asset types (GLUE tables, Redshift tables, and S3 object collections) as well as custom asset types that provide flexibility to define additional categorizations based on data modalities or organizational needs.
- Publish data assets: Share clinical data from AWS HealthLake as a Glue table via AWS Lake Formation shares and publish it to the catalog through a scheduled data source connection. Access variant and annotation data stored in Amazon S3 Tables via S3 Catalog (governed by Lake Formation) and publish it. Similarly, publish DICOM image files from Amazon S3 using the S3 Object Collection asset type.
- Attach useful business metadata: Table and column level descriptions can be either generated separately using subject matter expertise or models hosted on Amazon Bedrock. Additionally, SageMaker Unified Studio’s built-in AI agents powered by Amazon Bedrock can automatically analyze schema information, table and column names, etc. to create meaningful business metadata.
- Group related assets as data products: Package the clinical, imaging, and genomic data for the cardiovascular disease cohort as a single data product. Data consumers (scientists or AI agents) can discover and subscribe to the entire multimodal patient dataset as one unit, rather than requesting access to three separate assets.
- Enable governed access through subscription workflows: Follow a producer-consumer model where data consumers discover assets through natural language or metadata-filtered search (e.g., searching for “cardiovascular VCF data” or filtering by disease name). Consumers request subscriptions, which producers approve with optional row/column-level restrictions to protect PHI. Upon approval, consumers access data through pre-configured analytical environments: JupyterLab notebooks, SQL queries via Amazon Athena, or programmatically via MCP tool servers that our agents use, as shown in Part 2 of this blog series.
- Establish a business glossary for HCLS terminology: Create a business glossary within SageMaker Catalog to standardize terminology across teams, defining terms like “Patient Cohort”, “Variant of Uncertain Significance (VUS)”, “Imaging Study”, and “FHIR Bundle”. Attach glossary terms to assets so that a radiologist searching for “cardiac imaging” and a data scientist searching for “cardiovascular DICOM studies” discover the same governed assets.
- Track data lineage and provenance: Following the AWS Well-Architected Life Sciences Lens recommendations, enable automatic lineage tracking to maintain a clear, auditable history of data origin, movement, and transformation. This supports regulatory compliance and reproducibility of AI-generated clinical insights.
With the multimodal data assets now cataloged and governed, you can use them for tertiary analysis, such as building visualization dashboards for population-level insights or training predictive models for patient outcomes, as shown in Figure 2.
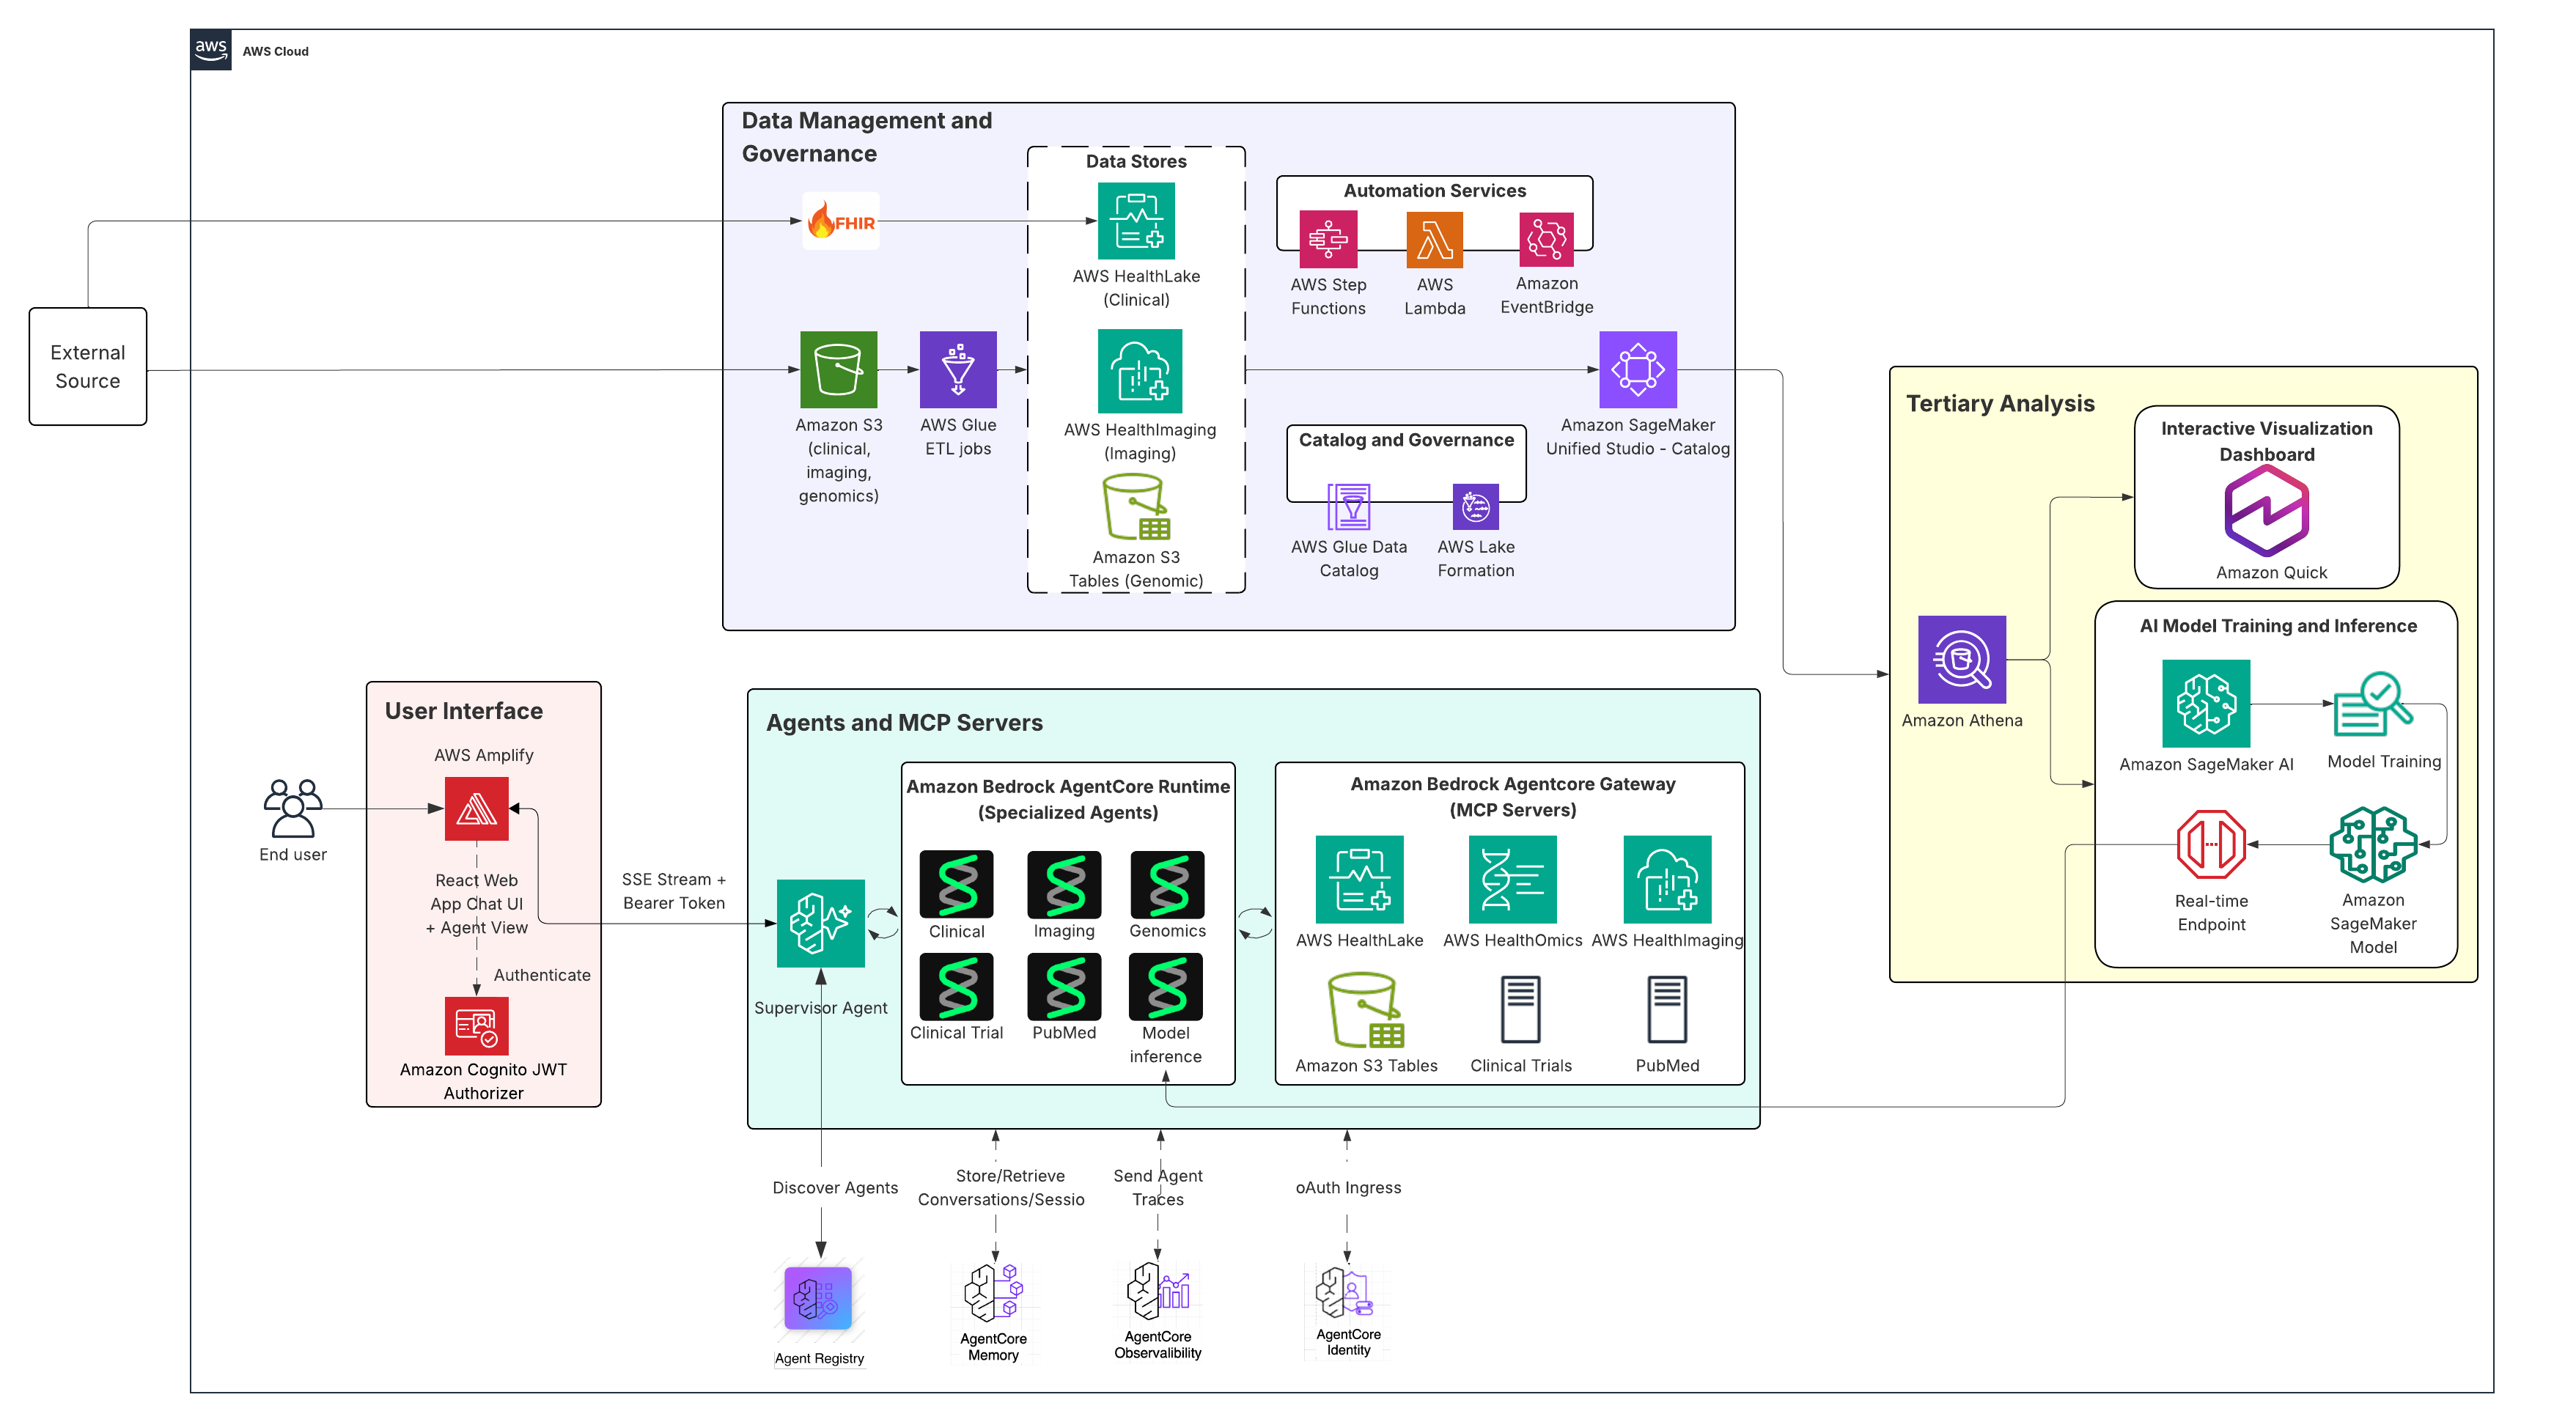
Figure 2: End-to-end architecture showing multi-agent multimodal data analysis on AWS. Clinical, imaging, and genomic data are stored in purpose-built services (HealthLake, HealthImaging, S3 Tables) and governed via Amazon SageMaker Unified Studio. Specialized agents built with Amazon Bedrock AgentCore perform cross-modal synthesis via MCP Servers, coordinated by a supervisor agent. Downstream tertiary analysis leverages Amazon Athena, Quick, and SageMaker AI for querying, visualization, and model training and inference.
Data Visualization
Build interactive data visualization dashboards with Amazon Quick
Effective disease risk evaluation requires unified visibility into multimodal patient data, at both the individual patient level for real-time analysis and at the population or cohort level to identify trends, stratify risk, and guide evidence-based care pathways. Interactive dashboards that bring together clinical, genomic, and imaging data in a single pane of glass can enable clinicians, bioinformaticians, and radiologists to move from siloed analysis to holistic, actionable insights. To build these dashboards, navigate to AWS Lake Formation console and grant permissions on the previously created data catalog tables. Next, within Amazon Quick Suite run customized Amazon Athena queries across the multimodal catalogs for patient-level insights or against a specific data modality for population-level analysis. These queries are saved as Quick datasets which are automatically converted to Super-fast, Parallel, In-memory Calculation Engine (SPICE) format for fast, in-memory performance. For patient-level dashboards, create an analysis using the corresponding Quick dataset to generate a focused, single-patient view. For population-level dashboards, create one analysis and add multiple Quick datasets, one for each data modality, to build a consolidated cross-modal view. Once your dashboards are ready, add them to Amazon Quick Space and conversationally interact with your space via Quick Chat. From there, you can iteratively build new visualizations to surface additional multimodal insights as needed. The population-level dashboard includes the following:
Clinical analysis: This provides an overview of patient demographics, encounters, diagnoses, procedures, and insurance claims across the cohort.
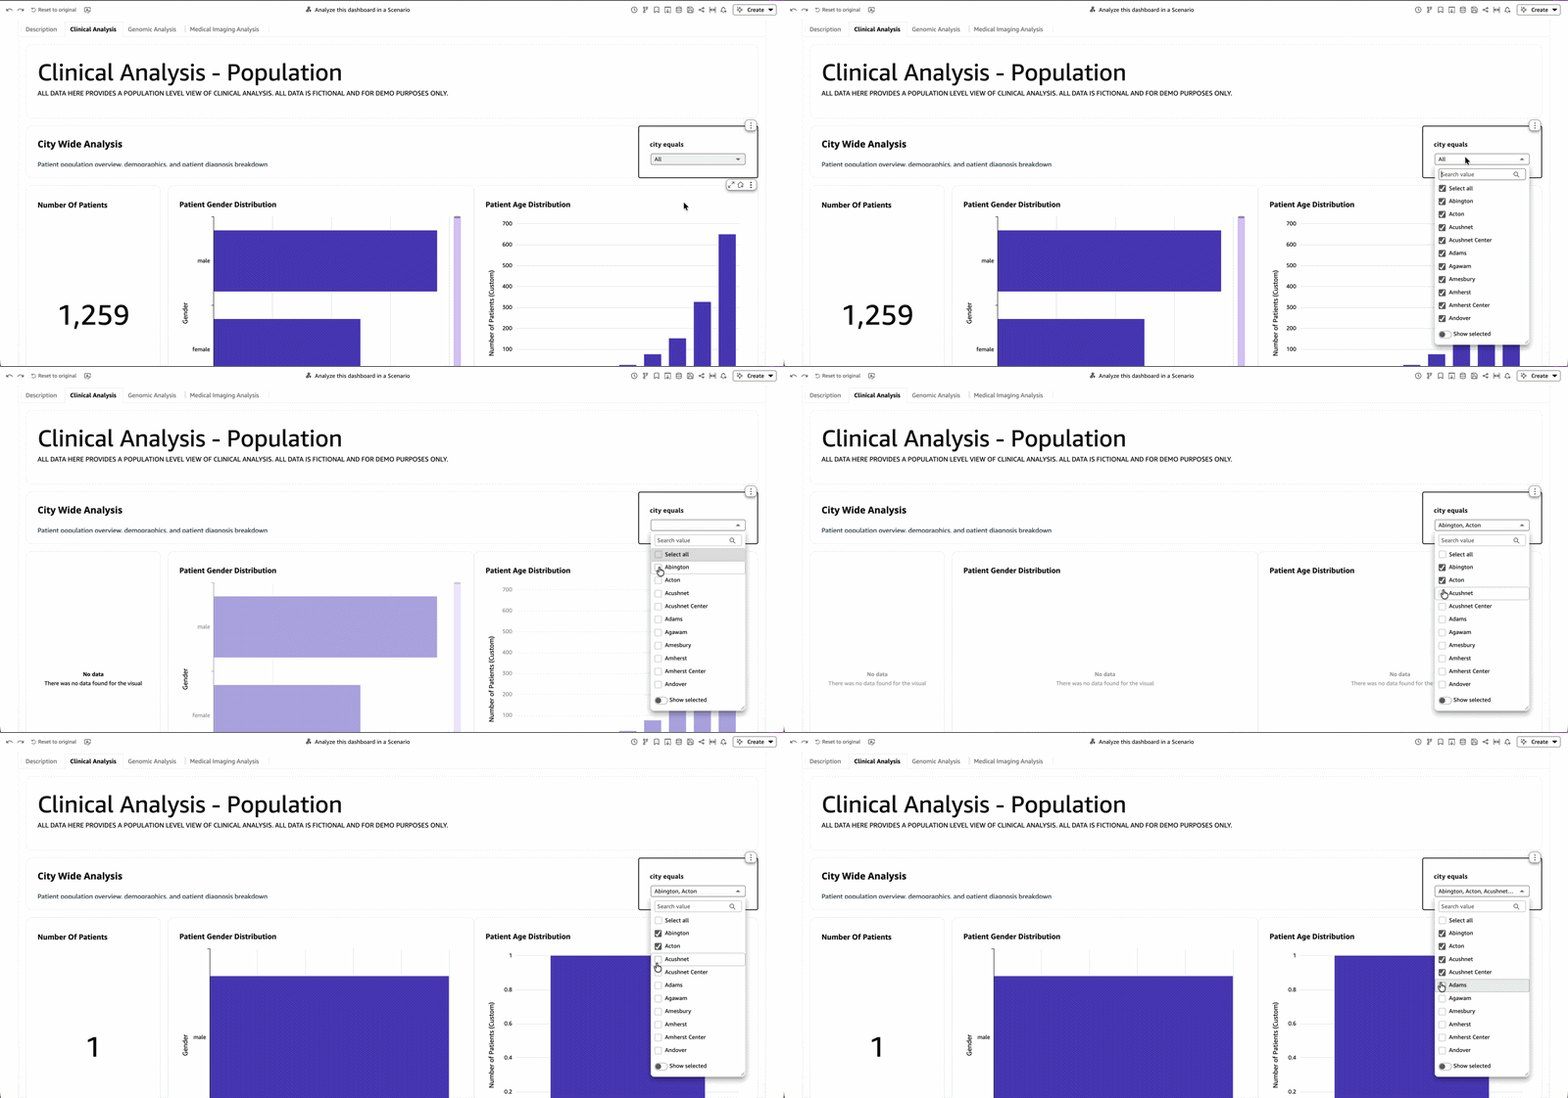
Figure 3: Population-level data visualization dashboard for clinical data.
Genomic analysis: This provides an overview of genomic data at the population level, including types of genes, clinical significance of those genes, and distribution of cases.
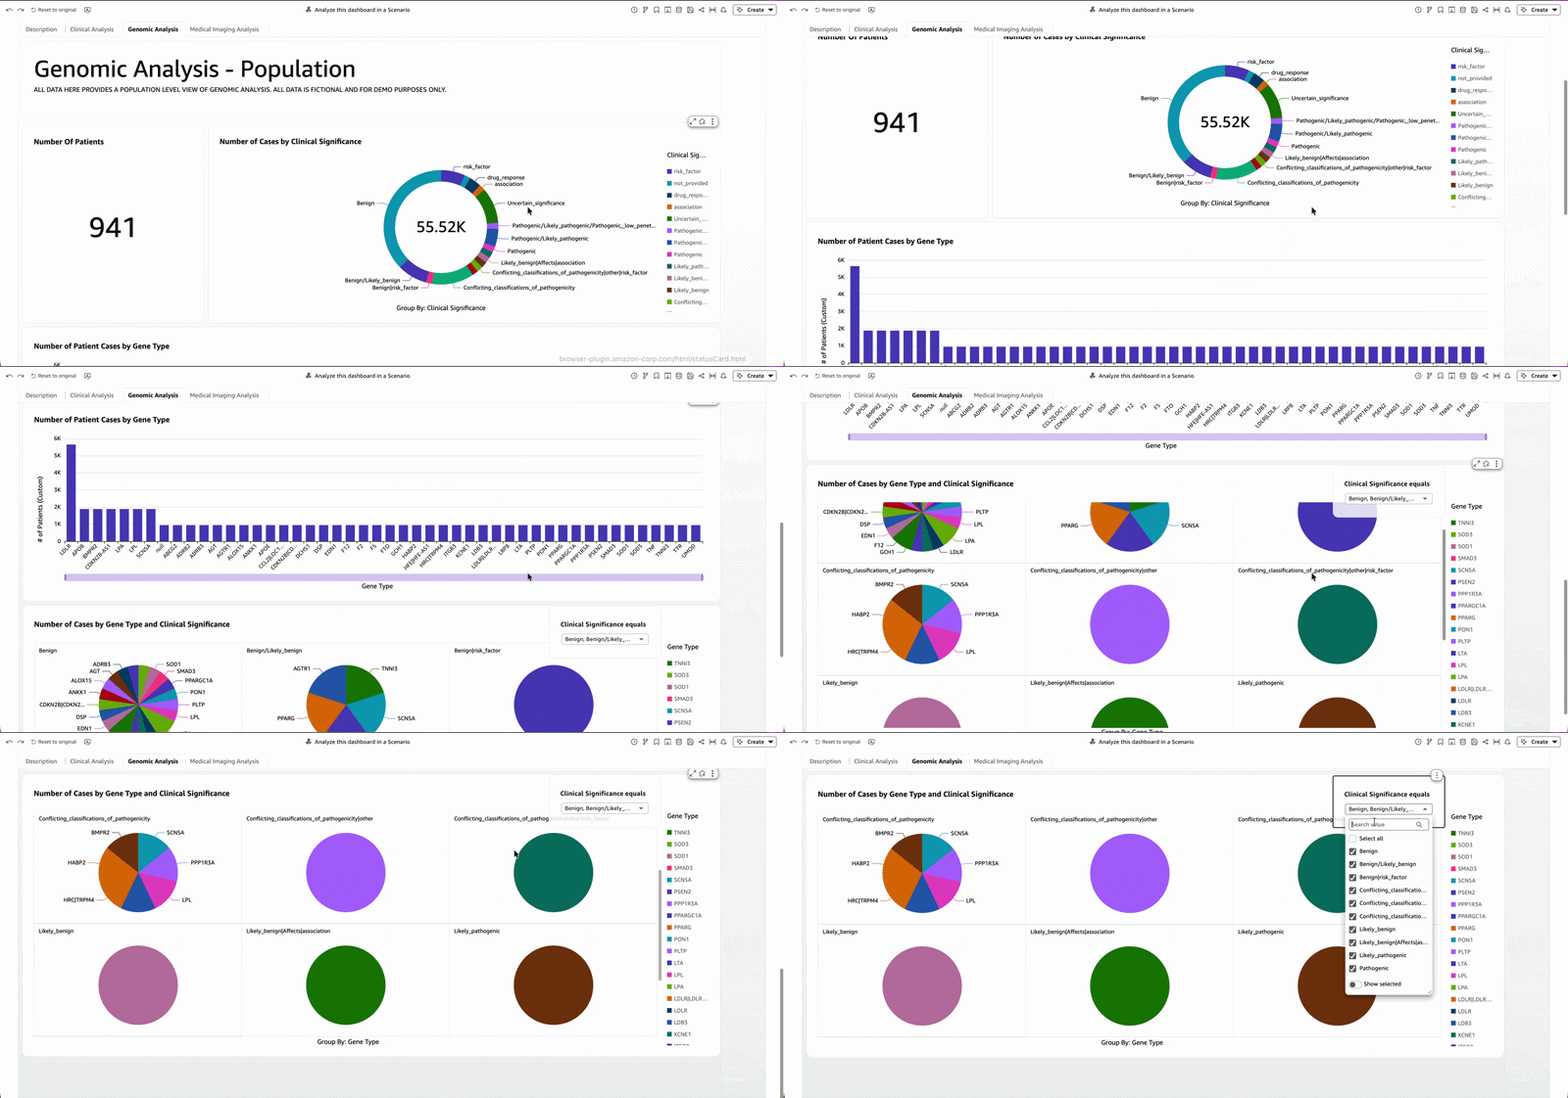
Figure 4: Population-level data visualization dashboard for genomic data.
Medical imaging analysis: This provides an overview of medical imaging data at the population level, including first-order statistics describing the distribution of voxel intensities within the image region segmented by the MONAI model.
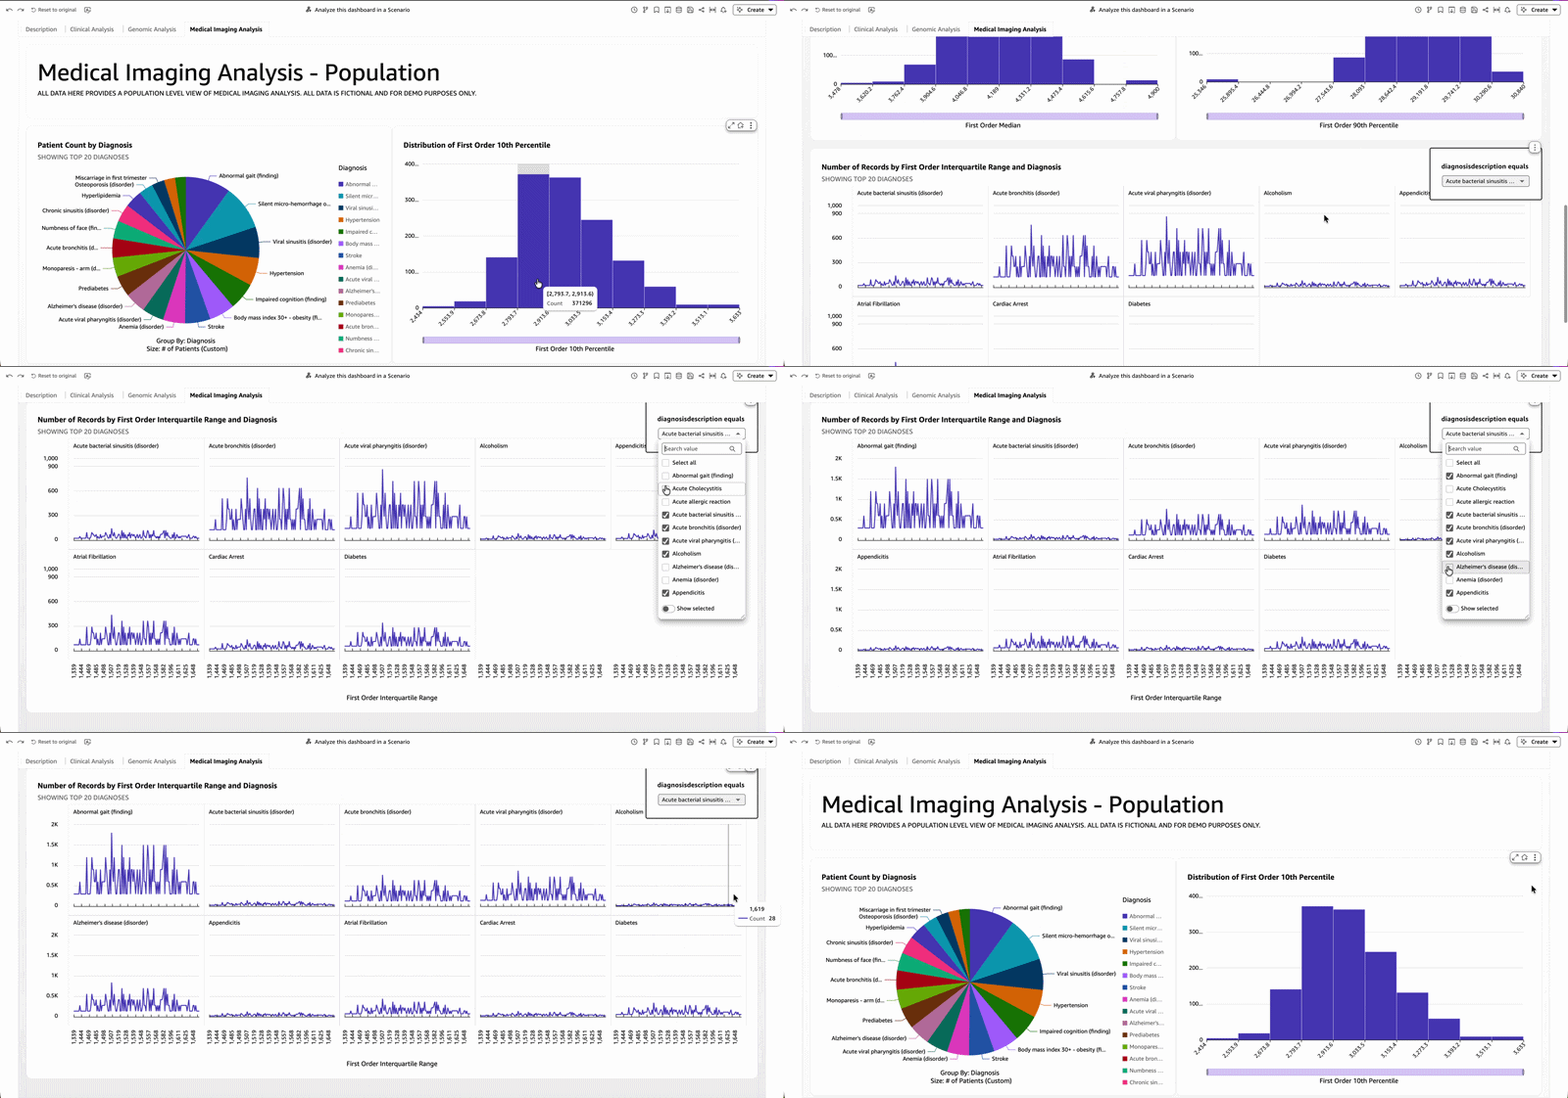
Figure 5: Population-level data visualization dashboard for medical imaging data.
The patient level dashboard provides a single visual interface to help clinicians get a complete view of a patient across multiple data modalities (clinical, genomic, and medical imaging). Selecting a Patient ID from the dashboard menu automatically filters the underlying data and generates visualizations across multiple data types.
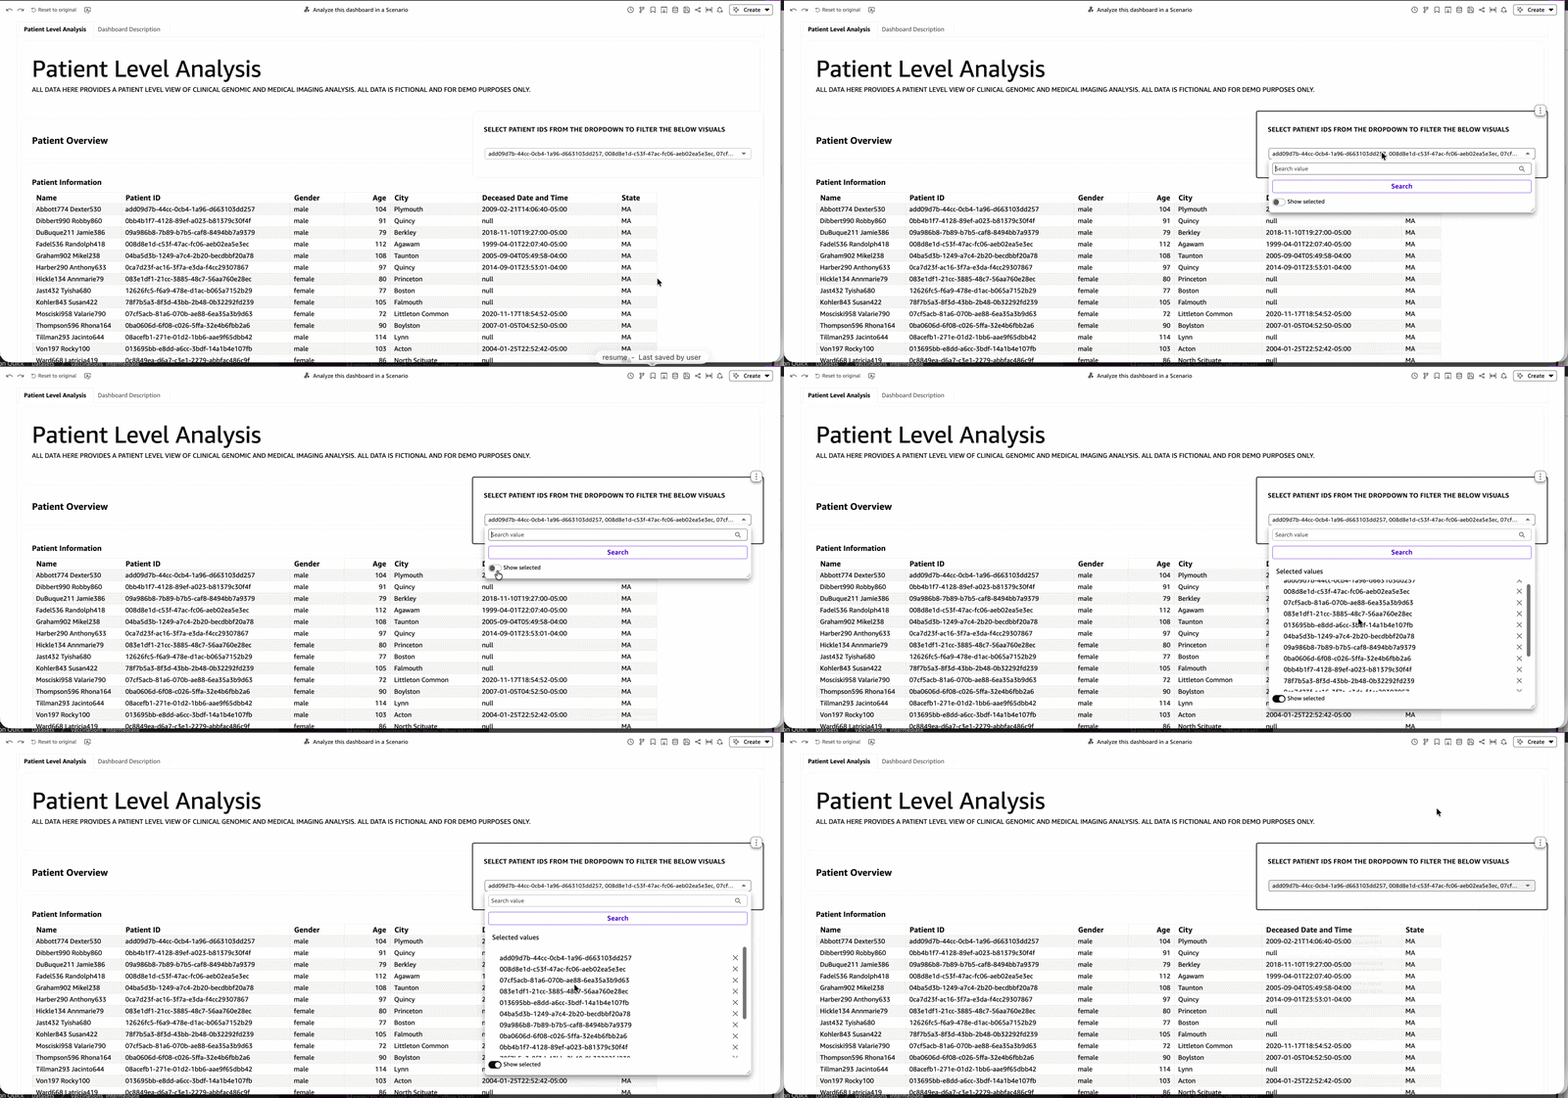
Figure 6: Patient-level data visualization dashboard for clinical, genomic, and imaging data.
Conclusion
In this post, we demonstrated how to ingest multimodal HCLS data into purpose-built AWS services, establish unified governance using Amazon SageMaker Catalog for cross-modal discovery and access control, and build interactive visualization dashboards with Amazon Quick for population and patient-level insights. In Part 2, we build a multi-agent system using Amazon Bedrock AgentCore and Strands Agents SDK, train predictive models with Amazon SageMaker AI, and ground our agents’ responses in published clinical evidence.