AWS Global Infrastructure and Sustainability Blog
How AWS estimates embodied emissions of IT hardware: The science and technology behind the latest customer carbon footprint methodology
AWS recently updated the Customer Carbon Footprint Tool to include Scope 3 emissions for fuel and energy related activities (FERA), buildings and equipment, and IT hardware. This post dives deep into the scientific methods and technology stack behind how we calculate embodied emissions for IT hardware. We take you behind the scenes into the framework tackling a complex sustainability challenge: measuring the embodied carbon emissions for millions of parts in AWS data centers. This is important for two reasons. First, it gives customers insights into how scope 3 emissions attributed to their cloud workloads are measured. Secondly, it helps AWS prioritize investments into technologies and processes that help decarbonize IT hardware in our data centers.
This blog complements the IT hardware Scope 3 section of the AWS customer carbon footprint methodology document, explaining the design decisions behind our framework. Specifically, you will learn:
- How our IT hardware Scope 3 estimation workflow is structured
- How our framework and scientific methodology are designed to monitor and maintain data quality
- How we used technology, AI, and large language models to automate portions of the workflow
- How we are partnering with external research partners to improve data quality and collection
This explainer post provides an overview of the reasoning and decisions behind our methodology, and we encourage readers to explore the detailed formulas in our methodology document for a deeper understating.
The customer carbon footprint methodology is informed by industry standards
When customers ask about the carbon footprint of their workloads, they are interested in both the operational emissions associated with their compute workloads and embodied emissions associated with the manufacturing of data center hardware. Operational emissions refer to direct emissions (Scope 1) from data centers and emissions arising from the electricity consumption (Scope 2) to power data centers, while embodied emissions (Scope 3) represent indirect carbon emissions across the value chain of cloud services, such the manufacturing of the servers, storage devices, networking equipment, and other hardware powering their cloud workloads. Embodied emissions are measured using life cycle assessment, or LCA, to calculate the equivalent carbon (CO2e) during product manufacturing, assembly, use, and end-of-life disposal as defined in ISO 14040, ISO 14044, and in the GHG Protocol Product Life Cycle Accounting and Reporting Standard. Building a credible LCA involves knowing how the product is manufactured, what materials are used to manufacture the product, and how it is transported. However, these factors are often difficult to estimate accurately because they are embedded within complex, multi-tiered supply chains.
Our methodology to estimate embodied emissions has evolved beyond spend-based calculations like Economic Input Output (EIO), which measures carbon intensity based on financial spend. While EIO provides directional insights into macro-level carbon hotspots, it can yield misleading results when applying a sector level emission factor in sectors with heterogenous products and business models. To address these limitations, we developed a process-based LCA methodology that uses a tiered methodological approach to immediately provide more accurate embodied emissions estimates while also creating a framework for continuous data quality improvements.
IT hardware explained
IT hardware refers to the physical components operating behind the scenes each time you spin up an Amazon EC2 instance, store a file in an Amazon S3 bucket, or integrate with resources in your virtual private cloud. These cloud services rely on tangible components such as processors (CPUs and GPUs), memory (RAM), storage (solid state and hard drives), and network switches. IT hardware also includes mechanical assemblies to arrange and secure these systems inside mechanical enclosures, power supply, and battery back-up units. A complete server rack uses both commodity parts and AWS designed components, such as Graviton processors and Trainium AI accelerators as illustrated in figure 1.
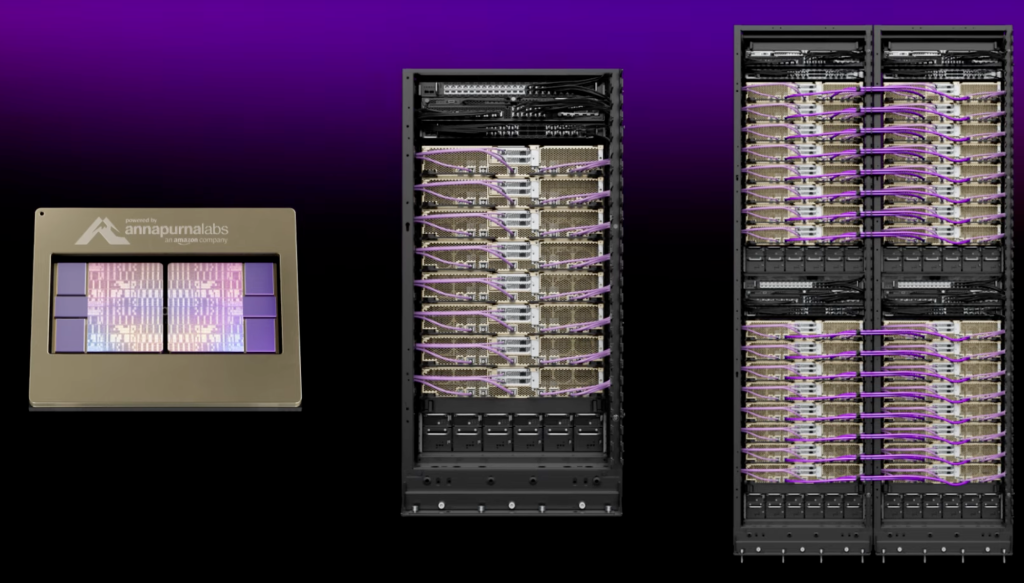
Figure 1: Example of a server rack specialized for AI training using AWS Tranium-2 processors. https://aws.amazon.com/ai/machine-learning/trainium/
Our IT hardware LCA approach
Server rack configurations vary widely depending on their intended purpose and the cloud workloads they support, necessitating a methodology that differentiates the carbon footprints associated with the equipment used inside server racks. Figure 2 provides a generalization based on real data of how carbon distribution varies based on the workload the server supports. This is why we’ve developed a science-based methodology to ensure our carbon accounting process remains consistent, comprehensive, and repeatable across equipment used in our global infrastructure.
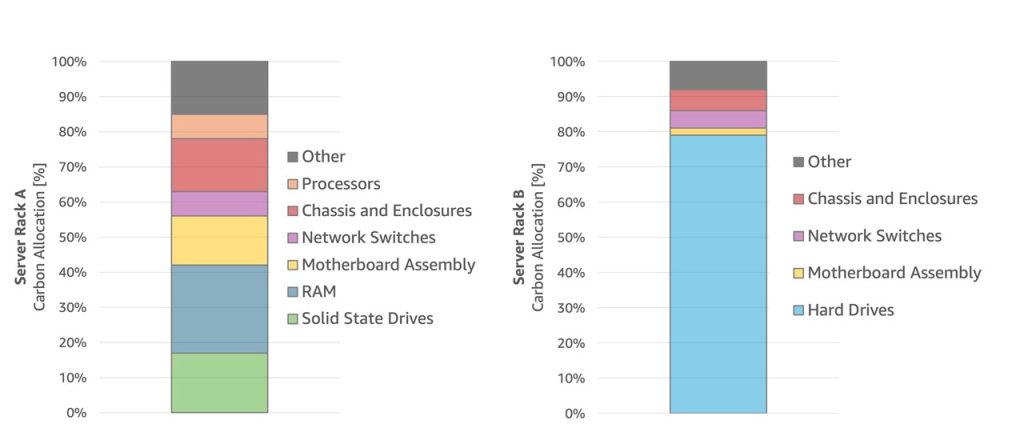
Figure 2: Example embodied carbon allocation profile for two server rack configurations supporting different workloads. Server rack A is a representative carbon allocation for a compute server, and server rack B shows representative allocation for a storage rack. These graphs are generalizations of how carbon is allocated in two different server racks. The data in the figures are for illustrative purposes only and should not be relied upon.
Our rack asset-specific LCA approach characterizes cradle-to-gate embodied emissions for each individual server rack based on its bill of materials (BOM). Cradle-to-gate refers to environmental assessments between the raw material procurement (such as iron ore mining operations for steel) to transportation of the fully assembled server rack to our data centers. This granular approach enables us to differentiate between the carbon impact of server racks supporting different cloud services. In practice, this process starts with our Product Lifecycle Management (PLM) systems to provide a single-entry point to collect the BOM list for server components. The PLM serves as the tool to initiate a workflow to calculate the emissions of all server racks used in the AWS global infrastructure. As figure 3 shows, this workflow relies on collecting, aggregating, and portioning embodied carbon emissions in four steps:
- Data Generation: measure the embodied carbon for each IT hardware components down to the smallest part
- Aggregation: build server rack-level embodied carbon profile based on IT hardware and fungible components in the rack
- Amortization: break down the total embodied emissions to a monthly embodied carbon emissions quantity
- Allocation: distribute the amortized emissions to AWS customer accounts based on service and rack asset usage.
We will analyze this workflow in the following sections.
Step 1: data generation for IT hardware
Our data generation process applies four embodied carbon calculation pathways to accommodate the varying granularity in our PLM BOM list. Since no single calculation approach works for all system elements, this multi-pathway strategy helps us assess carbon impacts based on available product details and significance of the component as a hotspot. These four pathways, illustrated in figure 3, are PLCA-Eng, parametric PLCA with extrapolation, RCA-LCA, and EIO. The first three (PLCA-Eng, parametric PLCA with extrapolation, and RCA-LCA) are referred to as process-based LCA pathways since they entail a bottom-up approach to quantify embodied carbon based on the individual processes and materials applied in product manufacturing. Process-based LCA pathways apply emission factors from industry recognized sources, such as imec.netzero and ecoinvent, as well as primary data directly from manufacturing sources when available. The fourth pathway, EIO, is the fallback spend-based pathway using US EPA’s USEEIO sector-average emissions factors per dollar. Let’s explore each of the three process-based LCA methods next.
Process-based LCA with engineering attributes (PLCA-Eng)
This represents our highest fidelity modeling approach. It applies cradle-to-gate life cycle assessment to map carbon emissions factors based on BOM and manufacturing assembly processes. The BOM list is obtained from our PLM system and considers physical dimensions, manufacturing processes, material compositions and other engineering attributes. This allows our process to calculate emissions from raw material extraction through manufacturing based on allocated activities. This pathway ensures the activities and materials remain consistent even as emission factor databases receive regular updates. One example component where we apply PLCA-Eng is integrated circuits, which applies to the silicon chips used in CPUs, GPUs, SSDs, RAM modules, and other components. Our PLCA-Eng models evaluate imec.netzero data using attribute data like die size and technology node as input to correlate manufacturing effort with raw materials, fabrication energy and process gasses. When direct measurements are not available, our model uses a hierarchical decision tree to estimate die-to-package size ratio based on third party research available from TechInsights.
Parametric process-based LCA with extrapolation
When complete engineering data isn’t available, we build parametric models to estimate emissions based on product technology, material characteristics, and deep research. For example, with solid state drives, we’ve developed methodology to account for emissions based on storage capacity, supplier, and technology generation. This approach combines data analysis, machine learning, and mechanical CAD models to build estimations models. Our approach is to parameterize models based on embodied carbon emissions from PLCA-Eng, supplier fed information, and third-party emissions data. Each component category has a unique extrapolation model that is maintained and updated on a regular cadence.
Representative category average LCA (RCA-LCA)
The RCA-LCA pathway is specifically developed for small components extensively used inside server racks that have partially defined BOMs. An example component where RCA-LCA is applied is on cable connectors. Using RCA-LCA, we automate embodied emissions calculations for thousands of connector types by evaluating physical attributes like pin count and size. This pathway selects an emissions factor based on part description using large language models (LLM) in Amazon Bedrock. Under the hood, the method applies a RAG Generative AI architecture and K-nearest neighbor (KNN) classification in Amazon OpenSearch Service to converge on an embodied emissions value unique to the part. This pathway applies data quality guardrails to ensure an appropriate emissions factor is applied based several criteria, such as functional units aligning to the part category.
Measuring process-based coverage
As mentioned earlier, most Scope 3 emissions data reported in our sustainability products, like CCFT, use process-based LCA. For each rack and for the footprint, we track “process-based coverage”, defined as the percentage of contributing component carbon calculated using process-based LCA vs. spend-based LCA. This coverage percentage is influenced by our aggregation methodology, described in the following section.
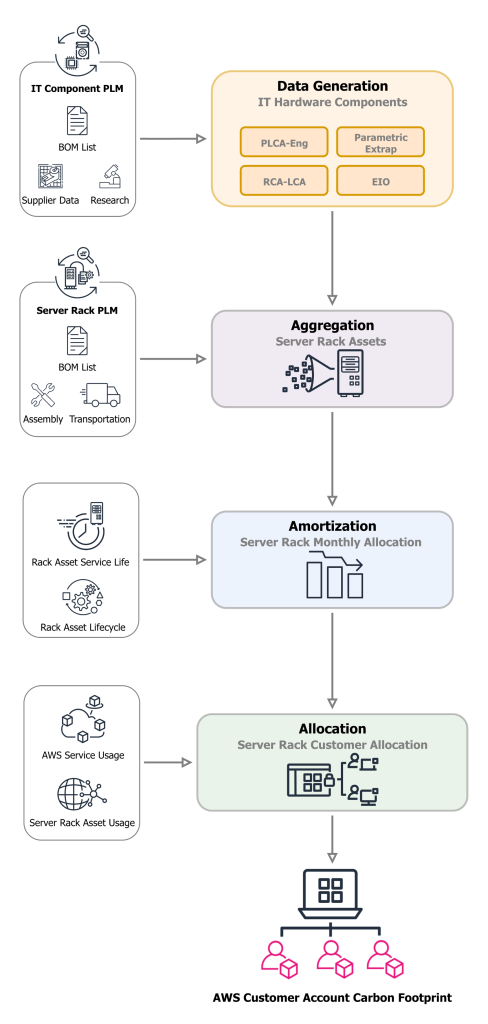
Figure 3: Definition of the scope 3 IT hardware LCA workflow.
Step 2: estimating server rack emissions using aggregation
Aggregation is the process of calculating the total embodied emissions of a rack based on the carbon of its constituent components (step 1) and their corresponding Composite Quality Scores (CQS). Each component is assigned a CQS score based on its LCA pathway. Next, an algorithm walks through the hierarchically organized BOM for each server rack assembly, comparing the CQS score of each parent node to the aggregate, carbon-weighted CQS score of its child nodes. The algorithm selects the nodes corresponding to the highest CQS scores so that rack carbon is calculated from the best quality carbon data available. The algorithm also accounts for component fungibility by weighting quantity and volume across exchangeable components.
Transportation emissions are calculated as last-mile transport from rack system integrators to AWS data centers using the total weight of the rack asset, the distance traveled per transport mode, and transport-specific emission factors. This is separate from first-mile transportation of individual components to system integrators, which is already included in the component-level modeling. Finally, the model integrates carbon emissions associated with assembling and testing server racks with transportation of server racks to AWS data centers to determine the total impact.
When direct BOM-based calculations are unavailable due to missing data or percent process-based coverage is low, rack emissions are estimated using an extrapolation model built with AutoGluon Tabula in Amazon SageMaker. These models predict emissions based on rack characteristics like server count, weight, dimensions, and cost, trained on data from process-based LCA methodologies.
Step 3: amortization and asset depreciation
Amortization is the process to fairly distribute the embodied carbon emissions across all customers who benefit from that equipment during its lifetime. This process is necessary since the carbon emissions from manufacturing of IT hardware equipment happen upfront, but that equipment serves many customers over several years of its useful life. Any cloud service user that runs a workload on that hardware shares a portion of the emissions for a point in time of that components’ lifetime. The customer carbon footprint amortization methodology accounts for this by distributing embodied carbon emissions from IT hardware across their service life and then allocates such emissions based on the usage of the cloud services running on that hardware. Using linear depreciation over the expected service lifetime, the methodology calculates monthly amortization rates to ensure total embodied carbon of each asset is fully allocated to cloud service users over its operational life. This workflow tracks deployment and retirement dates to determine active time periods. For early retirements the amortization period continues until the planned retirement date. Server racks with late retirement have zero additional emissions beyond the planned service life.
Step 4: allocation to customer accounts
The customer carbon footprint methodology allocates IT hardware carbon emissions to customer accounts based on actual usage. This approach prioritizes physical allocation over economic allocation methods. Physical allocation refers to resource consumption such as compute hours, storage size, and network usage. This approach allocates carbon based on AWS resources consumed, rather than spend-based distributions.
The server rack emissions are allocated to specific AWS services based on how such services utilize the underlying IT hardware infrastructure and based on cross-services interdependencies. The model distinguishes between foundational services and non-foundational services. Foundational services have dedicated infrastructure such as Amazon EC2 and Amazon S3. Server rack emissions are allocated to these services based on the IT hardware mapped to the corresponding fleet. Non-foundational services like AWS Lambda, AWS AppSync, and Amazon Athena, share infrastructure resources and thus the emissions allocation is based on how they utilize foundational services.
Finally, service level emissions are distributed to customer accounts using physical allocation for foundational services based on metered usage, and economic allocation for non-foundational services. This methodology facilitates carbon emission allocation to customers who benefit from the underlying infrastructure, while also accounting for infrastructure ramp-up periods to maintain fairness across different customer usage patterns.
Using AWS services for workflow orchestration
No AWS technical blog would be complete without an architecture diagram, so we’re sharing the CCFT technology stack in figure 4. While an entire blog post can be dedicated to the architecture alone, the diagram illustrates the underlying AWS services powering the LCA pipeline. The infrastructure is built primarily using a serverless architecture to allow automatic resources scaling as the LCA workloads grows.

Figure 4: Architecture diagram and AWS Services used by the CCFT LCA pipeline.
Amazon Managed Workflows for Apache Airflow (MWAA) is used to orchestrate and monitor data and machine learning operations across millions of records through directed acyclic graphs (DAGs). This approach provides straightforward monitoring of data quality metrics and creates entry points to integrate with AWS machine learning services, such as SageMaker for rack assembly extrapolation and Bedrock for RCA-LCA emission factor mapping. Throughout the architecture, we leverage AWS Glue for its ability to transform data and scale to millions of records without requiring manual resource provisioning, making it ideal for our large-scale carbon accounting calculations.
Our commitment to scientific accuracy
The methodology outlined in this blog represents years of scientific development, commitment to transparency, and active participation in industry groups to develop and refine solutions as part of our continuous improvement framework. This commitment to scientific rigor extends our work to help standardize IT hardware carbon accounting and promote comparability and accuracy across industry. While we leverage existing ISO and GHG Protocol standards, current guidelines lack specificity for the information & communication technology (ICT) sector. Without clear standardized guidelines, this creates inconsistencies in carbon footprint calculations across data center operators, as different methodologies and assumptions can produce varying results.
To support industry cohesion, we’re co-funding industry collaborations to develop frameworks to provide specific guidelines for measuring sustainability impact in IT hardware through Product Category Rules (PCRs). A PCR is a consensus-based rules framework developed by industry peers to provide specific guidelines and requirements for measuring the sustainability impact for a particular category of products or services, in this case IT hardware. We’re partnering with Fraunhofer, a leading applied research organization, and the Open Compute Project (OCP) foundation, also supported by other major cloud service providers. Our objective is to support comprehensive LCA rules for IT hardware that align with established standards such as ISO 14040, ISO 14067, ISO 14044, and the Greenhouse Gas Protocol. The PCR aims to standardize terminology, methodologies, data requirements, and reporting guidelines to provide definitions on geographical scope, calculation rules, and system boundaries.
While the PCR specifically seeks to address data center equipment including PCBAs, memory, integrated circuits, mechanical components, and rack-level peripherals like networking equipment, we’re already implementing advanced techniques to enhance the accuracy of our carbon calculations. For example, our methodology today integrates design specific emissions data through imec.netzero aiming to provide customers with more accurate embodied carbon footprints for their cloud workloads based on the latest CPU and GPU manufacturing practices. This level of precision enables us to build tooling to track the environmental impact of customers’ AWS usage with greater confidence.
Take action
For a more in-depth read and to learn more about the scientific methods implemented in our customer carbon products, you can read our methodology document or share your feedback and questions on the AWS:repost for the CCFT. The CCFT is available in the AWS Billing and Cost Management Console. To learn more about how you can implement a data platform to support LCA workloads like the one in this blog, visit the Guidance for Sustainability Data Management on AWS. Stay tuned to the AWS sustainability blog channel for more information on investments we are making into technologies and processes that help decarbonize IT hardware in our data centers that are informed through this work.
Acknowledgement
The authors extend their sincere gratitude to the exceptional individuals whose expertise and dedication were instrumental in developing and implementing the IT hardware model for the AWS Customer Carbon Footprint Tool. We deeply appreciate the contributions of Vinny Ferrero, William Schuerman, Justin Campbell, Natalie Valett, Neha Koushik, Ray Song, Jhalak Goyal, Rahul Hari, Austin Tucker, Ngozi Lawanson, Paul Mazurkiewicz, Mengya Tao, Zaid Thanawala, and Alexis Bateman.